Department of CSE, ECE & EEE, Magna College of Engineering, Chennai-600055, India.
Performance & Analysis of Automatic Vehicle
Braking System Using Light Fidelity
1
G.Sankar Babu 2 Dr.M.Anto Bennet , 3R.Kaushik Krishna, 4 B.S.Jaya Vignesh, 5S.Jaya Prakash
1
Assistant Professor, Dept. of ECE, VELTECH, Avadi, Chennai, Tamilnadu, India
2
Professor, Dept. of ECE, VELTECH, Avadi, Chennai, Tamilnadu, India
3,4,5
UG Students, Dept. of ECE, VELTECH, Avadi, Chennai, Tamilnadu, India
ABSTRACT: Wireless radio frequencies are getting higher, complexities are increasing and RF interferences continue
to grow. In order to overcome this problem in future, light –fidelity (Li-Fi) technology came into existence . Li-Fi is a wireless communication system in which light is used as a carrier signal instead of traditional radio frequency as in Wi-Fi. Li-Fi is a technology that uses light emitting diodes to transmit data wirelessly. Visible light communication (VLC) uses rapid pulses of light to transmit information wirelessly that cannot be detected by human eye. This paper will focus on Li-Fi technology over Wi-Fi technology and challenges for the new VLC technology and Li-Fi technology in automation safety measures.
KEYWORDS: Wi-Fi. Li-Fi
I. INTRODUCTION
Presently, the requirements for advanced automotive safety and driver assistance systems are being made stricter to avoid or mitigate accidents at an early stage. Radar sensors are commonly used because of their r obust obstacle detection even under adverse weather conditions. Because of diverse highway and urban scenarios, radar sensors must cope with different target types and scenarios. To realize automatic brake assistances or adaptive cruise control systems, they must observe forward targets and determine their exact location.
Automotive targets have several distributed scattering centers on the outer shell [1]. The reflection center with the highest reflectivity will end up as the primarily tracked object after signal processing. Knowing the exact location of the scattering centers improves the accuracy of the distance to target and, at least for shorter distances, allows estimating the target dimensions and orientation. However, closely spaced scattering centers affect the overall backscattered radar signal. Preliminary high-resolution knowledge of the main locations of the scattering centers can help to specify a radar system. It can also improve signal processing, even if several scattering centers are situated within the antenna beamwidth
II. FLUCTATION OF THE TARGET SIGNATURE
ISSN (Online) : 2319 - 8753
ISSN (Print) : 2347 - 6710
I
nternationalJ
ournal ofI
nnovativeR
esearch inS
cience,E
ngineering andT
echnologyAn ISO 3297: 2007 Certified Organization Volume 4, Special Issue 11, September 2015
National Conference on Emerging Trends in Computing, Communication & Control Engineering [NCET 2K15]
On 4th September, 2015
Organized by
Department of CSE, ECE & EEE, Magna College of Engineering, Chennai-600055, India.
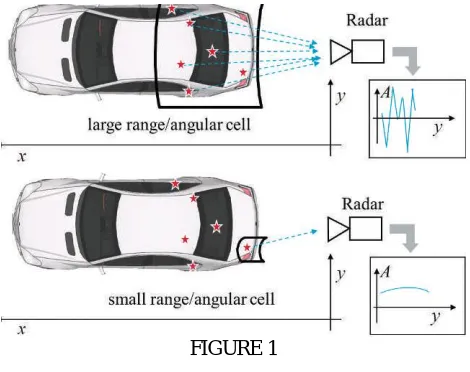
lateral displacement (in the y-direction) will result in amplitude fluctuation. By adapting the bandwidth and the angular resolution to the location of the main scattering centers, this effect can be reduced and the target signature stabilized.
III. MEASUREMENT OF THE SCATTERING CENTERS
Synthetic aperture radar (SAR) processing can be used to precisely determine the different locations of the scattering centers. SAR allows range-independent cross-range resolution, while a large bandwidth of 7 GHz in these investigations gives a range resolution of approximately 3 cm. In the following, the influence of the carrier frequency (24/77 GHz), the bandwidth, and the target type on the scattering centers location will be presented. A combination of SAR and digital beam forming (DBF) for analyzing the scattering center distribution in elevation as well are also presented in
this article. To compare these results with those of a radar
with conventional antennas, a mechanical scanned antenna is applied to scan the azimuth and elevation angles.
FIGURE 1
IV. PROPOSED SYSTEM
Figure 2(a) shows the basic block diagram of the measurement setup and Figure 2(b) the mechanical setup used for the SAR measurement. The system consists of an FMCW radar sensor mounted on a height-adjustable linear drive unit with a maximum drive path of 6 m, the control electronics [3] of the sensor [4], a notebook, stepper driver, and stepper motor. The computer starts the measurement procedure with the calibration of the stepper motor and the initialization
Department of CSE, ECE & EEE, Magna College of Engineering, Chennai-600055, India.
FIGURE 2
(a) Block diagram of the measurement setup for the scattering center analysis at 24/77 GHz. (b) Scheme of the linear unit for SAR and SAR in combination with DBF processing. (c) Scheme of the pan-tilt unit of the mechanical scanning
antenna [9].
Automotive radar sensors are operated at a carrier frequency around 24 GHz or 77 GHz. To analyze the main scattering centers of a car, four different sensor/antenna configurations, listed in Table 1, have been used for the different measurement campaigns.
For the SAR evaluation of the car rear end in range and azimuth cross range, the 24 GHz radar sensor 1 of Table 1 using a folded reflect array antenna was attached to the linear drive unit. To compare this measurement result with 77 GHz, radar sensor 2 of Table 1 was attached to the linear unit for further investigation. This sensor used a reflect array antenna as well, but with a one-way half power beamwidth (HPBW) of 2.6° [5]. Extending the analysis of the scattering centers to the third dimension (elevation), a sensor with a switched antenna array for digital beamforming in elevation combined with a cylindrical lens was used; see sensor 3 of Table 1. The array antenna consists of 32 patch radiators to which the transmit signal is switched successively, together with two continuously receiving antenna elements. An equivalent synthetic aperture of 64 antennas elements is formed by this concept [6], and delay & sum beam forming can be applied to process the position of scattering centers in elevation as well.
ISSN (Online) : 2319 - 8753
ISSN (Print) : 2347 - 6710
I
nternationalJ
ournal ofI
nnovativeR
esearch inS
cience,E
ngineering andT
echnologyAn ISO 3297: 2007 Certified Organization Volume 4, Special Issue 11, September 2015
National Conference on Emerging Trends in Computing, Communication & Control Engineering [NCET 2K15]
On 4th September, 2015
Organized by
Department of CSE, ECE & EEE, Magna College of Engineering, Chennai-600055, India.
Figure 3 shows the Li-Fi technique is used here in the vehicle safety measurement system. A Emergency data will be transmitted through the back light of the vehicle. And the Li-Fi receiver module will be placed to the front panel of the vehicle and it is connected to the engine through the controller. When sudden brakes or close brakes have been applied this emergency message will transmitted through this Li-Fi transmitter ie., back red led’s. The Lifi Receiver that as been connected to the vehicle receives it and controlls the speed of the engine automatically to avoid the collision of the vehicles
V. SAR PROCESSING OF THE CAR REAR END
In the following, the rear ends of two target vehicles are investigated by the strip map mode of the SAR processing [7] using sensor 2 (see Table 1). The targets are a smart for two (A) and a Mercedes-Benz S-Class (B). The height of the linear unit was adjusted to 0.6 m, and the maximum measurement drive path was 2.3 m. Targets A and B were placed in front of the radar sensor at distances of 12.7 m and 10.5 m, respectively.
Target A had a small lateral misalignment of −4°.
In Figure 4, the two-dimensional SAR measurement results of the rear ends of the two cars are depicted; the exact contours of the vehicles under test are overlaid in white. The scattering analysis shows the main scattering centers in the regions of rear tire tread, rear lights, and the license plate. Furthermore, both targets exhibit scattering centers at the windshield pillars in combination with the rear view mirrors. Because of symmetry, these scattering centers should appear on both sides; however, the misalignment of target A reduces the received power from these scattering centers because they are masked by the vehicle rear end.
FIGURE 5 SAR processed radar images of the vehicle rear ends at 77 GHz with a bandwidth of 7 GHz [9].
Department of CSE, ECE & EEE, Magna College of Engineering, Chennai-600055, India.
FIGURE 4 Comparison of the location of the scattering centers at 24 GHz and 77 GHz of the vehicle rear end with a sensor bandwidth of 2 GHz [8].
VI. COMPARISON OF DIFFERENT BANDWIDTHS AT 77 GHZ
The comparison of different bandwidths allows for analysis if there are physical limits with regard to the spacing of two neighboring main scattering centers. Hence, radar sensor 2 was attached to the SAR measurement unit. The rear end of the car was analyzed by varying the range resolution, adjusting the bandwidth from 0.5 GHz to 7 GHz at the center frequency of 77 GHz. The reduction of the range resolution was done by reducing the sweep time duration of the transmitted linear FMCW sweep, maintaining a constant slope of 3.571 GHz/ms.
FIGURE 6 Influence of three different bandwidths on the representation of the vehicle rear end at 77 GHz [8].
However, reducing the time duration of one linear FMCW sweep reduces the signal level, and hence the signal-to-noise ratio (SNR) declines from 7 GHz to 0.5 GHz. The relative power of each measurement result, shown in Figure 5, is normalized to the highest occurring signal peak of the measurement for the 7 GHz bandwidth Reducing the bandwidth increases the range cell size. Hence, the number of scattering centers within one range cell increases, and the superposition of each backscattered signal leads to the merging of the scattering centers.
ISSN (Online) : 2319 - 8753
ISSN (Print) : 2347 - 6710
I
nternationalJ
ournal ofI
nnovativeR
esearch inS
cience,E
ngineering andT
echnologyAn ISO 3297: 2007 Certified Organization Volume 4, Special Issue 11, September 2015
National Conference on Emerging Trends in Computing, Communication & Control Engineering [NCET 2K15]
On 4th September, 2015
Organized by
Department of CSE, ECE & EEE, Magna College of Engineering, Chennai-600055, India.
size of the scattering center. Due to the range-independent lateral resolution in SAR processing, the width of the vehicle can still be recognized even with reduced bandwidth.
VII.3D MEASUREMENT OF THE VEHICLE SIDE
Scattering centers are not only located in one plane, as depicted in Figures 3 to 5, but also at different heights. Hence, the backscattered radar signals are also influenced by the elevation diagram of the antenna. To determine the scattering center location of the car side, DBF is used in combination with strip map SAR. As in previous measurements, the scattering centers have been obtained in azimuth by SAR processing and in elevation by DBF processing
FIGURE 7 DBF+SAR processed radar image of the vehicle side view (target B) at 77 GHz with a bandwidth of 4.8 GHz [8], [9].
.
The measurement took place in a standard asphalt lane with the sensor at a height of 0.6 m (z = 0 m) above the ground. The car was located 5 m in front of radar sensor 3. The radar sensor, using horizontal polarization, was moved in the y-direction from y = 0 m to 5.8 m in 9 mm steps. A corner reflector (designated with “A” in Figure 8) was arranged in line of sight with the radar sensor at a distance of 12 m and a height of 0.9 m (z = +0.3 m); its radar cross section (RCS) was +20 dBsm at 77 GHz. Furthermore, a corner reflector designated as “B” (RCS of +30 dBsm at 77 GHz) was located on the road surface 10 m behind the vehicle. These two corner reflectors were used as reference targets.
Figure 6 illustrates the measurement results. To clearly see the major contributing scattering centers, the minimum displayed relative power is −10 dB. The results contain reflection regions at different heights. Corner
reflectors A and B of Figure 6 seem to consist of several scattering centers in height. However, this effect is caused by the discrete number of SARprocessed elevation angles; the separation in height occurs with increasing range. In the measurement results, corner reflector B appears quite clearly, but with reduced amplitude compared to reflector A due to multipath propagation. Reflection regions C to I marked in Figure 6 stem from signal reflections from the vehicle. The outer skin of the door C has a strong reflection region starting close to the front wheel and ending close to the back wheel. However, there are two remarkable disruptions of the continuous backscattering at the door gap D of the front door. Furthermore, region C is a dynamic scattering region, depending on the incident angle of the impinging wave front. For the case of a laterally moving car, this means a sliding scattering center occurs at the shortest distance between vehicle and the radar sensor. At some incident angles, the waves are reflected away from the sensor, and no radar response will be detected.
Department of CSE, ECE & EEE, Magna College of Engineering, Chennai-600055, India.
wheel-arch panel had no significant influence on the backscattering of the vehicle. The reflection region I occurs at both the front wheel and the rear wheel, also from reflections from the road surface.
VIII. MEASUREMENT BY A MECHANICAL SCANNING RADAR
The measurements as described above provide a fine crossrange resolution (azimuth), which in principle is independent of the distance to the target. Real automotive radar systems, however, cannot use the SAR principle; consequently the lateral resolution is proportional to the distance, while the range resolution is the same for all distances. This section compares the SAR measurements of targets A and B with the response of a conventional radar sensor. Imaging methods of actual sensors like multibeam operation or digital beamforming are replaced by mechanical scanning (sensor 4 of Table 1).
For advanced safety systems, emergency braking is the preferred option if the distance is large enough; for shorter distances, evasive maneuvers may be a better choice. To this end, however, it is necessary to know the dimensions and orientations of cars in front of the sensor as exactly as possible. This can be easily determined based on the SAR results, and the measurements described below should reveal to what extent this is possible with a conventional sensor arrangement.
For these measurements, the sensor was positioned at a height of 0.6 m above ground. The azimuth and elevation angular steps of the pan-tilt were adjusted to 1° and 2°, respectively. The single path HPBW of the antenna of 2.6° results in a two-way diagram with a 3 dB beamwidth of 1.85
The elevation angle influence on the target signature of target B has been investigated in a range from −2° to
+2°. In practice, negative elevation angles occur during deceleration (the car tilts down somewhat) and positive angles during acceleration. The left vehicle side was oriented toward the sensor at a distance of 10 m with its rear end in line with the radar. Figure 7 shows the measurement results of target B with the overlaid contour in white. At an elevation angle of 0°, the front and rear wheel, the door pillar, and the rear end exhibit strong reflecting regions. Increasing the elevation angle to +2° reduces the scattering center size of the rear end, because of decreased reflection from the rear light unit. Furthermore, the right front and rear wheels disappear completely due to the changed incident angle and the shadowing effect of the body shell. At the same time, the windshield (A pillar), center (B pillar), and rear pillar (C pillar) have increased reflectivity. Adjusting an elevation angle of −2° the reflections at these pillars disappear nearly completely. However, the front and rear wheel on the right side of the vehicle emerge due to multipath propagation between the car body and ground. Because of reduced reflections at the rear end of the vehicle, the rear wheel appears more distinctly. Although some scattering centers change their reflectivity as a function of elevation angle, the wheels still display excellent reflections for estimating the target position.
ISSN (Online) : 2319 - 8753
ISSN (Print) : 2347 - 6710
I
nternationalJ
ournal ofI
nnovativeR
esearch inS
cience,E
ngineering andT
echnologyAn ISO 3297: 2007 Certified Organization Volume 4, Special Issue 11, September 2015
National Conference on Emerging Trends in Computing, Communication & Control Engineering [NCET 2K15]
On 4th September, 2015
Organized by
Department of CSE, ECE & EEE, Magna College of Engineering, Chennai-600055, India.
IX. DETERMINATION OF THE TARGET ORIENTATION
Figure 8 depicts measurement results for targets A and B at a distance of 10 m and a yaw angle of 30°. The contour of each vehicle is overlaid in white. For both targets, it can be seen that the scattering centers are arranged in an L-shape structure from which, in principle, the orientation and the dimension of the vehicle can be derived. In Figure 8 right, however, not the entire length of the vehicle can be clearly recognized because of the shallow incident angle of the radar signal at the outer panel of the fender. This mirror effect causes only the left front wheel to show strong reflections. In summary, both targets exhibit strong reflections at the left front and rear wheel, the rear light units, and in the region of the license plate. It can be seen that using a bandwidth of 2 GHz in combination with an angular resolution of approximately 2° (two-way radiation diagram) allows determining the target contour and orientation at this distance.
X. CONCLUSION
The possibilities are numerous and can be explored further. If this technology can put into practical use, every bulb can be used something like a Wi-Fi hotspot to transmit wireless data.The concept of Li-Fi is currently attracting a great deal of interest, not least because it may offer a genuine and very efficient alternative to radio-based wireless. As a growing number of people and their many devices access wireless internet, their airwaves are becoming increasingly clogged, making it more and more difficult to get a reliable high-speed signal. This may solve issues such as the storage of radio-frequency bandwidth and also allow internet where traditional radio based wireless isn’t allow such as aircraft or hospital. One of the shortcomings however is that it only work in direct line of sight.
REFERENCES
[1] Schuler, K., Becker, D., and Wiesbeck, W. Extraction of virtual scattering centers of vehicles by ray-tracing simulations. IEEE Transactions on Antennas and Propagation (Jan. 2007).
[2] Skolnik, M. Radar Handbook, 2nd ed. New York: McGraw-Hill, 2003.
[3] Mayer, W., Gronau, A., Menzel, W., and Leier, H. A compact 24 GHz sensor for beam-forming and imaging. In Proceedings of the 9th International Conference on Control, Automation, Robotics and Vision, ICARV 2006, Singapore, Dec. 2006.
[4] Feil, P., and Chaloun, T. Active switched antenna array for 77 GHz digital beamforming radar. In Proceedings of the 5th European Conference on Antennas and Propagation, Rome, Italy, April 2011
[5] Dieter, S., Fischer, C., and Menzel, W. Design of a folded reflect array antenna using Particle Swarm Optimization. In Proceedings of the 40th European Microwave Conference, Paris, Sept. 2010.
[6] Kees, N., Schmidhammer, E., and Detlefsen, J. Improvement of angular resolution of a millimeterwave imaging system by transmitter location multiplexing. Microwave Symposium Digest (1995). [9] Andres, M., Feil, P., and Menzel, W. 3D-scattering center detection of automotive targets using 77 GHz UWB radar sensors. In Proceedings of the 6th European Conference on Antennas and Propagation 2012, Prague, Czech Republic, March 2012.
[7] Feil, P., Kraus, T., and Menzel, W. Short range mm-wave SAR for surveillance and security applications. In Proceedings of the 8th European Conference on Synthetic Aperture Radar, Aachen, Germany, June 2010.

![FIGURE 5 SAR processed radar images of the vehicle rear ends at 77 GHz with a bandwidth of 7 GHz [9]](https://thumb-us.123doks.com/thumbv2/123dok_us/1525779.1187048/4.595.193.408.441.570/figure-sar-processed-radar-images-vehicle-rear-bandwidth.webp)
![FIGURE 6 Influence of three different bandwidths on the representation of the vehicle rear end at 77 GHz [8]](https://thumb-us.123doks.com/thumbv2/123dok_us/1525779.1187048/5.595.195.406.467.599/figure-influence-different-bandwidths-representation-vehicle-rear-ghz.webp)
![FIGURE 7 DBF+SAR processed radar image of the vehicle side view (target B) at 77 GHz with a bandwidth of 4.8 GHz [8], [9]](https://thumb-us.123doks.com/thumbv2/123dok_us/1525779.1187048/6.595.195.403.316.430/figure-dbf-processed-radar-image-vehicle-target-bandwidth.webp)
![FIGURE 8Elevation influence on the scattering centers of the vehicle side view using a mechanical scanning radar at 77 GHz using a bandwidth of 2 GHz [9]](https://thumb-us.123doks.com/thumbv2/123dok_us/1525779.1187048/7.595.143.408.619.725/figure-elevation-influence-scattering-centers-mechanical-scanning-bandwidth.webp)
