Measurement of the running of the fine structure constant below
1 GeV with the KLOE detector
GrazianoVenanzoni1,?, on behalf of the KLOE-2 Collaboration
1Sezione INFN/Pisa, Italy
Abstract.I will report on the recent measurement of the fine structure constant below 1 GeV with the KLOE detector. It represents the first measurement of the running of α(s) in this energy region. Our results show a more than 5σsignificance of the hadronic contribution to the running ofα(s), which is the strongest direct evidence both in time-and space-like regions achieved in a single measurement. From a fit of the real part of ∆α(s) and assuming the lepton universality the branching ratioBR(ω → µ+µ−
) = (6.6±1.4stat±1.7syst)·10−5has been determined
1 Introduction
Physics at non-zero momentum transfer requires an effective electromagnetic couplingα(s)1. The
shift of the fine-structure constant from the Thomson limit to high energy involves low energy
non-perturbative hadronic effects which affect the precision. These effects represent the largest uncertainty
(and the main limitation) for the electroweak precision tests as the determination ofsin2θ
W at the Z
pole or the SM prediction of the muong−2 [1]. The QED coupling constant is predicted and
ob-served [2, 3] to increase with rising momentum transfer (differently from the strong coupling constant
αS which decreases with rising momentum transfer), which can be understood as a result of the
screen-ing of the bare charge caused by the polarized cloud of virtual particles. The vacuum polarization (VP)
effects can be absorbed in a redefinition of the fine-structure constant, making itsdependent:
α(s)= α(0)
1−∆α(s). (1)
The shift∆α(s) in terms of the vacuum polarization functionΠ0γ(s) is given by:
∆α(s)=−4πα(0) Re [Π0γ(s)−Π0γ(0)] (2)
and it is the sum of the lepton (e,µ,τ) contributions, the contribution from the five quark flavours
(u, d, s, c, b), and the contribution of the top quark (which can be neglected at low energies):
∆α(s)=∆αlep(s)+ ∆α(5)had(s)+ ∆αtop(s).
The leptonic contributions can be calculated with very high precision in QED using the perturbation theory [4, 5]. However, due to the non-perturbative behaviour of the strong interaction at low energies,
?e-mail: graziano.venanzoni@pi.infn.it
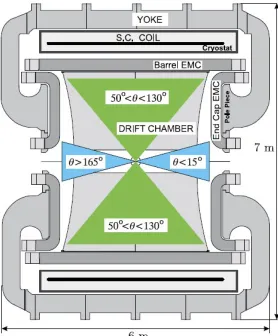
Figure 1. Detector section with the acceptance region for the charged tracks (wide cones) and for the photon (narrow cones).
perturbative QCD only allows us to calculate the high energy tail of the hadronic (quark) contribu-tions. In the lower energy region the hadronic contribution can be evaluated through a dispersion
integral over the measurede+e−→hadrons cross-section:
∆αhad(s)=−
α(0)s
3π
Re Z ∞
m2π
ds0 Rhad(s 0)
s0(s0−s−i), (3)
whereRhad(s) is defined as the cross section ratioRhad(s)=
σ(e+e−→γ∗→hadrons)
σ(e+e−→γ∗→µ+µ−) .
In this approach the dominant uncertainty in the evaluation of∆αis given by the experimental
data accuracy.
In this paper we present a direct measurement of the running of the effective QED coupling constant
αin the time-like region 0.6< √s <0.98 GeV by comparing the process e+e− → µ+µ−γ(γ) with
the photon emitted in the Initial State (ISR) to the corresponding cross section obtained from Monte
Carlo (MC) simulation with the coupling set to the constant valueα(s) = α(0). The analysis has
been performed by using the data collected with the KLOE detector at DAΦNE [6], thee+e−collider
running at theφmeson mass, with a total integrated luminosity of 1.7 fb−1.
2 Event selection
The KLOE detector consists of a cylindrical drift chamber (DC) [7] and an electromagnetic
calorime-ter (EMC) [8]. The DC has a momentum resolution ofσp⊥/p⊥ ∼0.4% for tracks with polar angle
θ >45◦. Track points are measured in the DC with a resolution inr−φof∼0.15 mm and∼2 mm in
z. The EMC has an energy resolution ofσE/E ∼5.7%/
√
E(GeV) and an excellent time resolution
ofσt∼54 ps/
√
E(GeV)⊕100 ps.
A photon and two tracks of opposite curvature are required to identify aµµγevent. Events are
selected with a (undetected) photon emitted at small angle (SA),i.e.within a cone ofθγ <15◦around
the beamline (narrow cones in Fig. 1) and the two charged muons are emitted at large polar angle, 50◦ < θµ < 130◦. High statistics for the ISR signal and significant reduction of background events
asφ→ π+π−π0in which theπ0 mimics the missing momentum of the photon(s) and from the FSR
3 Measurement of the running of
α
The strength of the coupling constant is measured as a function of the momentum transfer of the
exchanged photon √s = Mµµ whereMµµ is theµ+µ−invariant mass. The value ofα(s) is extracted
from the ratio of the differential cross section for the process e+e− → µ+µ−γ(γ) with the photon
emitted in the Initial State (ISR) to the corresponding cross section obtained from Monte Carlo (MC)
simulation with the coupling set to the constant valueα(s)=α(0):
|α(s)
α(0)|
2 =dσdata(e+e−→µ+µ−γ(γ))|IS R/d
√
s dσ0
MC(e+e−→µ+µ−γ(γ))|IS R/d
√
s (4)
To obtain the ISR cross section, the observed cross section must be corrected for events with one or more photons in the final state (FSR). This has been done by using the PHOKHARA MC event generator, which includes next-to-leading-order ISR and FSR contributions [9]. Figure 2, left, shows
the ratio of theµ+µ−γcross-section from data with the corresponding NLO QED calculation from
PHOKHARA generator including the Vacuum Polarization effects. The agreement between the two
cross sections is excellent.
(GeV) s
0.6 0.65 0.7 0.75 0.8 0.85 0.9 0.95
data/MC γ µ µ 0.9 0.92 0.94 0.96 0.98 1 1.02 1.04 1.06 1.08 1.1 /ndf=40.6354/37 2 χ
p0=1.0006 +/- 0.0008
Energy (GeV)
0.6 0.65 0.7 0.75 0.8 0.85 0.9 0.95 1
2 (0)| α (s)/ α | 0.9 0.92 0.94 0.96 0.98 1 1.02 1.04 1.06 1.08 1.1 Exp data (0) α (s)= α Th.pred. for lep (s) α (s)= α Th.pred. for lep+had (s) α (s)= α Th.pred. for
Figure 2. Left: Ratio between the measured differential µ+µ−γ
cross section and the MC prediction from PHOKHARA. The green band shows the systematic error. Right: The square of the modulus of the running α(s) in units ofα(0) compared with the prediction (provided by thealphaQEDpackage [10]) as a function of the dimuon invariant mass. The red points are the KLOE data with statistical errors; the violet points are the theoretical prediction for a fixed coupling (α(s)=α(0)); the yellow points are the prediction with only virtual lepton pairs contributing to the shift∆α(s)= ∆α(s)lep, and finally the points with the solid line are the full QED
prediction with both lepton and quark pairs contributing to the shift∆α(s)= ∆α(s)lep+had.
We use Eq. (4) to extract the running of the effective QED coupling constantα(s). By setting in
the MC the electromagnetic coupling to the constant valueα(s)=α(0), the hadronic contribution to
the photon propagator, with its characteristicρ−ωinterference structure, is clearly visible, see Fig. 2,
right. The prediction from Ref.[10] is also shown. While the leptonic part is obtained by perturbation
theory, the hadronic contribution toα(s) is obtained via an evaluation in terms of a weighted average
compilation ofRhad(s), based on the available experimentale+e−→hadrons annihilation data (for an
up to date compilation see [11] and references therein).
For comparison, the prediction with constant coupling (no running) and with only lepton pairs
By including statistical and systematics errors, we exclude the only-leptonic hypothesis at 6σwhich
is the strongest direct evidence ever achieved by a collider experiment2.
3.1 Extraction of Real and Imaginary part of∆α(s)
By using the definition of the running ofαthe real part of the shift∆α(s) can be expressed in terms
of its imaginary part and|α(s)/α(0)|2:
Re∆α=1−p|α(0)/α(s)|2−(Im∆α)2. (5)
The imaginary part of∆α(s) can be related to the total cross section σ(e+e− → γ∗ → anything),
where the precise relation reads [1, 15, 16]: Im∆α =−α3R(s), withR(s)=σtot/
4π|α(s)|2
3s . R(s) takes
into account leptonic and hadronic contributionR(s) = Rlep(s)+Rhad(s), where the leptonic part
corresponds to the production of a lepton pair at lowest order taking into account mass effects:
Rlep(s)= s
1−4m
2
l s
1+
2m2
l s
, (l=e, µ, τ). (6)
In the energy region around theρ-meson we can approximate the hadronic cross section by the 2π
dominant contribution:
Rhad(s)=
1
4 1−
4m2
π s
!32
|F0π(s)|2, (7)
whereF0
πis the pion form factor deconvolved:|Fπ0(s)|2 =|Fπ(s)|2
α(0)
α(s)
2 .
The results obtained for the 2πcontribution to the imaginary part of∆α(s) by using the KLOE
pion form factor measurement [17], are shown in Fig. 3 and compared with the values given by the
Rhad(s) compilation of Ref. [10] using only the 2πchannel, with the KLOE data removed (to avoid
correlations).
The extraction of the Re∆αhas been performed using the Eq. (5) and it is shown in Fig. 3, right.
The experimental data with only the statistical error included have been compared with thealphaQED
prediction when Re∆α = Re∆αlep(yellow points in the colour Figure) and Re∆α = Re∆αlep+had
(dots with solid line). As can be seen, an excellent agreement for Re∆α(s) has been obtained with the
data-based compilation.
Finally Re∆αhas been fitted by a sum of the leptonic and hadronic contributions, where the
hadronic contribution is parametrized as a sum of theρ(770),ω(782) andφ(1020) resonance
compo-nents and a non-resonant term.
The product of the branching fractions has been extracted [18]:
BR(ω→µ+µ−)BR(ω→e+e−)=(4.3±1.8stat±2.2syst)·10−9, (8)
2The first evidence for the hadronic VP came from the ACO experiment which found an evidence at 3σof theφcontribution
to the processe+e−→µ+µ−
Energy (GeV)
0.6 0.65 0.7 0.75 0.8 0.85 0.9 0.95 1
α ∆ Im 0.03 − 0.025 − 0.02 − 0.015 − 0.01 − 0.005 − 0 Exp data lep α ∆ =Im α ∆
Th.pred. for Im
lep+had α ∆ =Im α ∆
Th.pred. for Im
(GeV) s
0.6 0.65 0.7 0.75 0.8 0.85 0.9 0.95 1
α ∆ Re 0.03 − 0.02 − 0.01 − 0 0.01 0.02 0.03 0.04 0.05 Exp data lep α ∆ =Re α ∆ Th.pred. for Re
lep+had α ∆ =Re α ∆ Th.pred. for Re
Figure 3.Left: Im∆αextracted from the KLOE data compared with the values provided byalphaQEDroutine (without the KLOE data) for Im∆α=Im∆αlep(yellow points) and Im∆α=Im∆αlep+hadonly forππchannels
(blue solid line). Right: Re∆αextracted from the experimental data with only the statistical error included compared with thealphaQEDprediction (without the KLOE data) when Re∆α=Re∆αlep(yellow points) and
Re∆α=Re∆αlep+had(blue solid line).
where the first error is statistical and the second systematic. By multiplying by the phase space factor
ξ=
1+2m
2
µ m2ω
1−4m
2
µ m2ω
1/2
and assuming lepton universality,BR(ω→µ+µ−) can be extracted:
BR(ω→µ+µ−)=(6.6±1.4stat±1.7syst)·10−5 (9)
compared toBR(ω→µ+µ−)=(9.0±3.1)·10−5from PDG [19].
4 Acknoweldgements
I would like to thank the PHIPSI17 local organising committee, particularly A. Denig, for running a smooth and productive meeting in a very friendly atmosphere.
References
[1] F. Jegerlehner, “The anomalous magnetic moment of the muon,” Springer Tracts Mod. Phys.226
(2008) 1.
[2] A. B. Arbuzov, D. Haidt, C. Matteuzzi, M. Paganoni and L. Trentadue, Eur. Phys. J. C34(2004)
267.
[3] G. Abbiendiet al.[OPAL Collaboration], Eur. Phys. J. C 45(2006) 1; M. Acciarri et al.[L3
Collaboration], Phys. Lett. B476(2000) 40; S. Odakaet al.[VENUS Collaboration], Phys. Rev.
Lett.81(1998) 2428; I. Levineet al.[TOPAZ Collaboration], Phys. Rev. Lett.78(1997) 424.
[4] M. Steinhauser, Phys. Lett. B429(1998) 158.
[5] C. Sturm, Nucl.Phys. B874(2013) 698.
[6] A. Galloet al., Conf. Proc. C060626(2006) 604.
[8] M. Adinolfiet al., Nucl. Instrum. Meth. A482(2002) 364.
[9] H. Czy˙z, A. Grzelinska, J. H. Kühn and G. Rodrigo, Eur. Phys. J. C39(2005) 411; H. Czy˙z,
A. Grzelinska, J. H. Kühn and G. Rodrigo, Eur. Phys. J. C33(2004) 333; H. Czy˙z, A. Grzelinska,
J. H. Kühn and G. Rodrigo, Eur. Phys. J. C27(2003) 563; G. Rodrigo, H. Czy˙z, J. H. Kühn and
M. Szopa, Eur. Phys. J. C24(2002) 71; F. Campanario, H. Czy˙z, J. Gluza, M. Gunia, T. Riemann,
G. Rodrigo and V. Yundin, JHEP1402(2014) 114.
[10] F. Jegerlehner, alphaQED package [version April 2012]
http://www-com.physik.hu-berlin.de/~fjeger/alphaQED.tar.gz; see also F. Jegerlehner, Nuovo
Cim. C034S1(2011) 31; Nucl. Phys. Proc. Suppl.162(2006) 22.
[11] F. Jegerlehner, EPJ Web Conf.118(2016) 01016.
[12] J. E. Augustinet al., Phys. Rev. Lett.30(1973) 462.
[13] J. Baileyet al.[CERN Muon Storage Ring Collaboration], Phys. Lett.67B(1977) 225 [Phys.
Lett.68B(1977) 191].
[14] J. Baileyet al.[CERN-Mainz-Daresbury Collaboration], Nucl. Phys. B150(1979) 1.
[15] S. Eidelman and F. Jegerlehner, Z. Phys. C67(1995) 585
[16] F. Jegerlehner and A. Nyffeler, Phys. Rept.477(2009) 1.
[17] D. Babusciet al.[KLOE Collaboration], Phys. Lett. B720(2013) 336.
[18] A. Anastasiet al.[KLOE-2 Collaboration], Phys. Lett. B767(2017) 485.