The Impact of Foreign Direct Investment on Economic Growth,
Employment and Poverty Reduction in Uganda
Ronald K. S. Wakyereza BA-SS (Econ/PS)
Makerere University, Kampala Uganda
Master of Business (International Trade) Victoria University, Melbourne Australia
A thesis submitted in fulfilment of the requirements for the degree of Doctor of Philosophy
College of Business, Finance and Financial Services Discipline Victoria University, Melbourne Australia
Abstract
The overarching objective of this study is to measure the impact of Foreign Direct Investment (FDI) on economic growth, employment and poverty reduction in Uganda. The study begins by providing a brief introduction of Uganda’s economy and FDI inflows including political and governance background. Uganda’s economy is classified as least-developed and highly indebted. The study noted first, that economic growth, employment and poverty are multidimensional. Second, tourism was identified as the single largest foreign exchange earner for Uganda. Further to achieve higher levels of economic growth, employment creation and poverty reduction, the Government of Uganda (GOU) introduced fiscal, monetary and commercial policies that included: openness, human capital development and controlling inflation. Following the reforms, FDI was identified as a foreign capital flow which overcomes the problem of private capital limitation in the country. Considering these observations, this study measures the impact of FDI on Uganda’s economic growth, employment and poverty reduction. This study covers the sample period 1985-2014 employing time-series data.
Empirical findings indicate that FDI contributes to Uganda’s economic growth, employment and poverty reduction. However, though FDI contributes to economic growth, the coefficient is negative. This is partly attributed to Total Factor Productivity (TFP), as explained by the Solow-Swan Model and the absorption capacity of Uganda being a least-developed country. This situation is worrisome for the nation because a further review of the impulse response function indicates that FDI will negatively contribute to economic growth both in the short-run and long-run. Meanwhile, tourism in indicated by the findings as an export that can spur economic growth, employment and poverty reduction in the country. This is because tourism is found to play a significant role in attracting FDI into Uganda as well as being a tool for openness. The study finds tourism as important tool for economic growth, poverty reduction, and employment through spill-over effects and human capital as well as accelerating tourism-induced foreign investments into the country. To this end, tourism plays a pivotal role to Uganda’s economy as mentioned earlier but like FDI as a factor input, the coefficient is negative. However, unlike FDI, though in the short-run impulse response indicates that tourism will negatively contribute to economic growth in the long-run the impact becomes positive but de minimis. As such, it is important that mechanisms be put in place to make Uganda a better tourist destination compared to other countries in the region.
Doctor of Philosophy Declaration
“I, Ronald K.S Wakyereza, declare that the PhD thesis entitled The Impact of Foreign Direct Investment on Economic Growth, Employment and Poverty Reduction in Uganda is no more than 100,000 words in length including quotes and exclusive of tables, figures, appendices, bibliography, references and footnotes. This thesis contains no material that has been submitted previously, in whole or in part, for the award of any other academic degree or diploma. Except where otherwise indicated, this thesis is my own work”.
Dedication
To my Wife, Agatha
Acknowledgements
Firstly I take this opportunity to express my sincere deep gratitude to Ass. Prof. Nada Kulendran my Principal Supervisor. During the time of his supervision my thinking about economic issues changed. This deepened my analytical thinking and focus of this study. I have benefitted greatly from his great insight, knowledge, critics of my work and always demanding that I do better. This made me to work hard and in turn the quality of the thesis improved and enhanced my research skills. His enduring support cannot be paid back. Prof. Nada has been more than a supervisor to me. To Dr. Ranjith Ihalanayake as my co-supervisor, I am sincerely grateful to the academic support and emotional support especially when I was involved in an accident. He stood to his words to support me beginning with the first day of meeting. In addition I extend thanks to Dr. Guneratne Wickremasinghe as second co-supervisor for the contribution, constructive comments and for being interested in my work including the availability extended to me whenever need arose. To both: Ass. Prof. Nada and Dr. Ranjith I am indebted to you. At the time when darkness came with no tuition it illuminated ahead of the tunnel. In this regard, I am sincerely grateful to Prof. Anne-Marie Hede and Victoria University for the tuition waiver for this final semester.
My sincere thanks are extended to Dr. P.J Gunawardana, my first supervisor during proposal writing. Having identified that I did not have enough financial support, at the time of his departure in November 2014 he encouraged me to begin writing this thesis. I took his advice seriously. He set the pace. I extend thanks to Dr. Michelle Fong, my second Supervisor during proposal writing. It is probable that without her I could neither have returned to Victoria University nor continued with Doctoral studies. She made sure that I make my application for doctoral studies. She is a mentor and followed me up. In addition, I take this opportunity to extend sincere thanks to Prof. Ron Adams. The training and mentoring I went through built a strong foundation for thesis writing. Also, I thank Dr. Teresa De Fazio and Dr. Miguel Gil for the special Learning through Teaching Mentoring Program I went through. I had constructive and productive sessions where my research skills were enhanced. They desired that I work harder to achieve the best through my course.
school and university. Leaving in a remote village often money was not available. However, the little money she earned through hardship tried to supplement the efforts of my father. She is passionate and kind.
Finally, most important to my wife Agatha, she has stood with me to build our family. She has sacrificed to make the home stand. To my children (Joshua, Andrew, Timothy and Benjamin): You, your mother and I as a family agreed to utilize our family resources in pursuit of this academic endeavour. In particular, we sold our only family property among others. I thank you for the support. This was the purpose. God bless you and build on what we have today. I further extend thanks to Miss Kezia Nabalayo for taking care-of Andrew who joined us later and Joshua who is still at home in Uganda. Also, thank my brothers Mr. Richard BAK Kumbuga and Mr. Hannington K.T Langa for supporting me. To Makerere University Business School, on behalf of my family and on my own behalf, I take this opportunity the thank you for the Fellowship Offer that has supplemented the family resources. Finally, I thank Elite Editing for editing and formatting this thesis based on Standards D and E of the Australian Standards for Editing Practice.
Table of Contents
Abstract ... ii
Doctor of Philosophy Declaration ... iv
Dedication ... v
Acknowledgements ... vi
List of Figures... xiii
List of Tables ... xvii
List of Abbreviations ... xix
Background, Objectives and Thesis Structure ... 24
1.1 Background ... 24
1.2 The Issue and Definition of the Problem ... 27
1.3 Contribution to Knowledge ... 28
1.3.1 Statement of Significance ... 28
1.3.2 The Knowledge Gap ... 29
1.4 Aims of the Study ... 30
1.5 Data and Methodology ... 31
1.6 Thesis Outline ... 32
Uganda: The Economy and Economic Reforms ... 35
2.1 Introduction ... 35
2.2 Overview of Uganda ... 35
2.3 Uganda’s Economy ... 37
2.4 Uganda Adopts Economic Reforms ... 39
2.4.1 Economic Reforms Phase One: 1979–1985 ... 39
2.4.2 Economic Reforms Phase Two: 1986–2014 ... 40
2.5 Government Expenditure Reforms ... 41
2.6 Inflation Control and Economic Reforms ... 41
2.6.1 Impact of Inflation on Economic Growth, Employment and Poverty in Uganda ... 42
2.6.2 Causes of Inflation in Uganda ... 43
2.7 The Importance of Openness in Uganda’s Economy ... 46
2.7.1 Contribution of Openness to the Current Account ... 47
2.7.2 The Contribution of Openness to Production and Productivity ... 48
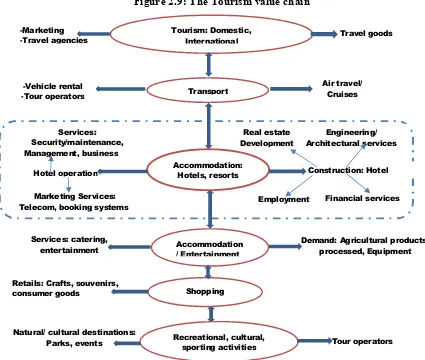
2.8 The Contribution of Tourism to Uganda’s Economy ... 49
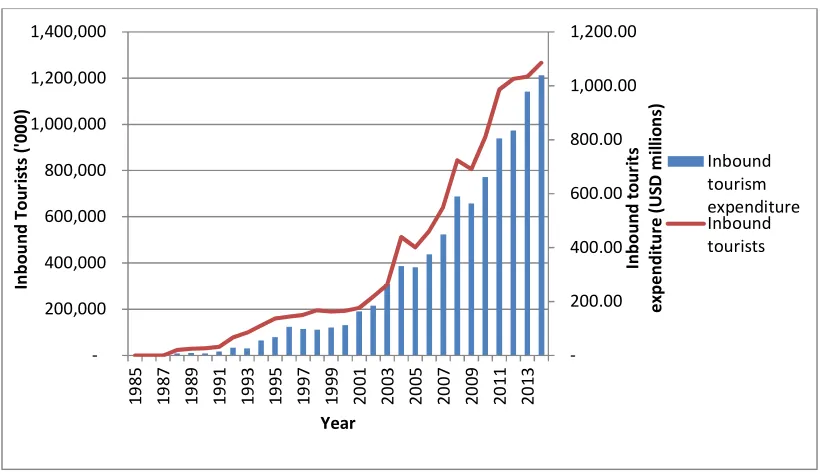
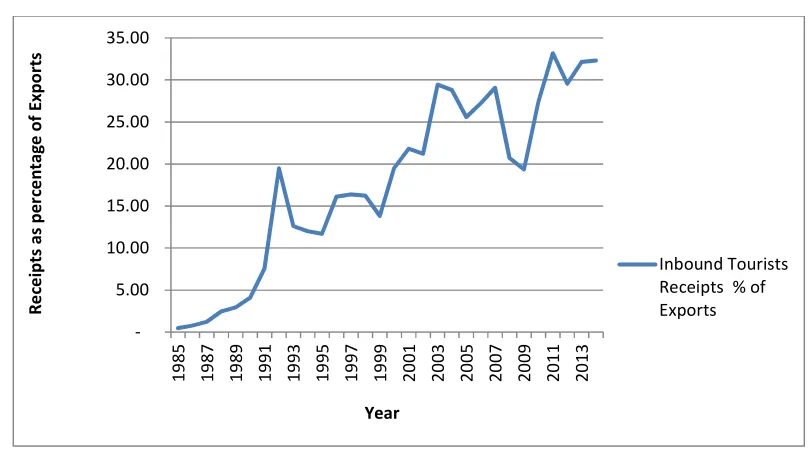
2.8.1 The Contribution of Tourism and Foreign Exchange ... 51
2.8.2 Tourism and Tax Revenue for Government... 53
2.8.3 The Impact of Tourism on Investment in Uganda... 53
2.8.4 The Impact of Tourism on Employment and Poverty Elimination ... 55
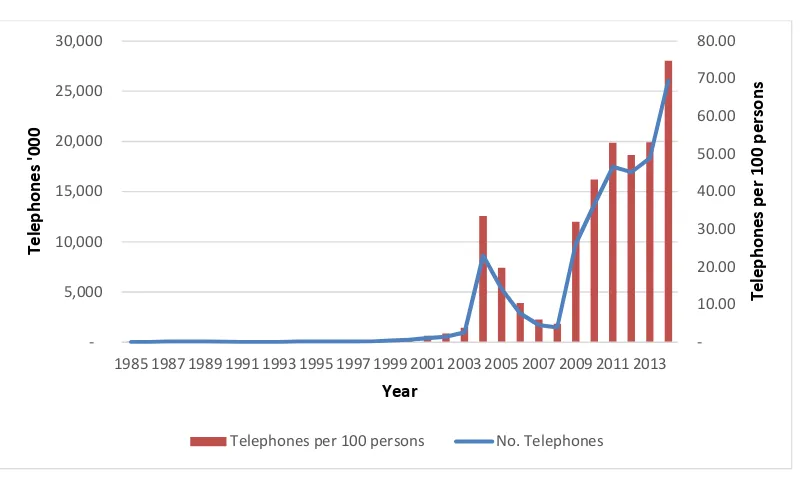
2.9 Telecommunications ... 56
2.10 Economic Growth, Employment and Poverty After the Adoption of Economic Reforms ... 59
2.10.1 Trends in Uganda’s Economic Growth, 1985–2015 ... 59
2.10.2 Employment Trends in Uganda, 1985–2014... 60
2.10.3 Poverty Perspectives in Uganda, 1985–2014 ... 61
FDI and Investment Regulations in Uganda ... 65
3.1 Introduction ... 65
3.2 Background to FDI Inflows into Uganda ... 65
3.3 FDI Inflows into Uganda Before Independence, 1894–1962 ... 66
3.3.1 Foreign Investments: Economic and Establishment of Commercialisation ... 66
3.3.2 FDI and Economic Diversification, 1946–1962... 71
3.4 FDI Inflows After Independence, 1962–2013 ... 74
3.4.1 Nationalisation of Foreign Investments in Uganda, 1962–1979 ... 74
3.4.2 FDI Inflows During Economic Recovery and Reforms, 1979–2014 ... 78
3.5 Investment Regulations in Uganda ... 83
3.5.1 Non-Discrimination ... 85
3.5.2 Transparency ... 87
3.5.3 Dispute-Settlement Mechanism ... 88
3.5.4 Property Rights ... 88
3.5.5 Financial Regulations ... 91
3.5.6 Customs Duties ... 95
3.5.7 Standards and Environment Protection ... 98
3.5.8 Labour , Employment and Corporate Social Responsibility ... 98
3.5.9 Investment Promotion ... 99
3.6 Concluding Remarks ... 99
FDI: Theories and Economic Importance ... 101
4.1 Introduction ... 101
4.2 Definitions ... 101
4.2.1 Portfolio Investment ... 101
4.2.2 Foreign Direct Investment ... 102
4.3 The Origin of FDI Theories ... 102
4.3.1 From International Trade Theories to FDI Theories ... 104
4.3.2 Capital Movements Theory ... 105
4.3.3 The Industrial Organisation Theory ... 105
4.4 Market-Based Theories ... 106
4.4.1 FDI Capital Theory ... 106
4.4.2 Market Size Theory ... 107
4.4.3 FDI Stage Model Theories ... 108
4.4.4 Appropriability Theory ... 115
4.4.5 Internalisation Theory ... 116
4.4.6 The Eclectic Theory ... 118
4.4.7 FDI Development Theories ... 119
4.4.8 Competition Theories ... 123
4.4.9 Other FDI-Imperfect Market-Based Theories ... 124
4.4.10 FDI International Political Economy (IPE)-Based Theories ... 126
4.5 The Economic Importance of FDI ... 131
4.5.1 Foreign Investor Perspective ... 132
4.5.2 The Benign Model of FDI ... 133
4.5.3 The Negative Effects of FDI on a Nation ... 134
4.6 Concluding Remarks ... 137
Modelling Economic Growth, Employment and Poverty ... 139
5.1 Introduction ... 139
5.2 Modelling Economic Growth ... 139
5.2.2 Mankiw, Romer and Weil Model ... 145
5.2.3 New Growth Theory ... 147
5.3 Measuring Economic Growth ... 149
5.4 Modelling Employment in Uganda ... 150
5.4.1 The Harris-Todaro Model ... 150
5.4.2 Labour Force as a Basis for Modelling Uganda’s Employment ... 152
5.4.3 Measuring Employment ... 153
5.5 Modelling Poverty in Uganda ... 154
5.5.1 Defining Poverty ... 154
5.5.2 Measuring Poverty ... 155
5.5.3 Measuring Poverty Based on the Head Count Approach ... 159
5.5.4 The Relationship Between Economic Growth, Employment and Poverty ... 159
5.5.5 Concluding Remarks ... 160
Modelling the Impact of FDI and Other Explanatory Variables on Economic Growth, Employment and Poverty in Uganda ... 163
6.1 Introduction ... 163
6.2 Modelling Openness on Economic Growth, Employment and Poverty Reduction .... 163
6.2.1 Measuring Openness ... 165
6.3 Modelling the Impact of Tourism on Economic Growth, Employment and Poverty Reduction ... 166
6.4 Modelling the Impact of FDI on Economic Growth, Employment and Poverty Reduction ... 168
6.5 Modelling Human Capital on Economic Growth, Employment and Poverty ... 172
6.6 Modelling the Impact of Telecommunications on Economic Growth, Employment and Poverty ... 172
6.6.1 The Impact of Telecommunications on Productivity ... 173
6.6.2 The Impact of Telecommunications on Entrepreneurial Development and Employment ... 174
6.6.3 The Impact of Telecommunications on Welfare and Poverty Reduction ... 175
6.7 Modelling Government Expenditure on Economic Growth, Employment and Poverty ... 177
6.8 Modelling Inflation on Economic Growth, Employment and Poverty ... 180
6.8.1 The Neoclassical Theory and the Impact of Inflation on Economic Growth, Employment and Poverty ... 181
6.8.2 Measuring Inflation ... 183
6.9 Rebellion as Proxy for Political Instability ... 184
6.10 Empirical Findings on the Impact of FDI on Economic Growth, Employment and Poverty ... 185
6.10.1 Empirical Findings on the Impact FDI on Economic Growth ... 185
6.10.2 Empirical Findings on the Impact of FDI on Employment ... 186
6.10.3 The Impact of FDI on Poverty ... 187
6.11 Concluding Remarks ... 188
Theoretical Framework and Empirical Analysis ... 190
7.1 Introduction ... 190
7.2 Description of the Variables ... 190
7.2.1 The Scope and Sources of data... 191
7.2.2 Variable Definitions and Measurement ... 191
7.4 Procedure for Measuring the Impact of FDI and Other Explanatory Variables on
Economic Growth, Employment and Poverty Reduction in Uganda ... 194
7.4.1 Investigation of Time Series Properties of the Variables ... 195
7.4.2 Long and Short-Run Estimation ... 202
7.4.3 Simultaneous Equation Specification ... 206
7.4.4 Simultaneous Equation Estimation Under a VAR Approach ... 208
7.4.5 VECM Systems Long-Run and Short-Run Analysis ... 214
7.4.6 Simultaneous Equation Estimation ... 217
7.4.7 Specifications of Testable Hypotheses ... 219
7.4.8 Validation of the Estimated Simultaneous Equations ... 219
7.5 Ex-Post Forecasting ... 221
7.6 Concluding Remarks ... 221
Time-Series Properties and Investigation of the Variables ... 223
8.1 Introduction ... 223
8.2 Preliminary Variables Relationship Investigation ... 223
8.2.1 The Relationship Between GDP, FDI and Tourism ... 223
8.2.2 The Relationship Between GDPGR, GDP and Factor Inputs Growth ... 224
8.2.3 The Relationship Between Employment, Human Capital and Economic Growth in Uganda ... 226
8.3 Correlation Analysis ... 228
8.4 Series Trend Analysis ... 228
8.5 Time-Series Unit Root Testing ... 229
8.5.1 Augmented Dickey-Fuller Unit Root Tests ... 230
8.5.2 The Phillips–Perron Unit Root Test ... 231
8.5.3 The Kwiatkowski-Phillips-Schmidt-Shin (KPSS) Unit Root Test ... 231
8.6 Endogeneity Analysis ... 232
8.7 Concluding Remarks ... 234
Estimation of the Short and Long-Run Relationships Among the Endogenous Variables ... 236
9.1 Introduction ... 236
9.2 Series Cointegration Analysis ... 236
9.2.1 Cointegration Test Results ... 237
9.2.2 Long-Run Relationships Among Cointegrating Variables ... 238
9.3 Simultaneous Equation Model Specification ... 240
9.4 Simultaneous Equation Estimation Employing VAR ... 241
9.4.1 Results of the Simultaneous Equation Estimated by VAR ... 242
9.4.2 Simultaneous Equation Short-Run Simulation and Analysis... 249
9.5 VECM Systems Ex-Ante Forecasting ... 250
9.5.1 Simultaneous Equation Long-Run Analysis ... 250
9.5.2 Impulse Response ... 250
9.5.3 Variance Decomposition ... 257
9.6 Concluding Remarks ... 261
Estimation of the Impact of Explanatory Variables on Economic Growth, Employment and Poverty in Uganda ... 263
10.1 Introduction ... 263
10.2 Causality Testing Among Variables ... 263
10.2.1 VECM Granger Causality for Endogenous Variables and Human Capital ... 264
10.3 Simultaneous Equation Estimation to Measure the Impact of FDI and Explanatory Variables on Economic Growth, Employment and Poverty in
Uganda ... 266
10.3.1 Results of the Systems Equation Estimated by OLS ... 267
10.4 Estimation, Analysis and Interpretation of the Simultaneous Equations ... 269
10.4.1 Economic Growth Systems Equation Analysis and Interpretation ... 269
10.4.2 Employment Systems Equation Analysis and Interpretation ... 275
10.4.3 Poverty in Uganda Systems Equation Estimation, Analysis and Interpretation ... 280
10.4.4 FDI Systems Equations Estimation, Analysis and Interpretation ... 285
10.4.5 Tourism Systems Equation Estimation, Analysis and Interpretation ... 291
10.5 Economic Growth, Employment and Poverty Reduction in Uganda Ex-Post Analysis ... 295
10.6 Concluding Remarks ... 298
Conclusions, Implications and Future Research ... 303
11.1 Introduction ... 303
11.2 Overview of the Study ... 304
11.2.1 Uganda’s Economy and Economic Reforms ... 304
11.2.2 FDI Inflows and Investment Regulations in Uganda ... 306
11.2.3 FDI Theories and Economic Importance ... 308
11.2.4 Modelling Economic Growth, Employment and Poverty ... 309
11.2.5 Major Findings from Modelling the Impact of FDI and Other Explanatory Variables on Economic Growth, Employment and Poverty in Uganda ... 310
11.3 Hypotheses Tests Major Findings ... 311
11.3.1 Major Findings Arising from the Series Properties Investigation of the Variables ... 313
11.3.2 Major Findings Arising from the Estimation Short-Run and Long-Run Relationship Among Endogenous Variables ... 315
11.3.3 Major Findings on the Impact of FDI and Other Explanatory Variables on Economic Growth, Employment and Poverty Reduction in Uganda ... 317
11.4 Contribution of the Thesis ... 320
11.4.1 Theoretical and Empirical Contributions ... 320
11.4.2 Methodological Contributions ... 322
11.5 Policy Implications ... 322
11.6 Policy Recommendations... 325
11.7 Limitations of the Study ... 327
11.8 Recommendations for Future Studies ... 329
11.9 Conclusions ... 330
References... 335
List of Figures
Figure 1.1 Global FDI inflows 1988–2014 (USD billions) ... 24
Figure 2.1 Map of Uganda ... 35
Figure 2.2: Uganda’s political, governance and economic spectrum, 1882–1994 ... 36
Figure 2.3: Selected economic indicators, 1960–2014 ... 38
Figure 2.4: Total government sectoral consumption and percentage distribution per sector, 1985–2014 ... 41
Figure 2.5: Trends in Uganda’s CPI 1985–2014 ... 42
Figure 2.6: The relationship between annual growth and inflation in Uganda ... 45
Figure 2.7: Uganda’s international trade trends, 1985–2014 ... 48
Figure 2.8: The changing structure of Uganda’s export sector ... 49
Figure 2.9: Tourism value chain ... 50
Figure 2.10: The growth of tourism in Uganda, 1985–2014 ... 51
Figure 2.11: Tourism expenditure as a percentage contribution to exports ... 52
Figure 2.12: Forward and backward linkages in the tourism sector ... 54
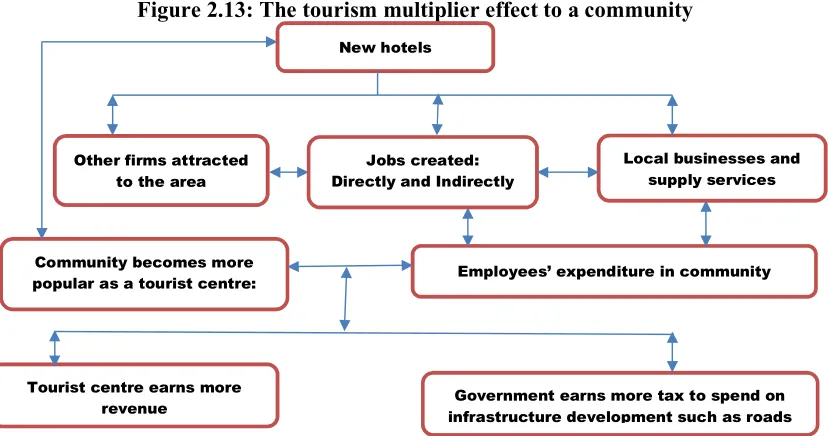
Figure 2.13: The tourism multiplier effect to a community ... 54
Figure 2.14: The growth of telecommunications ... 56
Figure 2.15: Economic use of telecommunications in production, trade and marketing ... 57
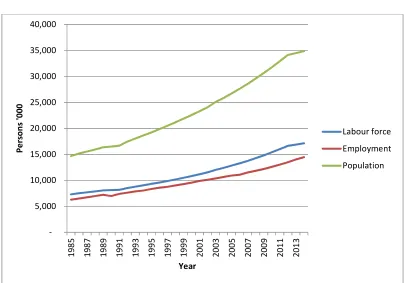
Figure 2.16: Trends in LF and employment, 1985–2014 ... 60
Figure 2.17: Growth of human capital in Uganda, 1985–2014 ... 62
Figure 2.18: Trends in poverty reduction and GDP percapita ... 63
Figure 3.1: The flow of foreign investments in the trade and services sector during colonialism ... 70
Figure 3.2: Trends in foreign investment inflows into Uganda, 1985–2014 ... 80
Figure 3.3: Trends in some employment indicators in Uganda ... 80
Figure 3.4: Regional percentage share of FDI projects established in Uganda 1991-2013 .... 81
Figure 3.5: Distribution of FDI in Uganda, 2013 ... 82
Figure 3.6: Sectoral distribution of projects, 1991–2014 ... 83
Figure 3.7: Summary of FDI regulations ... 84
Figure 3.8: FDI regulatory and operation framework in Uganda ... 84
Figure 3.9: The relationship between national, regional and international regulations ... 85
Figure 3.11: The relationship between business entry, growth and exit ... 93
Figure 3.12: Structure of Ugandan tax regulations ... 94
Figure 4.1: Main elements of the exploration process ... 103
Figure 4.2: PLC ... 109
Figure 4.3: The FDI PLC Theory ... 110
Figure 4.4: Sequential internationalisation process ... 112
Figure 4.5: Uppsala Model internationalisation mechanism ... 113
Figure 4.6: Risk model illustration of a firm’s internationalisation process ... 114
Figure 4.7: Internationalisation and entry modes relationship ... 115
Figure 4.8: Project and technology life cycle: Production and trade relationship ... 115
Figure 4.9: The relationship between stages of economic development and FDI ... 121
Figure 4.10: Process leading to the growth of FDI and GVCs ... 132
Figure 4.11: The VCP ... 133
Figure 4.12: MNEs operation spectrum to invest abroad ... 137
Figure 5.1: The production function: Output-per-worker ... 142
Figure 5.2: Relationship between output, consumption and investment ... 143
Figure 5.3: Steady state growth of national economy ... 145
Figure 5.4: Links between democracy, economic level, FDI, and human capital ... 148
Figure 5.5: Harris-Todaro employment model ... 152
Figure 5.6: Summary model of employment in Uganda ... 152
Figure 5.7: Relationship between economic growth, LFP and poverty reduction ... 153
Figure 5.8: The employment–LF ratio ... 154
Figure 5.9: Relationship between growth, employment and poverty reduction ... 160
Figure 6.1: Comparative advantage: Gains from trade and investment ... 164
Figure 6.2: Trends in Uganda’s openness index, FDI flows and tourism ... 165
Figure 6.3: The tourism system: The Leiper Model ... 166
Figure 6.4: Modelling the impact of tourism on economic growth, employment and poverty167 Figure 6.5: Comparative advantage: Gains from trade and investment ... 173
Figure 6.6: Laffer curve tax revenue ... 178
Figure 6.7: Armey Curve ... 179
Figure 6.8: Demonstration of the relationship between GE, seigniorage, tax and inflation on a least-developed nation ... 182
Figure 6.10: Armed rebellion, economic growth, employment and poverty ... 185
Figure 7.1: Variables conceptual framework ... 194
Figure 7.2: Procedure for data analysis and interpretations ... 195
Figure 8.1: The trend of GDP, log GDP, FDI and toursim ... 224
Figure 8.2: Trend in GDPGR, economic growth, FDI and tourism expenditure ... 225
Figure 8.3: Growth of employment and human capital in relation to economic growth ... 227
Figure 8.4: Series trend analysis ... 229
Figure 8.5: Results of the series trend test after first difference ... 232
Figure 9.1: Roots companion matrix distribution ... 243
Figure 9.3: Endogenous variables residual graphs ... 247
Figure 10.1: Residual of the VECM systems simultaneous equation estimated by the OLS 267 Figure 10.2: Residual stability test ... 270
Figure 10.3: Results of the correlogram Q-Statistics ... 271
Figure 10.4: Normality test ... 272
Figure 10.5: Employment equation residual stability tests ... 276
Figure 10.6: Q-Statistics test results ... 277
Figure 10.7: Employment equation test for normality test ... 278
Figure 10.8: Residual stability tests results ... 281
Figure 10.9: Q-Statistics test for serial correlation ... 282
Figure 10.10: Test results for normality ... 283
Figure 10.11: Residual stability tests results ... 286
Figure 10.12: Q-Statistcis test for serial correlation ... 287
Figure 10.13: Test results for normality ... 288
Figure 10.14: Tourism systems equation stability tests ... 292
Figure 10.15: Correlogram Q-Statistics test results ... 293
Figure 10.16: Test results for normality ... 294
Figure 10.17: Equations ex-post forecast fitted graphs ... 296
Figure 10.18: Endogenous variables ex-post forecast in Uganda, 1985–2014 ... 297
Figure 10.19: Role of tourism, FDI, openness and human capital on economic growth, employment and poverty reduction in Uganda ... 299
Figure 10.20: Summary causality among variables ... 302
Figure 11.1: The role of openness to Uganda’s economy since the reforms ... 304
Figure 11.3: Summary of findings of the causality pairwise simulations ... 314 Figure 11.4: Summary of relationship among variables based on Short-run test ... 315 Figure 11.5: Demonstration of trends in Uganda’s politics, economy, FDI and investment
climate ... 320 Figure 11.6: Demonstration of the Frog-leap Theory of FDI inflows into Uganda ... 321 Figure 11.7: Recommended CCACD for accelerated economic growth, employment and
poverty reduction ... 325 Figure 11.8: The schematic summary of the impact FDI and other explanatory variables on
List of Tables
Table 2.1: Systems of governance in Uganda, 1962 until today ... 36
Table 2.2: Income tax assessment, 1963 ... 61
Table 3.1: Establishment of banks in Uganda, 1906–1962 ... 71
Table 8.1: Variable correlation analysis ... 228
Table 8.2: ADF unit root tests ... 230
Table 8.3: Summary of the PP and KPSS unit root test statistics results ... 231
Table 8.4: Summary of the pairwise causality tests ... 233
Table 9.1: VAR lag order selection criteria ... 237
Table 9.2: Summary of the Johansen Cointegration test output ... 237
Table 9.3: Summary results of the long-run simulation ... 238
Table 9.4: Summary display of VECM systems model ... 241
Table 9.5: VEC residual portmanteau tests for autocorrelations ... 245
Table 9.6: Residual serial correlation LM tests ... 245
Table 9.7: Residual normality tests ... 246
Table 9.8: Results of the VAR estimated simultaneous equation ... 248
Table 9.9: Variables diagnostic F-/Wald tests and short-run test ... 249
Table 9.10: Impulse response analysis ... 253
Table 9.11: Variance decomposition ... 258
Table 10.1: Endogenous variables and human capital VECM Granger causality ... 264
Table 10.2: Results of VECM Granger causality tests of endogenous variables and openness265 Table 10.3: Results of the residual unit roots tests for simultaneous equation ... 268
Table 10.4: Summary display systems equation ... 268
Table 10.5: Economic growth equation summary results ... 269
Table 10.6: Economic growth equation Breusch-Godfrey Serial correlation LM Test ... 271
Table 10.7: Economic growth equation tests for heteroscedasticity ... 272
Table 10.8: Employment equation summary results ... 275
Table 10.9: Economic growth equation Breusch-Godfrey serial correlation LM Test ... 277
Table 10.10: Economic growth equation tests for heteroscedasticity ... 278
Table 10.11: Poverty reduction equation summary results ... 280
Table 10.12: Breusch-Godfrey serial correlation LM Test ... 282
Table 10.14: FDI equation summary results ... 285
Table 10.15: FDI equation Breusch-Godfrey serial correlation LM Test ... 287
Table 10.16: FDI equation tests for heteroscedasticity ... 288
Table 10.17: Tourism equation summary results... 291
Table 10.18: Tourism equation Breusch-Godfrey serial correlation LM Test ... 293
List of Abbreviations
2SLS: Two-Stage Least Square ADB Africa Development Bank ADF: Augmented Dickey-Fuller
ADLM: Autoregressive Distributed Lag Model ADR: Alternative Dispute Resolution
AIC: Akaike Information Criterion ANC Africa National Congress
ARCH: Autoregressive Conditional Heteroscedasticity ASEAN: Association of South East Asian Nations ASSM: Augmented Solow-Swan Model
BITs: Bilateral Investment Treaties BOU: Bank of Uganda
CCACD: Community Capital Absorption Capacity Development CCS: Capacity Community Support
CET: Common External Tariff CMC: Common Man’s Charter CMS: Church Missionary Society
COMESA: Common Market of East and Southern Africa CPI Consumer Price Index
CRS: Corporate Social Responsibility CUSUM: Cumulative Sum Control Chart
DAPCB Departed Asians Property Custodian Board PCB: Properties Custodian Board
DTA: Double Taxation Agreement DTL Domestic Tax Laws
DW: Durbin-Watson
EAC: East African Community
EAC-DTA: East African Community Double Taxation Agreement EACMA: East African Customs Management Act
EU: European Union
EWD Economic War Declaration FDI: Foreign Direct Investment FGT: Foster-Greer-Thorbeke FHHIPE: Firm-Home-Host-IPE
FIPA: Foreign Investment (Protection) Act FPE: Final Prediction Error
FTA: Free Trade Area
GATS: Trade in Services Agreement
GATT: General Agreement on Trade and Tariffs GDP: Gross Domestic Product
GDPGR: Gross Domestic Product Growth Rate GE: Government Expenditure
GNDI: Gross National Disposable Income GOU: Government of Uganda
GVC: Global Value Chain HCA: Head Count Approach HDM Harrod-Domer Model
HIPC Highly Indebted Poor Country H-O: Hecksher-Ohlin
HQ: Hannan-Quinn
IBEAC: Imperial British East Africa Company
ICSID: International Centre for the Settlement of Investment Disputes ICT: Information Communication Technology
ILO: International Labour Organization IMF: International Monetary Fund IOT: Industrial Organisation Theory IPE: International Political Economy IPI: International Portfolio Investment ISS: Import Substitution Strategy IV: Instrument Variable
JB: Jarque-Bera
JML Johansen Maximum Likelihood
KSW Kakira Sugar Works
KY Kabaka Yeka
LF: Labour Force
LFP: Labour Force Participation LFPR: Labour Force Participation Rate LI: Laspeyres Price Index
LM: Langrange Multiplier
LR: Likelihood Ratio
MCPs: Micro Community Projects MFN: Most Favoured Nation
MFPED: Ministry of Finance Planning and Economic Development MFS: Money Financial Services
MGLSD: Ministry of Gender, Labour and Social Development MIGA: Multilateral Investment Guarantee Agency
MMA: Mobile Money Agent MMOs: Mobile Money Operators MNE: Multi-National Enterprise
MP Money Payment
MPK: Marginal Product of Capital MRW: Mankiw, Romer and Weil
MTWA: Ministry of Tourism, Wildlife and Antiquities
MV Money Velocity
NGT: New Growth Theory
NLLS/ARMA: Non-Linear Least Square/Autoregressive Moving Average NOs: Network Operators
NRM: National Resistance Movement NT: National Treatment
NTEs: Non-Traditional Exports
NWSC National Water and Sewerage Corporation
OECD: Organization of Economic Cooperation and Development OLS: Ordinary Least Square
OSC: One-Stop-Centre PAYE: Pay as You Earn
PGA: Poverty Gap Approach PGI: Poverty Gap Index
PIT: Portfolio Investment Theory PLC: Product Life Cycle
PP: Phillips-Perron
PSIS: Private-Sector Investment Surveys RMSE: Root Mean-Square Error
RSE: Rural Sector Employment RTA: Regional Trade Agreement
SADC: South Africa Development Community SAGE: Social Assistance Grants for Empowerment SAP Structural Adjustment Program
SCOUL Sugar Corporation of Uganda Limited SIC: Schwarz Information Criterion SMEs: Small and Medium Enterprises SOE: State Owned Enterprise SQP: Squared Poverty Gap TEs: Traditional Exports TFP: Total Factor Productivity TOT: Terms of Trade
UBOS: Uganda Bureau of Statistics UCB: Uganda Commercial Bank UCSB: Uganda Credit and Savings Bank
UCTAD: United Nations Conference on Trade and Development UDC: Uganda Development Corporation
UEPB: Uganda Export Promotion Board UIA: Uganda Investment Authority UK: United Kingdom
UNBS: Uganda National Bureau of Standards UNCTAD: United Nations on Trade and Development UNLA Uganda National Liberation Army
UPE: Universal Primary Education UR: Uganda Railway
URA: Uganda Revenue Authority
URSB: Uganda Registration Services Bureau US: United States
USA: United States of America USD: United States Dollars USE: Urban Sector Employment
USSE: Universal Secondary School Education UTB: Uganda Tourist Board
UWA: Uganda Wildlife Authority
UWIR UNCTAD World Investment Reports VAR: Vector Autoregressive
VAT: Value Added Tax
VCP: Vicious Circle of Poverty
VECM: Vector Error Correction Mechanism WDI World Bank Development Indicators WDP: Worthington Development Plan WHT: Withholding Tax
WIPO: World Intellectual Property Organization WOEs: Wholly Owned Enterprises
Background, Objectives and Thesis Structure
1.1
Background
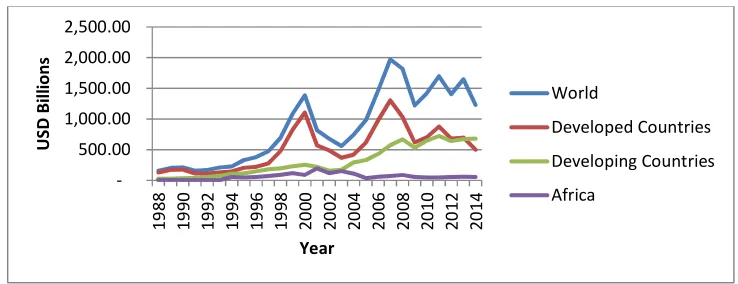
Economic growth, employment and poverty reduction are key concerns for nations across the globe. The need to increase economic growth and create jobs as a means of reducing poverty is even more crucial for developing countries. For developing countries, poverty deprives communities of basic human needs such as food, shelter and clothing. Governments are constantly devising ways of reducing poverty in their countries, such as through increasing domestic revenue and donor support. However, least developed countries such as Uganda are locked in a double constraint. First, they have low domestic revenue and donor financial support for infrastructure and social service delivery. Second, they have low private-sector capital and investment capacity due to poverty. In this respect, foreign direct investment (FDI) becomes an important source of private finance (Chea 2011; Sy & Rakotondrazaka 2015; UNCTAD 2015). Arising from the role FDI plays in host nations, global FDI inflows increased from United States Dollars (USD) 158 billion in 1988 to USD 1,228 billion in 2014, as indicated in Figure 1.1.
Figure 1.1 Global FDI inflows 1988–2014 (USD billions)
Source: UNCTAD: World Investment Reports (UWIR) 1988-2014
Figure 1.1 indicates that though FDI inflows have concentrated in developed countries, the importance of FDI inflows to developing countries as private capital is undeniable. FDI inflows1 into developed countries increased from USD 129 billion in 1988 to USD 499
billion in 2014. During the same period, FDI inflows into developing countries rose from USD 30 billion to USD 681 billion in 2014. Regarding Africa, FDI increased from USD 4.80 billion to USD 54 billion during the period 1988-2014. Also, FDI inflows are increasing in developing countries but decreasing to some degree in developed countries.
To attract FDI, developing countries have established pro-investment policies that help firms to open subsidiaries in all parts of the world with relative ease. In this regard, policy makers in developing countries such as Uganda attract FDI to accelerate economic growth, job creation and poverty reduction. This is based on the premise that FDI is a way of obtaining capital and technology that is not available in the host country (Olusanya 2013).
Efforts to transform Uganda’s economy can be traced to 1900, during the colonial times. The British Government provided grants that were used to transform the country from an agrarian society. After Independence in 1962, economic transformation became the responsibility of the Government of Uganda (GOU). To improve the living standards of Ugandans, the GOU embarked on economic reforms to attract FDI to enhance economic growth, increase employment and reduce poverty. Efforts to attract FDI to Uganda began soon after Independence, through the enactment of the Foreign Investment (Protection) Act (FIPA) of 1964. These policies culminated into the signing of the Uganda–India Trade Agreement, which allowed Indians to establish business enterprises in Uganda. World Bank development indicators revealed that Gross Domestic Product Growth Rate (GDPGR) increased from 4.1% per annum in 1962 to 7.79% per annum in 1970. Meanwhile, Gross Domestic Product (GDP) per capita increased from USD 62.02 to USD 133.40 during the same period.
Despite Uganda’s increasing FDI inflow since the reforms in early 1980s, there have been few studies on the impact of FDI on economic growth, employment and poverty reduction. In the global context, most studies have concentrated on providing evidence of the determinants and contribution of FDI on economic growth in countries such as Uganda, Nigeria and in the countries of the Association of South East Asian Nations (ASEAN). The first of these kind of studies on Uganda were by Obwona (1996, 1998, 2001), and were on FDI determinants and the impact on Uganda’s economic growth. In all studies, the focus was on the period 1981– 1995, and used mixed methods. All of these studies indicated a positive relationship between FDI and economic growth. However, they contain flaws in the measurements used, and the period of focus should be updated. Other studies—such as those by Riddervold (2011), the Ministry of Finance Planning and Economic Development (MFPED) and annual Private-Sector Investment Surveys (PSIS)—concentrate largely on trends of FDI inflows and general issues of investment in Uganda. Even in studies of developed and developing countries in the ASEAN region and Latin America—that are more proportionately represented in the empirical research—pay little attention to the subject of this study. Few studies have explored the impact of FDI on economic growth, employment and poverty in Uganda.
adopted an OLS approach for model estimation, similar to Obwona’s first study (1996). Kiiza’s study (2007) also suffers similar problems to Obwona’s studies (1996, 1998, 2001).
1.2
The Issue and Definition of the Problem
Although Uganda’s FDI inflows have significantly increased since 1985, some observations are worth mentioning. First, FDI has positive effects on the host economy by accelerating economic growth, generating employment and reducing poverty in the long-run. However, in 2010, out of a total population of 33 million, the insecure non-poor2 were about 13 million,
representing 40% of the total population (MFPED 2012 ). Second, empirical findings suggest contrasting findings about the contribution of FDI to host economies, especially in developing countries. The main reasons for contrasting results include total factor productivity, explained by the Solow-Swan Model and other factors explained by the Malign Model, such as the absorptive capacity of the host nation, crowding out local firms and capital flight, especially in regard to market-seeking FDI. Whereas countries expect a positive contribution to their economies, in some instances a negative relationship has been noted. For example, Attari, Kamal and Attaria (2011) found a causal link between FDI and economic growth in the Pakistani economy, as did Athukorala (2003) on the impact of FDI on Sri Lanka’s economic growth. Conversely, Mucuk and Demirsel’s (2013) study on the effects of FDI on employment in seven developing countries revealed contrasting results. FDI increased unemployment in Turkey and Argentina but reduced it in Thailand. Further, FDI was positively related to employment in the long-run but not in the short-run. As previously indicated, knowledge on the impact of FDI on economic growth, employment and poverty in Uganda is limited, so the key question that this study answers is: what is the impact of FDI on economic growth, employment and poverty in Uganda?
Previous studies (Obwona 1996, 1998, 2001; Kiiza 2007) focused on the determinants of FDI and its effects on economic growth in Uganda. As admitted by Obwona (1998, 2001), these studies contain measurement inadequacies, and Kiiza’s (2007) has similar errors. Additionally, no econometric study has been conducted specifically on Uganda in regard to the impact of FDI on economic growth since 2007. Therefore, this study used the latest econometric methodology to measure the impact of FDI on economic growth in Uganda.
Uganda’s population is comprised of 60% youths3. Annually there are about 700,000 new
entrants from higher institutions into the labour market, while net job creation is only 10% (MFPED 2013). Unemployment among school leavers is about 90%. It would be expected that FDI projects would have created a significant number of jobs for job seekers, especially youths, who graduated from higher institutions of learning, yet there is no evidence from MFPED to indicate that the 10% of jobs created in Uganda are due to FDI projects. In Uganda it is often assumed that as economic growth occurs automatically due to FDI, job creation and poverty reduction accrues from FDI-related projects. Two specific questions arose that require answers: 1) To what degree has FDI contributed to employment in Uganda? 2) To what extent has FDI led to poverty reduction in Uganda? These questions created the need for this a country-specific study that establishes the impact of FDI on economic growth, employment and poverty reduction in Uganda.
1.3
Contribution to Knowledge
First, this study increases knowledge of the impact of FDI on economic growth, employment and poverty in Uganda, a developing country. Second, no econometric study has examined the role of FDI in Uganda since 2007. Therefore, this research as pioneer creates a new quantitative record of FDI and its contribution to Uganda’s economy since 2007 (although this study covers the period 1981–2013). Third, this study adds to knowledge and theory by bringing four variables together into one conceptual framework: FDI (and its impact), economic growth, employment and poverty. Finally, the previously mentioned studies adopted a linear regression model specification approach. As a departure from the previous studies, this study adopts the latest econometric methodology, such as: employing Vector Autoregressive (VAR) through Vector Error Correction Mechanism (VECM) procedure, using new variables and developing a multi-equation system model specification approach.
1.3.1Statement of Significance
Developed countries, such as Britain, and newly industrialised countries like Hong Kong, Singapore, Korea, Taiwan and Botswana, are often considered to have succeeded in attaining high levels of economic growth by attracting FDI. These countries experienced a rapid rate of growth through FDI, and Uganda needs to achieve higher levels of economic growth and employment generation in order to reduce poverty and to progress from a least-developed,
highly indebted poor country to a middle-income country. The findings of this research will be of significance to policy makers, investors, communities and academics in Uganda. Policy makers in the MFPED and the National Planning Authority in particular will find the policy implications of this thesis useful in formulating policies for both domestic and foreign investors. If FDI has a positive impact on economic growth, employment and poverty reduction, policy makers should be encouraged to develop relevant and effective policies to attract FDI into strategic industries that benefit communities and help the unemployed find jobs. Through this study, effective pro-investment policies will enable Uganda to become a more favourable destination for FDI and accelerate economic growth, employment and poverty reduction in Uganda.
The policies will benefit both foreign and local investors, as well as communities. Local investors will benefit through entrepreneurial development arising from FDI spill-over effects such as technology transfer, new skills and know-how, which will facilitate the establishment of new projects. The unemployed, especially youths, will either find jobs in FDI-related projects or in projects established by local entrepreneurs, thus accelerating economic growth and alleviating the unemployment crisis that Uganda faces. In the long-run, income and welfare will increase, thus enabling communities—especially the rural and urban poor—to move out of poverty. Finally, this research will add to knowledge through its empirical quantitative perspective that focuses on four variables: FDI and its impact on economic growth, employment and poverty in Uganda.
1.3.2The Knowledge Gap
FDI as a source of physical capital is an important tool for investment and production, and spurs a nation’s economic growth, thus leading to employment generation and poverty reduction. FDI would be the main source of capital for developing countries, including Uganda, which are without well-developed capital markets. For GDP to increase, investments have to increase, especially in the manufacturing sector and agriculture, which is the backbone of developing countries. As FDI inflows increase in a nation, GDP, market size and consumption increase, as does employment and poverty reduction in the long-run.
policies that create an environment favourable to investment, Uganda has successfully become a leading favourable FDI destination in East Africa.
Nevertheless, there is little or no knowledge about the impact of FDI on economic growth, employment and poverty, especially in Uganda. Therefore, this research arose because of a gap in empirical work on the extent and impact of FDI on economic growth, employment and poverty in Uganda. For decades, FDI has been recognised as a tool for economic growth, employment and poverty reduction. Considering the reforms and accelerated FDI inflow increases, the milestones achieved could have had large effects upon economic growth, employment and poverty in Uganda. Even if Uganda was a prosperous nation, a study would be necessary to establish the impact of FDI on economic growth, employment and poverty. Currently, based on PSIS surveys and a few previous studies that concentrated on a causal relationship between FDI and economic growth, it is assumed that foreign investment is positively related to the economy, as well as employment and poverty. Therefore, as the impact of FDI on economic growth, employment and poverty is often assumed to be positively related, with no empirical justification, there is a need to test the hypothesis with this study’s key questions:
What is the impact of FDI on economic growth in Uganda?
To what degree has FDI contributed to employment in Uganda?
To what extent has FDI led to poverty reduction in Uganda?
1.4
Aims of the Study
The main aim of this research is to investigate the impact of FDI on economic growth, employment and poverty in Uganda. The related specific aims are:
to examine the impact of FDI on Uganda’s economic growth;
to assess the degree to which FDI has contributed to employment in Uganda; and
to examine the extent to which FDI has led to poverty reduction in Uganda.
The general testable hypotheses are:
FDI inflows positively and significantly affect Uganda’s economic growth.
FDI inflows positively and significantly contribute to the reduction of poverty in Uganda.
1.5
Data and Methodology
This study employs Uganda’s annual time series on each of the variables: economic growth, employment, poverty, tourism, FDI, inflation openness and human capital. This study covers the period 1985–2014, and the main data sources were the World Bank Development Indicators (WDI) Database and the Uganda Bureau of Statistics (UBOS). Other data sources included the United Nations on Trade and Development (UNCTAD) database, UNCTAD World Investment Reports (UWIR), IMF, Bank of Uganda and UIA.
adopting the Gauss-Newton/Marquardt steps method. Each equation has been validated by testing for stability, serial correlation, heteroscedasticity and normality.
1.6
Thesis Outline
This thesis is comprised of 11 chapters. Chapter Two presents an overview of Uganda’s political, governmental and economic history. It examines the transition of the country’s economy since Independence, in terms of broad economic indicators and its composition. The chapter provides an account of the country’s economy since the adoption of economic reforms in early 1980s, outlining trends in the growth of Uganda’s socioeconomic indicators. Following the economic reforms, the country started to experience accelerated economic growth, employment and poverty because the GOU introduced fiscal and commercial policies, such as controlling government expenditure (GE), inflation and adopting openness as a policy to stimulate international trade and investment. Following these initiatives tourism has become the single largest foreign exchange-earning commodity as an export for Uganda.
Chapter Three discusses FDI inflows into Uganda by first indicating the historical background of foreign investments into the country, and examining FDI nationalisation and FDI performance after the reforms, as well as the regulatory framework that provides a pro-investment environment. Second, the chapter provides an account of FDI inflows since the reforms, and explains the regulatory framework. Before the reforms, the chapter explains that FDI inflows became negative due to the political and economic instability exacerbated by international sanctions between 1972 and 1979. Regarding the regulatory framework, the chapter explains that Uganda is signatory to a number of international, regional and bilateral agreements, such as the World Trade Organization (WTO).
Chapter Five is concerned with modelling economic growth, employment and poverty. The chapter begins be explaining the background to economic growth, focusing on the Solow-Swan Model, Mankiw, Romer and Weil (MRW) model and the New Growth Theory (NGT). The chapter explains that considering these theories, the Augmented Solow-Swan Model (ASSM) is a better theory for explaining economic growth, employment and poverty. This is because by augmenting the original Solow-Swan Model, the MRW Model and the NGT are incorporated into one model. The study finds that ASSM explains that innovations are a tool for increasing economic growth, employment and poverty reduction in the long-run. However, the theory indicates that this is subject to TFP and a nation’s absorption capacity.
Chapter Six concerns modelling FDI and explanatory variables as a means of establishing the approaches that can be employed to measure their effects on the dependent variables (economic growth, employment and poverty, based on the Solow-Swan Model). The other explanatory variables include: tourism, openness, GE, inflation, human capital, labour force (LF), telecommunication and civil war. The study concludes that first; FDI and tourism are foreign flows into developing countries such as Uganda, which supplement a nation’s private-sector investment gap. Second, the study explains that FDI, tourism, human capital and LF are factor inputs. Third, the study finds that following the Solow-Swan Model explains that these factor inputs depend on increasing TFP so as to benefit a nation positively. Fourth, the study finds that telecommunication is an innovation in the Solow-Swan Model, and as such is a pro-poor technology for a developing nation such as Uganda. Finally, the chapter finds that openness and inflation are innovations in the Solow-Swan Model.
procedure involved simultaneous equation simulation methods, diagnostic approaches, results presentation and interpretation, as well as Granger Causality methods. After these simulations, the findings and conclusions are presented as a summary of the chapters.
Chapter Eight involves testing the time-series properties. First, all series are transformed into logarithmic form, followed by constricting graphs as a means of deepening the understanding of the relationship among variables. Later, correlation analysis, trend analysis and endogeneity tests are conducted, followed by unit root, employing ADF, Phillips-Perron (PP) and the Kwiatkowsiki-Phillips-Schmidt-Shin (KPSS) tests. According to the findings, the series are non-stationary at level but stationary at first difference.
Chapter Nine estimates the short-run and long-run relationship among the cointegrating vectors employing Johansen’s Maximum Likelihood (JML) Method. To capture a short-run relationship among the series, the study first establishes a simultaneous equation. Using VAR, which explicitly uses JML Method through the VECM procedure, short-run relationships are captured, employing the F-statistics or Wald Chi-square test. Based on the same approach, ex-ante forecasting is conducted through impulse response and variance decomposition using the Monte Carlo procedure via the Cholesky-dof adjusted ordering. The study finds that short-run and long-run relationships exist among the series.
Chapter Ten estimates the impact of FDI and other explanatory variables on economic growth, employment and poverty in Uganda. The study first examines causality tests among interrelated variables. To capture these interrelationships, the study employs VECM, a procedure that opens an avenue through which causality can be tested among variables. The second section involves estimating the simultaneous equation developed in Chapter Nine, using OLS.
Uganda: The Economy and Economic Reforms
2.1
Introduction
This chapter provides a general overview of Uganda, outlining the prominent features of the country’s political background, governance and economy. The first part explains Uganda’s history, including colonisation and the economy before Independence in 1962. The second part examines Uganda after Independence, before and after the adoption of economic reforms. The third presents an account of Uganda’s economy, particularly economic growth, employment and poverty after the adoption of economic reforms between 1985 and 2014.
2.2
Overview of Uganda
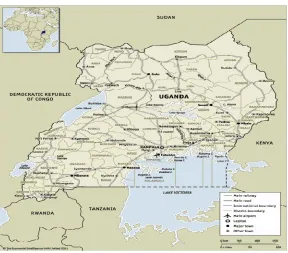
Uganda is a least-developed highly indebted poor country (HIPC) with a GDP of about USD 27,462 million (UBOS 2014). It is located in East Africa, with an area of 241,038 square kilometres including water where the land area covers 197,323 square kilometres, and has a population 34.85 million people (Population Secretariat 2012; UBOS 2016). Uganda borders Kenya in the east, Tanzania and Rwanda in the south, the Democratic Republic of Congo in the west and South Sudan in the north.
Before Independence in 1962, Uganda was a British Protectorate. The different forms of economic, political and governance systems since colonialism are illustrated Figure 2.2.
Figure 2.2: Uganda’s political, governance and economic spectrum, 1882–1994
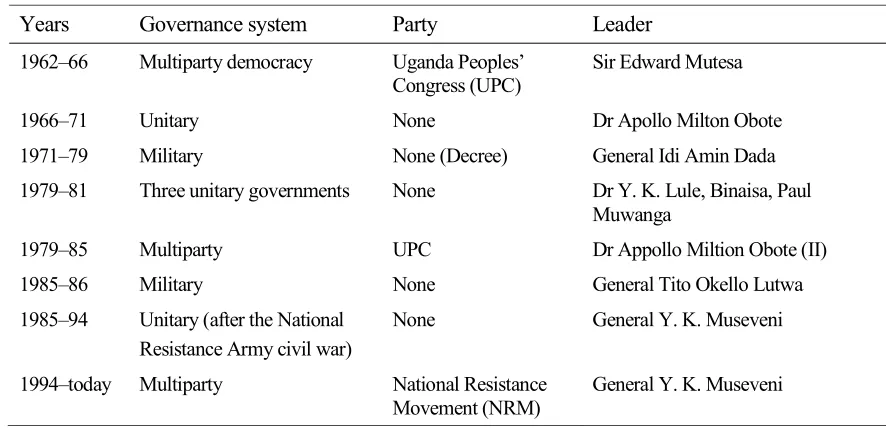
The spectrum is marked with two main dimensions: colonialism and Independence, after 1962. During colonialism, the British Government adopted indirect rule where Imperial British East Africa Company (IBEAC) administered Uganda until independence in 1962. After Independence Uganda has been politically governed through different systems summarised in Table 2.1.
Table 2.1: Systems of governance in Uganda, 1962 until today
Years Governance system Party Leader
1962–66 Multiparty democracy Uganda Peoples’ Congress (UPC)
Sir Edward Mutesa
1966–71 Unitary None Dr Apollo Milton Obote
1971–79 Military None (Decree) General Idi Amin Dada 1979–81 Three unitary governments None Dr Y. K. Lule, Binaisa, Paul
Muwanga
1979–85 Multiparty UPC Dr Appollo Miltion Obote (II)
1985–86 Military None General Tito Okello Lutwa
1985–94 Unitary (after the National Resistance Army civil war)
None General Y. K. Museveni
1994–today Multiparty National Resistance Movement (NRM)
General Y. K. Museveni
Source: Lwanga-Lunyiigo 1987; Mutibwa 1992; Reniers 2011
Since 1966, Uganda’s political landscape has been muddled with hostility, civil wars and
coup d’états. However, since the promulgation of the GOU 1995 Constitution, Uganda has been governed by a multiparty democracy. Citizens participate in the decision-making process, with elections held at a five-year interval (Konrad-Adenauer-Stiftung 2011). In accordance with the Constitution, there are three arms of government—executive, parliament
Colonialism Independence
Dual economy: FDI and smallholder rural farming
FDI nationalisation/
economic indigenisation FDI and economic reforms
1882 1877 1894 1962 1966 1971 1979 1986 1991 1994
and judiciary—through which decisions are made and executed. The three arms of power represent the rule of law, the separation of powers, economic freedoms and private-sector participation in the decision-making process.
2.3
Uganda’s Economy
Uganda is a landlocked, least-developed country and is very densely populated, with 174 persons per square kilometre (UBOS 2015). Despite being an HIPC, the country is endowed with abundant natural resources such as fertile soil, a tropical climate with regular rainfall, freshwater fish and mineral deposits. Agriculture is the most important sector of the economy, employing over 70% of the workforce (UBOS 2014). The main cash-crops introduced into Uganda during colonial times include coffee, cotton, tea and tobacco.
Due to Uganda’s abundant resources as previously explained, at Independence in 1962, Uganda’s future was promising, as it had a strong, young, diversified economy. Through the IBEAC dual economic system and British Government grants the nation had been transformed into a formal cash economy. In addition to large-scale farming, Asians— especially Indians—took up trade. Later, in 1946, Governor Hall appointed Dr E. B. Worthington to review the 1941 Uganda Development Plan (Gershenberg 1972). The Worthington Development Plan (WDP) was launched in December 1946, and covered a ten-year period, 1947–1957. The plan aimed to increase GE and public investment in sectors such as industry, mining and agricultural extension. As such, at independence, Uganda’s economy had a strong economic base. It relied upon four main subsistence cash-crops: cotton, coffee, tea and tobacco, with food self-sufficiency. The economy had been established on a young, growing manufacturing and mining sector.
Despite the vibrant economy at Independence, in 1966 the country descended into political and economic instability. This was after Prime Minister Sir Appollo Milton Obote overthrew the democratically elected government of Sir Edward Mutesa though a military coup (Moris 1966). Uganda’s bad situation was further exacerbated following the 1971 military coup, led by Idi Amin, which overthrew the unitary government of Obote. Politically, between 1971 and 1979, Uganda experienced over five4 uprisings and attempted coups
(Sejjaaka 2004). The economy dramatically deteriorated following the international sanctions in 1972, and most economic indicators became negative, as Figure 2.3 illustrates.
Figure 2.3: Selected economic indicators, 1960–2014
Source: WDI 1960-2014 (Constant market price 2005)
Figure 2.3 demonstrates that as Uganda became more politically chaotic, the economic situation was also unravelling. By 1979, GDPGR had declined to -11% per annum5. Gross
domestic savings as a percentage of GDP declined from 17.22% in 1963 to -0.43% in 1980. GDP per capita declined from USD 145.86 in 1971 to USD 99.19 in 1980, after Amin’s overthrow. During the same period, the age dependency ratio as a percentage of working-age population increased from 98.52% to 100.19%, indicating high unemployment. As such, during the 1970s, Uganda experienced severe macroeconomic imbalances and the country remained poor and ill-governed.
Exiled Ugandans were mobilised by President Julius Nyerere of Tanzania. To bring together Ugandan exiles who had fled Amin’s military dictatorship, the Moshi Conference was held. It included 28 different exiled Ugandan groups in late March 1979. At the conference, the Uganda National Liberation Front (UNLF) was formed and led by Professor Yusufu Kironde Lule. The Uganda National Liberation Army (UNLA)6 was also created, charged with the
responsibility of overthrowing Amin through a civil war. This occurred in 1979. Soon after the war, donor agencies led by the IMF and World Bank encouraged the GOU to adopt economic reforms. These reforms were aimed at rehabilitating the economy and rebuilding the dilapidated physical infrastructure, so as to provide social services.
5 For more detail, see Annex 2.1
6 The UNLA was led by exiled ex-president Obote, commandeered by his former General Tito Okello Lutwa and Major General David Oyite Ojok; Front for National Salvation (FRONASA) was led by Yoweri Kaguta Museveni; the Save Uganda Movement was led by Akena P’Ojok, William Omaria and Ateker Ejalu; and the Uganda Freedom Union was led by Godfrey Binaisa, Andrew Kayiira and Olara Otunnu.
2.4
Uganda Adopts Economic Reforms
After the overthrow of Amin, the Government, led by Lule, was preoccupied with two critical tasks: political stability and economic recovery. Lule presided over a political grouping that had been hastily formed under the guidance of President Nyerere of Tanzania. Due to the hasty formation of the UNLF and UNLA, Uganda’s political situation turned chaotic soon after the overthrow of Amin. Within six years—between April 1979 and January 1986— Uganda had six short-lived regimes (see Table 2.1). The years soon after Amin’s overthrow were muddled by political infighting between factions that had come together to form the UNLF and UNLA. Two phases of economic reforms can be identified.
2.4.1Economic Reforms Phase One: 1979–1985
The vibrant economy that was in the making at Independence was crippled under Amin’s military regime. With the closure of borders, there were neither imports nor exports. All industries closed down and consumer goods were scarce. Out of 930 enterprises registered in 1971, only 300 remained in the early 1980s, with an estimated capacity utilisation of just 5% (Livingstone 1998).
After the overthrow of Amin, relative peace returned to Uganda. Rehabilitation of the social and economic infrastructure was a priority. Democracy returned to the country, and in December 1980 elections were held and won by Obote. The elected government inherited an economy with a destroyed infrastructure and industrial base, so they embarked upon economic recovery after a decade of international sanctions. In 1981, the Structural Adjustment Programme (SAP) was adopted, supported by donor agencies led by the IMF and the World Bank (Holmgren et al. 1999; Nyorekwa & Odhiambo 2014). The SAP was comprised of three broad strategies: macroeconomic stability, openness and inviting foreign investors back. By controlling GE, reducing the overall budget deficit and increasing public sector accountability, the intention was to curb corruption.
2010)7 emerged between 1981 and 1985. The situation further deteriorated when Obote was
overthrown in a 1985 military coup, led General Tito Okello Lutwa. Later, in turn, the military junta was overthrown by the NRM, led by Museveni. This marked the beginning of the second phase of economic reforms.
2.4.2Economic Reforms Phase Two: 1986–2014
To accelerate economic growth and reduce poverty, after overthrowing the 1985 military junta, the NRM Government made extensive and sustained economic reforms. These were implemented with support from the IMF and World Bank. The SAP, which had been suspended during the war, was resumed, and the Economic Recovery Program (ERP) was introduced in 1987 (Holmgren et al. 1999; Nyorekwa & Odhiambo 2014; Sejjaaka 2004). In 1997, to implement the ERP, the government introduced the Poverty Eradication Action Plan (PEAP), which had five pillars: Pillar 1: economic management; Pillar 2: enhancing production, competitiveness and income; Pillar 3: security, conflict resolution and disaster management; Pillar- 4 Good governance and Pillar- 5 Human development.
The PEAP aimed to reduce poverty through accelerated economic growth and employment. First, it aimed to streamline fiscal policy reforms through GE efficiency and human capital development. Second, it aimed to control inflation through monetary policy reforms. Third, commercial policies were introduced to increase international trade, communication and tourism and spur private investment. Following these reforms as indicated by Figure 2.3, WDI indicates GDP 2005 constant market price increased from USD 2,708.22 million in 1985 to USD 16,406.24 million in 2014. Meanwhile, GDPGR has been increasing but with wide fluctuations and often declining. For example GDPGR increased from -3.31 percent per annum in 1985 to 11.52 percent per annum in 1995. Since 1995, Uganda has been experiencing declined GDPGR. In particular, from 1995 level GDPGR declined to 3.27 percent per annum in 2013, though increased to 4.51 percent per annum in 2014. However, in general economic and social indicators as indicated under Appendix 2.2 demonstrate that the economy of Uganda has improved during the period 1985-2014. This achievement can be attributed to various macroeconomic reforms adopted by the GOU.
2.5
Government Expenditure Reforms
Following the SAP and ERP, the GOU implemented fiscal policy reforms in public expenditure management through the Medium-Term Economic Framework (Fan & Zhang 2008; Fölscher 2006). The reforms were aimed at improving efficiency and effective utilisation of public funds, to reduce poverty, improve management and accountability. Fiscal reforms were to improve the transparency in the national budget process and implementing public projects supported by domestic tax revenue and grants. As a result, WDI indicate that GE increased from USD 483.68 million in 1985 to USD 1,794.76 million in 2014.
Figure 2.4: Total government sectoral consumption and percentage distribution per sector, 1985–2014
Source: WDI 1985-2014 (constant market prices 2005); UBOS (Sectoral distribution 1985-2014); own calculations
Note: PA=Public administration; Def=Defence; Educ=Education; ECSS=Economic and social services; R/T=Road and Transport; AAF/F=Agriculture, animals, fisheries and forestry; I/O=Internal order.
The priorities of the GOU are reflected through the GE sectoral composition. In particular, public administration, defence and education are the main priorities of government. However, as indicated by Appendex-2.3, the GOU has shifted attention to other sectors, such as community and the roads and transport.
2.6
Inflation Control and Economic Reforms
Inflation is a general rise in the level of prices paid for goods and services over time, and usually reported monthly, quarterly and annually. Across the world, inflation is one of the main economic challenges faced by households, because it affects the material living
26.01 19.28 17.82 11.30 7.78 7.56 6.82 3.43
50.00 100.00 150.00 200.00 250.00 300.00
PA Def Educ ECSS R/T I/O Health AAF/F
U
SD
M
ill
io
ns
Sector
standards of communities, especially the poor in developing countries. Prices for goods and services rise but income remains constant. Inflation denies the basic commodities of life to households, such as food, clothing and housing. In extreme cases, countries experience hyperinflation, which is when prices rise rapidly by 100% or more per annum. Conversely, nations may experience deflationary situations, when prices for goods and services decline. This may lead to a depression.
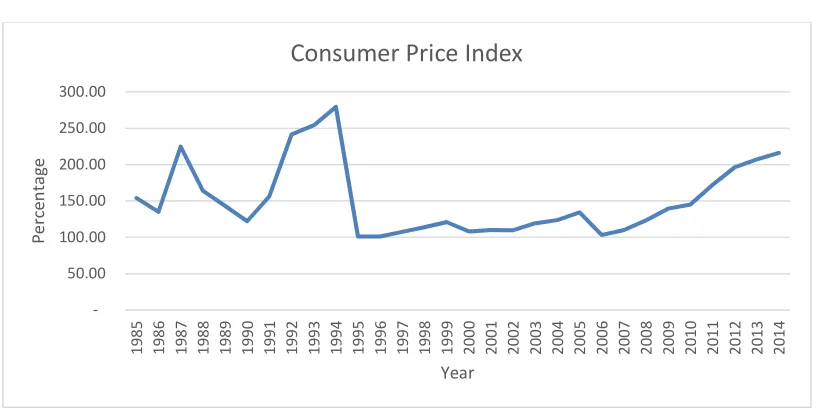
In the 1970s, Uganda experienced hyperinflation. Inflation was recorded at 216% per annum in 1979 (Bigsten & Kayizzi-Mugerwa 1999). As part of the ERP and PEAP initiatives, inflation started to decline, indicated by the Consumer Price Index (CPI).
Figure 2.5: Trends in Uganda’s CPI 1985–2014
Source: WDI, UBOS (1985-2014)
With donor support, CPI started to decline. For example, it went from 154% to 101.10% per annum in 1996. Though CPI started to rise to the current 216% per annum, headline inflation reduced from 157.66% per annum in 1985 to 4.3% per annum in 2014. Despite advances in macroeconomic stability, CPI again increased to 216%
per annum in 2014. Economic growth declined while unemployment and poverty increased.
2.6.1Impact of Inflation on Economic Growth, Employment and Poverty in Uganda
Inflation in Uganda can be attributed to increasing money supply, world energy and food prices. Since inflation leads to price increases, rural poor communities (comprising 80% of the total population in Uganda) are most affected. This is because, first, the share of consumption in total income is larger for consumer goods such as food, soap, salt and cloth. Second, the income for agricultural products and salary earners does not increase in a similar