___________________________________________________________________________________________ 4(36): 5853-5865, 2014
ISSN: 2231-0614
SCIENCEDOMAINinternational
www.sciencedomain.org
Radiological Health Hazard Indices and Excess
Life Time Cancer Risk of Oil Producing
Communities in Nigeria
H. U. Emelue
1*, B. Nwaka
1, K. Amanze
2and C. O. Nwosu
1 1Department of Physics, Alvan Ikoku Federal College of Education, P.M.B. 1033, Owerri,Nigeria.
2Department of Chemistry, Alvan Ikoku Federal College of Education, P.M.B. 1033, Owerri,
Nigeria.
Authors’ contributions
This work was carried out in collaboration between all authors. Author HUE collected the samples, did the laboratory analysis and designed the study. Author BN wrote the first draft of the manuscript and managed the analyses of the study. Authors KA and CON managed the literature searches. All authors read and approved the final manuscript.
Article Information
DOI: 10.9734/BJMMR/2014/10381 Editor(s): (1) Jia Xu, University of Texas-M.D. Anderson Cancer Center, Houston, USA. Reviewers: (1) Anonymous, Nuclear and Radiological Regulatory Authority, Egypt. (2) Andrew Kesselman, Department of Radiology, SUNY Downstate Medical Center, Brooklyn, USA. (3) Anonymous, University of Ilorin Teaching Hospital, Nigeria. Peer review History: http://www.sciencedomain.org/review-history.php?iid=628&id=12&aid=5912
Received 26thMarch 2014 Accepted 2ndMay 2014 Published 26thAugust 2014
ABSTRACT
The γ radiation exposure due to radioactivity concentration of 40K, 238U and 232Th in soil samples from 250 different locations from 40 communities in the oil – producing region of Nigeria was carried out. The radioactivity concentrations of these radionuclides were used to determine the absorbed dose, annual effective dose equivalent, the health hazard indices and cancer risk using standard analytical methods. The range of values for the absorbed dose are 6.97 nGyh-1 to 33.29 nGyh-1, annual effective dose equivalent
(outdoor) are 8.55 µSvy-1to 40.83 µSvy-1and (indoor) are 34.19 µSvy-1to 163.36 µSvy-1.
The external hazard index ranges from 0.038 to 0.174 while the internal health hazard index is from 0.045 to 0.191. The cancer risk obtained for the communities ranges from 0.030 x 10⁻³to 0.143 x 10⁻³. All these values are below the standard limits when compared to the world permissible United Nations Scientific Committee on the Effect of Atomic Radiation (UNSCEAR) values for such environment. This shows that the exploration and exportation of crude oil in Nigeria did not pose a radioactive health hazard to the oil producing communities.
Keywords: Radioactivity concentration; absorbed dose; effective dose equivalent; health hazard indices, excess lifetime cancer risk.
1. INTRODUCTION
Petroleum products are very useful substances derived from crude oil. These products supply more than 80% of the world’s energy needs [1]. Crude oil is a complex mixture of compounds of hydrocarbon molecules among many other materials. When they pass through a process of fractional distillation in the refinery, they yield different kinds of petroleum products, which include various grades of fuel oil, gasoline, aviation fuel, asphalt, tar, paraffin wax, lubricating and other heavy oil, which are energy – producing substances. Crude oil is a mineral deposit found mostly below the sub – surfaces and under – water surfaces. It means that they have to be discovered, drilled out before they are refined into energy – producing petroleum products.
Crude oil was first discovered in commercial quantity in Nigeria in January 1956 in Oloibiri, a small town in the Niger – Delta region of the country. Exploration started in 1958 and has continued until date. Moreover, the activities of the oil exploration companies have been on the increase in the area with so much conflicts and agitations from the host communities. These conflicts arise because of environmental degradation and oil spillages, which pollute the water and the farmlands, since all of Nigerian crude oil comes from this region of the country [2]. An average of 240,000 barrels of crude oil is spilled in the region every year [3]. Hazards posed by such pollutions are not only in terms of odor, presence of disease causing micro – organisms and destruction of their means of lively hood, but also from radiation emanating from such pollutions [4]. Nigeria is endowed with abundant deposit of crude oil and hence, the financial relevance to the country is remarkable. According to [5], production of oil and gas resources, which have been ongoing for the past five decades, accounts for over 85 % of the country's gross domestic product (GDP) and over 95% of nation’s foreign exchange revenues.
At present, the petroleum industry is the highest importer and user of radioactive substances in Nigeria [6]. In most of the sectors of oil and gas exploration, radioactive materials and radiation generators are used on a large scale. These applications of radioactive materials in both off shore and on shore drilling includes industrial radiography, use of radiotracers in pipes, well logging, automatically ionizing radiation gauge, mapping, evaluation of geological formations and the extraction of other natural hydrocarbon resources [7,8].
oil in the descending order according to their quantity of exportation includes: Russia, Saudi Arabia, United States of America USA, Iran, China, Canada, Iraq, United Arab Emirates Venezuela, Mexico, Kuwait, Brazil and Nigeria (13th on the world list and the highest in Africa) [9]. Some of these countries have been able to adequately assess and address these concerns locally. Exploration for and production of petroleum, have caused local detrimental impacts to soil surfaces, groundwater and ecosystems in the 36 producing states in the United States of America (USA) [10,11]. Hence, new environmental laws and improved industrial practices and technologies have been introduced in USA to reduce the most detrimental effects of petroleum activities [12]. Nigeria has not been able to do much in that direction. Although some studies has been done on the radionuclide concentration of the water and soil samples in the area, as reported by [2,3,7,13], none of these focused on the radiation health hazard and the excess lifetime cancer risk. The purpose of this research work is therefore to:
1. Determine how much the five decade of oil exploration in the area has imparted on the natural radionuclides concentration compared to world standard.
2. Determine the cancer risk and the health hazard implications to the oil producing communities in Nigeria.
3. Obtain a radiometric data for the area under review for future references and research.
2. MATERIALS AND METHODS
Soil samples were collected from two hundred and fifty (250) different locations across forty (40) communities in the oil – producing communities of the Niger – Delta region of Nigeria. This is to ensure a very good coverage of the entire region. Samples at each site were collected to a depth of about 150 mm to 200 mm below the soil surface. Table 2 shows the number of samples collected against each community. Then the map of the study area is in Fig. 1. The samples were placed in a labeled waterproof nylon bag and transferred to the laboratory for analysis. Then they were air – dried and homogenized to pass 1mm mesh sieve. About 0.2kg of each sample were weighed and fed into a plastic container of about 8cm in height and 7cm in diameter. The containers were sealed for twenty eight (28) days for the short – lived members of Uranium and Thorium series to reach a secular equilibrium. The samples were placed symmetrically on top of the detector and measured for 10 hours (36000 seconds). The net area under the corresponding photopeaks in the energy spectrum was computed by subtracting count due to Compton scattering of the background source from the total area of the photopeaks. The radionuclides were computed using the algorithm of the multichannel analyzer (MCA).
The scintillation detector used in this work is a lead shield Canberra 76mm x 76mm NaI(TI) crystal models number 802 – series. One face of the cylindrical detector is free while the other is optically coupled to a Photomultiplier tube that detects the small visible light photons produced in the crystal and converts them into amplified electrical pulses, which is fed into analyzer systems (Canberra series 10 plus multichannel analyzer MCA) through a preamplifier base.
preset counting time of 10 hours (36,000s), the channels of the various photopeaks corresponding to the gamma energies were then identified. Then the efficiency calibration was to determine the gamma ray counting efficiencies over energy range of 0.662 – 2.615 Mev. This was done by converting the count per seconds under the photopeaks to activity concentration Bqkg-1 of certified reference standard samples. The certified reference
standard samples have activity concentrations of 7.24 Bqkg-1for137Cs (0.662 Mev), 578.40
Bqkg-1 for 40K (1.460 Mev), 20.90 Bqkg-1 for 238U (1.760 Mev) and 10.47 Bqkg-1 for 232Th (2.615 Mev). Efficiencies at different gamma energy peaks are given in Table 1.
Table 1. Efficiencies at different gamma energy peaks Radionuclide Activity of the
reference sources (Bqkg-1)
Energy
(Mev) Gamma yield Peak net area(count/s) Efficiency(%)
Cs-137 7.24 0.662 0.852 2476 5.57
K- 40 578.40 1.460 0.107 8342 1.87
U-238 20.90 1.760 0.159 400 1.67
Th-232 10.47 2.615 0.358 364 1.35
The reference standard sources were counted for 10 hours (36,000s) after which the counting efficiencies of the different gamma energies were determined. According to [14,15], the count rate Anet under the photopeak of each of the three primordial radionuclides is
related to activity concentration by the equation 1.
t
M
Y
A
A
s y
net s
(1)Where
s
A
= activity concentration in Bqkg-1
= the efficiency of the detector at a particular γ – energyAnet= count rate under the photopeak of the three primordial radionuclides,
Yγ = the yield of the gamma ray at a particular energy,
Ms= the mass of the samples (0.2kg)
Ts= the counting time in seconds.
3. RESULTS AND ANALYSIS
In this study, the following parameters were determined in order to adequately assess the health hazard indices and excess lifetime cancer risk. These parameters are:
3.1 Radioactivity Concentration
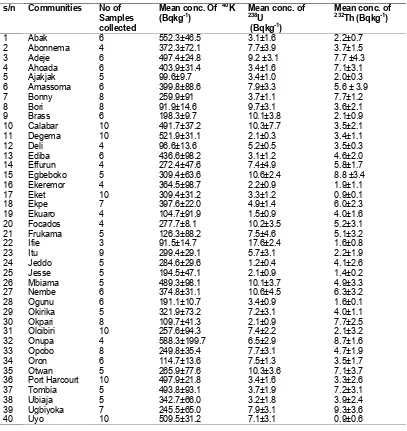
The radioactivity concentrations of the three primordial radionuclides were computed using equation 1 above. The values of the mean concentration in the 40 communities are recorded in Table 2.
Table 2. The activity concentrations of the three primordial radionuclides of the soil samples from the communities
s/n Communities No of Samples collected
Mean conc. Of 40K
(Bqkg-1) Mean conc. of238U (Bqkg-1)
Mean conc. of 232Th (Bqkg-1)
1 Abak 6 552.3±46.5 3.1±1.6 2.2±0.7
2 Abonnema 4 372.3±72.1 7.7±3.9 3.7±1.5
3 Adeje 6 497.4±24.8 9.2 ±3.1 7.7 ±4.3
4 Ahoada 6 403.9±31.4 3.4±1.6 7.1±3.1
5 Ajakjak 5 99.6±9.7 3.4±1.0 2.0±0.3
6 Amassoma 6 399.8±88.6 7.9±3.3 5.6 ± 3.9
7 Bonny 8 259.9±91 3.7±1.1 7.7±1.2
8 Bori 8 91.9±14.6 9.7±3.1 3.6±2.1
9 Brass 6 198.3±9.7 10.1±3.8 2.1±0.9
10 Calabar 10 491.7±37.2 10.3±7.7 3.5±2.1
11 Degema 10 521.9±31.1 2.1±0.3 3.4±1.1
12 Deli 4 96.6±13.6 5.2±0.5 3.5±0.3
13 Ediba 6 436.6±98.2 3.1±1.2 4.6±2.0
14 Effurun 4 272.4±47.6 7.4±4.9 5.8±1.7
15 Egbeboko 5 309.4±63.6 10.6±2.4 8.8 ±3.4
16 Ekeremor 4 364.5±98.7 2.2±0.9 1.9±1.1
17 Eket 10 309.4±31.2 3.3±1.2 0.9±0.1
18 Ekpe 7 397.6±22.0 4.9±1.4 6.0±2.3
19 Ekuaro 4 104.7±91.9 1.5±0.9 4.0±1.6
20 Focados 4 277.7±8.1 10.2±3.5 5.2±3.1
21 Frukama 5 126.3±88.2 7.5±4.6 5.1±3.2
22 Ifie 3 91.5±14.7 17.6±2.4 1.6±0.8
23 Itu 9 299.4±29.1 5.7±3.1 2.2±1.9
24 Jeddo 5 284.6±29.6 1.2±0.4 4.1±2.6
25 Jesse 5 194.5±47.1 2.1±0.9 1.4±0.2
26 Mbiama 5 489.3±98.1 10.1±3.7 4.9±3.3
27 Nembe 6 374.8±31.1 10.6±4.5 6.3±3.2
28 Ogunu 6 191.1±10.7 3.4±0.9 1.6±0.1
29 Okirika 5 321.9±73.2 7.2±3.1 4.0±1.1
30 Okpari 8 109.7±41.3 2.1±0.9 7.7±2.5
31 Oloibiri 10 257.6±94.3 7.4±2.2 2.1±3.2
32 Onupa 4 588.3±199.7 6.5±2.9 8.7±1.6
33 Opobo 8 249.8±35.4 7.7±3.1 4.7±1.9
34 Oron 6 114.7±13.6 7.5±1.3 3.5±1.7
35 Otwan 5 265.9±77.6 10.3±3.6 7.1±3.7
36 Port Harcourt 10 497.9±21.8 3.4±1.6 3.3±2.6
37 Tombia 5 493.8±93.1 3.7±1.9 7.2±3.1
38 Ubiaja 5 342.7±66.0 3.2±1.8 3.9±2.4
39 Ugbiyoka 7 245.5±65.0 7.9±3.1 9.3±3.6
3.2 Radium Equivalent Activity (Raeq)
The distribution of 40K, 238U and232Th in the soil is not uniform. Uniformity with respect to
exposure to radiation has been defined by radium equivalent activity Raeqin Bqkg-1. This
compares the specific activity of materials containing different amounts of 40K, 238U and
232Th. It is defined as an estimation of radiation 370 Bqkg-1of 238U, 259 Bqkg-1of 232Th and
4810 Bqkg-1of40K that produces the same gamma dose rate. Ra
eqwas calculated using the
formula [16].
Raeq=
C
U370
C
Th259
C
K4810
x
370
(2)The values of Raeqare in Table 3. The maximum tolerable value is 370 Bqkg-1[17].
3.3 Annual Gonad Equivalent Dose (AGED)
The gonads, the activity bone marrow and the bone surface cells were considered as organs of interest [18]. The AGED for the communities was calculated using equation 3 and the values got are recorded in Table 3.
AGED =
3
.
09
C
U
4
.
18
C
Th
0
.
314
C
K (3)Ck, CU, and CTh are the activity concentrations of Potassium, Uranium and Thorium
respectively.
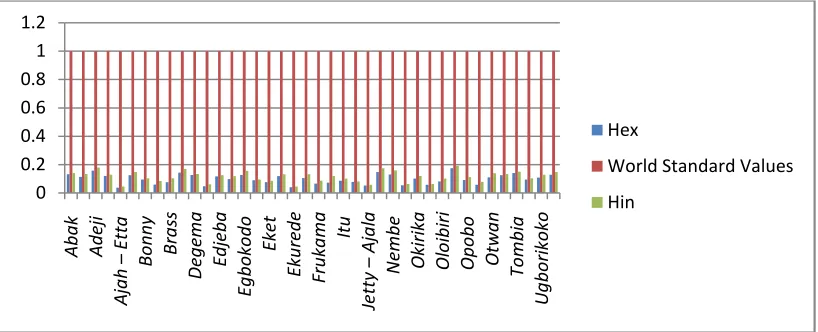
3.4 External Hazard Index (Hex)
The external hazard index is an evaluation of the outdoor hazard of the natural gamma radiation. This is defined by equation 4 [16].
Hex=
C
U370
C
Th259
C
K4810
1
(4)3.5 Internal Hazard Index (Hin)
Internal radiation hazard indices was also considered in this work because this could cause respiratory diseases like asthma and cancer. This is defined by equation 5. [16]
Hin=
C
U185
C
Th259
C
K4810
1
(5)3.6 Gamma Absorbed Dose Rate
(nGyh
-1)
The gamma absorbed dose rate (D) in the outdoor air at 1m above the ground level was equally computed using equation 6 [19].
D =
0
.
042
C
K
0
.
429
C
U
0
.
666
C
Th (6)Where Ck, CU and CTh are the activity concentrations of potassium (k), Uranium (U) and
Thorium (Th) respectively. The values of the gamma absorbed dose rate (D) for the communities are recorded in Table 3. The world’s permissible level is 60nGyh-1[19].
Fig. 2. The Health hazard indices compared to the World Standard values
3.7 Annual Effective Dose Equivalent (AEDE)
The annual effective dose equivalent radiation is computed from absorbed dose rate by applying a dose conversion factor of 0.7 Svy-1 and occupancy factor of 0.8 (19/24) for
outdoor radiation and 0.2 (5/24) for indoors. This was done on the estimation that an average person spends about 19 hours outdoors and 5 hours indoors according to [20]. The equations used for outdoor and indoor AEDE are given in equations 7 and 8 respectively.
AEDE (outdoor) = absorbed dose x 8760 hrs x 0.7 Svy-1x 0.2 x 10-3
AEDE (indoor) = absorbed dose x 8760hrs x 0.7 Svy-1x 0.8 x 10-3
The values obtained for the communities are recorded in Table 3. The world annual effective dose equivalent is 70µSvy-1for the outdoor AEDE and 450µSvy-1for the indoor AEDE [18].
3.8 Excess Lifetime Cancer Risk (ELCR)
Excess lifetime cancer risk deals with the probability of developing cancer over a lifetime at a give exposure level. ELCR is given as equation 9 [21].
ELCR = AEDE x DL x RF (9)
0 0.2 0.4 0.6 0.8 1 1.2 Ab ak Ad ej i Aj ah – Et ta Bo nn y Br as s De ge m a Ed je ba Eg bo ko do Ek et Ek ur ed e Fr uk am a Itu Je tt y – Aj ala N em be O kir ik a O lo ib iri O po bo O tw an To m bia Ug bo rik ok o Hex
Table 3. Radium equivalent activity, health hazard indices, annual effective dose equivalent and the cancer risk
Communities RaeqBqkg-1 AGED
Bqkg-1 Hex Hin DGyh
-1
(10-9) AEDE(outdoor) Svy-1(10-6)
AEDE (indoor) Svy-1(10-6)
ELCR 10-3
1 Abak 48.77 192.20 0.132 0.140 25.99 31.87 122.64 0.112
2 Abonnema 41.66 156.16 0.113 0.133 21.40 26.24 104.98 0.092
3 Adeje 58.50 216.77 0.158 0.180 29.96 36.74 146.97 0.129
4 Ahoada 44.65 167.00 0.121 0.129 23.15 28.39 113.56 0.099
5 Ajakjak 13.93 50.14 0.038 0.046 6.97 8.55 34.19 0.030
6 Amassoma 46.69 173.36 0.126 0.147 23.91 29.32 117.29 0.103
7 Bonny 34.02 120.58 0.094 0.104 17.63 21.62 86.48 0.076
8 Bori 21.92 73.88 0.059 0.085 10.42 12.78 91.11 0.045
9 Brass 28.37 102.25 0.077 0.104 14.06 17.24 68.97 0.060
10 Calabar 53.17 200.85 0.144 0.170 27.40 33.60 134.40 0.118
11 Degema 47.29 184.58 0.127 0.133 25.09 30.77 123.08 0.108
12 Deli 17.64 61.03 0.048 0.061 8.62 10.57 42.29 0.037
13 Ediba 43.30 165.90 0.117 0.125 22.73 27.88 111.50 0.098
14 Effurun 36.68 132.64 0.099 0.119 18.48 22.66 90.66 0.079
15 Egbeboko 47.01 166.69 0.127 0.155 23.40 28.70 114.78 0.101
16 Ekeremor 32.98 129.19 0.089 0.095 17.52 21.49 85.95 0.075
17 Eket 28.41 111.11 0.077 0.086 15.00 18.39 73.58 0.064
18 Ekpe 44.10 165.07 0.119 0.132 22.80 27.96 111.85 0.098
19 Ekuaro 15.28 64.23 0.041 0.045 7.70 9.44 37.77 0.033
20 Focados 39.02 140.45 0.105 0.132 19.50 23.91 95.66 0.084
21 Frukama 24.52 84.15 0.066 0.086 11.91 14.61 58.43 0.051
22 Ifie 26.93 89.80 0.073 0.120 12.46 15.28 61.12 0.054
23 Itu 31.90 120.82 0.086 0.101 16.49 20.22 80.89 0.071
Communities RaeqBqkg-1 AGED
Bqkg-1 Hex Hin DGyh
-1
(10-9) AEDE(outdoor) Svy-1(10-6)
AEDE (indoor) Svy-1(10-6)
ELCR 10-3
25 Jesse 19.08 73.41 0.052 0.057 10.00 12.26 49.06 0.043
26 Mbiama 54.78 205.33 0.148 0.175 17.38 21.31 85.26 0.075
27 Nembe 48.47 176.78 0.131 0.159 24.48 30.02 120.09 0.105
28 Ogunu 20.40 77.20 0.055 0.064 23.68 29.04 116.16 0.102
29 Okirika 37.71 140.04 0.102 0.121 19.27 23.63 94.53 0.083
30 Okpari 21.56 73.12 0.058 0.063 10.64 13.05 52.19 0.046
31 Oloibiri 30.24 112.53 0.082 0.102 15.50 19.01 76.04 0.067
32 Onupa 64.24 241.18 0.174 0.191 33.30 40.84 163.36 0.117
33 Opobo 33.66 103.88 0.091 0.111 16.88 20.71 82.81 0.059
34 Oron 21.34 73.82 0.058 0.078 10.37 12.72 50.87 0.045
35 Otwan 40.94 145.00 0.110 0.138 20.32 24.92 99.68 0.087
36 Port Harcourt 49.46 180.64 0.125 0.134 24.70 30.29 121.17 0.106
37 Tombia 52.02 196.58 0.140 0.150 27.12 33.26 133.04 0.116
38 Ubiaja 35.17 133.80 0.095 0.103 23.10 28.33 113.32 0.099
39 Ugbiyoka 40.10 140.37 0.108 0.129 19.90 24.41 97.62 0.085
40 Uyo 47.62 185.68 0.128 0.148 25.00 30.66 150.31 0.107
Where AEDE is the annual effective dose equivalent,
DL is the average duration of life (estimated to be 70 years) and
RF is the risk factor i.e. fatal cancer risk per sievert. For stochastic effects, the International Commission on Radiological Protection (ICRP) uses RF as 0.05 for the public [21]. The result obtained for ELCR is recorded in Table 3 and the chart comparing the values to the world permissible standard of 0.290 x 10⁻³is shown in Fig. 3 below.
Fig. 3. Excess Lifetime Cancer Risk compared to the World standard values
4. CONCLUSION
The evaluation of radiation health hazard indices and excess lifetime cancer risk of 40 oil-producing communities in the Niger – Delta region of Nigeria has been carried out. The values obtained when compared with the various world permissible values were found to be below the standard for such environment and hence the exploration and exportation of oil did not pose any significant health threat to the communities.
CONSENT
Not applicable.
ETHICAL APPROVAL
Not applicable.
COMPETING INTERESTS
Authors have declared that no competing interests exist.
0 0.05 0.1 0.15 0.2 0.25 0.3 0.35 Ab ak Ad eji Aja h – Et ta Bo nn y Br as s De ge m a Ed je ba Eg bo ko do Ek et Ek ur ed e Fr uk am a Itu Je tt y – Aja la Ne m be Ok iri ka Ol oi bi ri Op ob o Ot w an To m bi a Ug bo rik ok o ELCR
REFERENCES
1. Energy Information Administration (EIA). Annual energy outlook 2004 with projections to 2025 overview; 2004 Washington DC.
2. Aniefiok E Ite, Udo J Ibok, Margaret U Ite, Sunday W. Petters. Petroleum exploration and production: Past and present environmental issues in the Nigeria’s Niger – Delta. American J. of Environmental Protection. 2013;1(4)78–90.
3. Ordinoha B. Brisibe S. The human health implications of crude oil spills in the Niger delta, Nigeria: An interpretation of published studies. Niger Med J. 2013;54(1):10–16. 4. Ojoawo S, Agbede O, Sangodoyin A. On the Physical Composition of Solid Wastes in
Selected Dump sites of Ogbomosho land, south – Western Nigeria. J. of Water Resources and Protection. 2011;3:661-666.
5. Aaron KK. Perspective big oil rural poverty and environmental degradation in the Niger – Delta region of Nigeria. J of Agricultural safety and Health. 2005;(1192):127–134. 6. Elegba S B Peace applications of nuclear energy in Nigeria. An Invited Paper at the
Workshop on Radiation Safety and Nigeria Legal System (Zaria, Kaduna state, Nigeria, June). 1995;9.
7. Arogunjo M A, Farai I P and Fuwape I A. Dose rate assessment of terrestrial gamma radiation in the Delta region of Nigeria. Rad. Protection Dosimetry. 2004;(108):73 –77. 8. Avwiri GO, Agbalagba EO, Enyinna PI. Terrestrial radiation around oil and gas
facilities in Ughelli Nigeria. J Applied sci. 2007;7(11):1543–1546.
9. Available: www.wikipedia.org/wiki/list_of_countries_by_oil_productio. Assessed on 15thof January 2014.
10. Richter BC, Kreitler CW. Geochemical techniques for identifying sources of ground-water Salinization: Boca Raton, Florida CK. Smoley, CRC Press, Inc. 1993;258. 11. Kharaka YK, Hanor JS. Deep fluids in the continents: I. Sedimentary basins, in Drever
JI, ed., Treatise on Geochemistry. 2003;5:499– 540.
12. General Accounting Office. National wildlife refuges: Opportunities to improve the management and oversight of oil and gas activities on federal lands; 2003. GAO-03-517.67.
13. Anekwe UC, Avwiri GO, Agbalagba EO. Assessment of gamma radiation levels in selected oil spilled areas in River, Nigeria. Cscanadian Energy Science and Technology. 2013;5(7):33–37.
14. Obed RI, Farai IP, Jibiri NN Population dose distribution due to soil radioactivity concentration levels in 18 cities across Nigeria. J. Rad. Prot. 2005;25:305–312. 15. Jibiri NN, Farai IP, Alausa SK. Estimation of annual effective dose due to natural
radioactive element in ingestions of foodstuffs in tin mining area of Jos – Plateau, Nigeria. J. Environ Rad. 2007;94:31–40.
16. Beretka J, Mathew PJ. Natural radioactivity of Australia building material wastes and by – products. Health phy. 1985;4:87–95.
17. Sam AK, Abbas N. Assessment of radioactivity and associated hazards in local and imported cement types used in Sudan. Rad. Prot. Dosimetry. 2010;88:225–260. 18. United Nations Scientific Committee on the Effect of Atomic Radiation (UNSCEAR
1988) Sources, effects and risks of ionizing radiation report to the general assembly with annexes. United States publication E88ix 17 (United Nations) New York; 1988. 19. United Nations Scientific Committee on the Effect of Atomic Radiation (UNSCEAR
20. Veiga RG, Sanches N, Anjos RM, Macario K, Bastos J, Iguatemy M, Auiar JG, Santos AMA, Mosquera B, Carvalho C, Baptistafilho M, Umisedo NK. Measurement of natural radioactivity in Brazil beach sands. Radiation measurement.2006;41:189–196.
21. Taskin H, Karavus M, Ay P, Topuzoglu A, Hindiroglu S, Karahan G, Radionuclide concentrations in soil and lifetime cancer risk due to the gamma radioactivity in Kirklareli, Turkey, J. Environ. Rad. 2009;100:49-53.
© 2014 Emelue et al.; This is an Open Access article distributed under the terms of the Creative Commons Attribution License (http://creativecommons.org/licenses/by/3.0), which permits unrestricted use, distribution, and reproduction in any medium, provided the original work is properly cited.
Peer-review history:
The peer review history for this paper can be accessed here: