_____________________________________________________________________________________________________ www.sciencedomain.org
The Effect of Body Mass Index and Waist
Circumference on Blood Pressure
Odokuma Emmanuel Igho
1*1
Department of Human Anatomy and Cell Biology, College of Health Sciences, Delta State University, Abraka, Nigeria.
Author’s contribution
The sole author designed, analyzed and interpreted and prepared the manuscript.
Article Information
DOI:10.9734/BJMMR/2015/9663
Editor(s):
(1) Kate S. Collison, Department of Cell Biology, King Faisal Specialist Hospital & Research Centre, Saudi Arabia.
Reviewers:
(1) Anonymous, University of Santa Cruz do Sul – UNISC, RS, Brazil. (2) DC Ranasinghe, Faculty of Medicine University of Colombo, Sri Lanka. (3) Mra Aye, Department of Medicine, UniKL Royal College of Medicine, Perak, Malaysia. (4) Anonymous, Aichi Children’s health and Medical Center, Aichi, Japan. Complete Peer review History: http://www.sciencedomain.org/review-history.php?iid=663&id=12&aid=6117
Received 21st February 2014 Accepted 3rd September 2014 Published16th September 2014
ABSTRACT
This study was aimed at determining the pattern of some assessors of obesity including body mass index (BMI) and waist circumference (WC) and the effect of these parameters on blood pressures in the studied population. The sample consisted of three hundred and fifty (350) undergraduate female students of Delta State University, Abraka, Delta State Nigeria, with ages between 18-26 years. The study showed that 32.56% were overweight and while over 10.00% were obese. A total of 6.39% were undernourished and there was a recorded steady rise in blood pressure as the BMI increased. The BMI was observed to correlate positively with both systolic and diastolic blood pressures (p < 0.01; 0.23, 0.18) with an observed significant correlation between WC and both diastolic (DBP) and systolic blood pressures (SBP) (p < 0.01; 0.25, 0.26). Both systolic and diastolic pressures showed a significant relationship with WC and this correlation was significant at 0.01 levels of significance. This study further established that BMI and WC were significantly correlated with DBP and SBP. These non invasive parameters are therefore reliable indicators of obesity and associated hypertension.
Keywords: Obesity; body mass index; systolic blood pressure; diastolic blood pressure; waist circumference.
1. INTRODUCTION
Affluence and development have both been described as a prelude to obesity which commonly originates from sedentary lifestyle and faulty diet; common attributes of urbanization [1]. This pandemic involves both adults and children and it is more apparent in developed countries especially Europe and America. In some parts of Africa however, certain forms of obesity may be the socially acceptable norm. Sadly though, obesity has been associated with several morbidities including hypertension, coronary heart disease, ischemic heart disease, type II diabetes and certain cancers [2].
Hitherto, developing countries were notorious for under-nutrition and infectious diseases but cross fertilization of cultures and globalization has exposed several African societies to certain feeding habits which may result in malnutrition and hypertension both of which have further placed a heavy burden on the already stretched health care system [3,4].
Positive correlations between body mass index (BMI) and blood pressure have been demonstrated previously in a study with Caucasians5 but this relationship is of grave importance in developing countries owing to the recent rise in mortality associated with obesity and associated co-morbidities such as hypertension especially as immediate clinical care may not be readily available for critical conditions [5-6].
Considerable inter-individual variability in the blood pressure (BP) response to weight gain has been described and it was clearly outlined that obesity was not invariably associated with hypertension [7-9].
BMI has however been extensively used in determining blood pressure changes. This association has been described as been modest owing to several confounders which may require large sample sizes. Furthermore, it has been suggested that BMI may not necessarily assess percentage body fat, absolute fat mass, body fat distribution and other biologic obesity parameters.[10-12] Similarly, waist circumference (WC) has been shown to be equally as reliable as BMI in assessing blood pressure [13]. This baseline study was therefore aimed at determining the effects of some anthropometric assessors of obesity including
BMI and waist circumference (WC) on blood pressures of women in the studied population.
2. MATERIALS AND METHODS
This study was descriptive analytical study involving volunteer female undergraduates of the Delta State University, Abraka and the study was aimed at determining the effect of BMI, waist circumference (WC) on blood pressure. This prospective study involved a population of three hundred and fifty (350) undergraduate female student volunteers of Delta State University, Abraka, Delta State Nigeria, with mean ages between 18-26 years.
ETHICAL APPROVAL
Permission for this study was granted by the department of Anatomy ethics committee (Protocol number Delsu/BMS/ANA/12/13/0037) and informed consent was obtained from each volunteer before tests were conducted.
2.1 Anthropometric Measurements
Each participant was measured for height and weight. Subjects wore light clothing with exclusion of foot wears. Waist circumference measurements were obtained according to WHO guidelines midway between the uppermost border of the iliac crest and lowest border of the coastal margin [14]. The definitions for being obese or overweight were derived from the anthropometric measurement based on the calculation of body mass index (weight (kg)/height (m2)) according to WHO; Body mass index exceeding 30.0kg/m2, overweight, while normal subjects had a body mass index between 18 and 24.1 kg/m2 [15].
2.2 Blood Pressure [16]
2.3 Statistical Analysis
The results were analysed using Statistical Package for the Social Sciences, (SPSS) version 16. With this instrument, the association between body fat measurement and blood pressure was determined by Pearson’s correlation coefficient and analysis of variance applied to test differences in means between the individuals studied.
2.4 Exclusion Criteria
Individuals below eighteen (18) years, persons with known congenital heart disease, or those diagnosed with liver disease whose abdominal size would have been distorted for physiologic reasons (specifically pregnancy), were all excluded from this study.
3. RESULTS
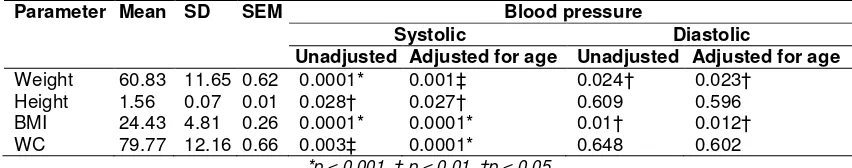
As shown in table 1, the underweight respondents constituted 6.39% of the total, overweight individuals accounted for 32.56%, while the obese were 10.76 %. Similarly BMI (kg/m2) significantly correlated with both systolic and diastolic blood pressures (p < 0.01; 0.234, 0.176) as shown in table 2. Multivariate analyses revealed that BMI more significantly affected systolic BP (P < 0.001) for both those adjusted and unadjusted for age than diastolic pressure (p < 0.05) (Table 3).
The mean waist circumferences (WC) for the entire population was 79.77 ± 12.16 (SEM 0.66) as shown in table 3. Underweight individuals had the lowest waist circumference (WC) (67.06cm) while the WC of normal subjects was 75.20cm. The WC ranged from 83.57 in the overweight subjects to 134.33cm in the class 3 obese individuals. In table 2, WC was significantly correlated with both systolic and diastolic blood pressures (p < 0.001; 0.25, 0.26) respectively. Similarly, AC showed a significant effect on both
age adjusted and age unadjusted systolic blood pressures (p < 0001) unlike for age adjusted and unadjusted diastolic blood pressures were no significance was observed (p < 0.05).
4. DISCUSSION
This study demonstrated the effects of some anthropometric parameters, (body mass index, waist and hip circumference) on blood pressures of undergraduate college students in a Nigerian University. BMI, though empirical, has been described as a most useful anthropometric assessor of obesity and some of its associated risks [1].
With the exception of about a half of the students studied, the remaining were observed to have abnormal indexes. This finding was similar to a study amongst some undergraduates in the United States were about 29% of African Americans were overweight and over 12% obese [15].
Similarly, Siminialayi et al. [16] recorded a higher prevalence of between 14-16% for obese individuals amongst two adult populations in Port-harcourt. Though both the American and Portharcourt studies recorded higher values for obese individuals especially with BMI than was recorded in the index study, this was not surprising because of the occupation of population sampled which included mainly undergraduates amongst whom young adults constituted the vast majority. A broader study encompassing several occupational areas and ages may perhaps display a similar picture as was shown in the Port-harcourt and United States.
This study further revealed that increases in BMI significantly correlated with both systolic and diastolic blood pressures irrespective of age. The findings in this study were almost identical to an
Table 1. The mean distribution table for BMI, systolic BP, diastolic BP, BMI, *AC and **HC with WHO weight classifications
WHO BMI classes % frequency Systolic
BP
Diastolic BP
BMI * WC
Under weight subjects(<18.5) 6.39 106.70 70.50 17.30 67.05 Normal subject (18.5-24.49) 50.29 111.57 71.51 22.20 75.20 Overweight subject(25-29.9) 32.56 112.28 72.92 27.00 83.57 Class 1 obese subject(30-34.9) 6.69 116.70 72.92 31.70 89.17 Class 2 obese subject (35-39.9) 3.20 124.18 77.64 37.30 96.82 Class 3 obese subject (greater than 40) 0.87 138.33 87.67 46.53 134.33
Table 2. Pearson’s correlation table for BMI, and WC with systolic/diastolic BP
Blood pressure BMI WC
Systolic 0.23* 0.25*
Diastolic 0.18* 0.26*
*Correlation is significant at the p < 0.01
Table 3. Multivariate analyses of effect of blood pressure on body fat indices
Parameter Mean SD SEM Blood pressure
Systolic Diastolic
Unadjusted Adjusted for age Unadjusted Adjusted for age
Weight 60.83 11.65 0.62 0.0001* 0.001‡ 0.024† 0.023† Height 1.56 0.07 0.01 0.028† 0.027† 0.609 0.596 BMI 24.43 4.81 0.26 0.0001* 0.0001* 0.01† 0.012† WC 79.77 12.16 0.66 0.003‡ 0.0001* 0.648 0.602
*p < 0.001, ‡ p < 0.01, †p < 0.05
earlier observation where changes in BMI were shown to be significantly correlated with both systolic and diastolic blood pressures [1]. Similarly, they recorded minimal effect of BMI on age but a higher correlation with diastolic pressure than systolic pressure unlike in the current study. The observed influence of BMI on cardiovascular function has been attributed to the function of adipose tissue which has been shown to have important endocrine functions which may be involved in production of several active substances including Leptin, Angiotensinogen amongst others, which may influence the cardiovascular system [17]. These substances have been shown to be higher in obese individuals probably creating the environment for hypertension in affected individuals [17].
In addition, it was demonstrated in this study that WC significantly correlated with both diastolic and systolic pressures respectively. Further analysis however showed a significant effect of WC on only age adjusted/unadjusted SBP unlike with DBP where the effect was not significant. This observation was not peculiar to this study as earlier observations have demonstrated that WC was related to development of several cardiovascular risk factors [18,19]. These reports also showed that even after adjusting for age, some anthropometric parameters still had maximal effects on blood pressure. The narrow age range of the individuals in the study population (undergraduates), could also have influenced the observed effects of WC on diastolic blood pressure [20].
Similar to the explanation for the effects of BMI on BP, the observed correlation between increased WC and blood pressure has been explained to occur directly in which accumulated
adipose tissue released molecules that promoted formation of both angiotensin II and aldosterone like substances which have been described to posses vasopressor and anti-natriuretic properties [21]. Involvement of local rennin-angiotensinogen system specific to adipocytic tissue has also been described [22-24]. A cross sectional study in a cohort of Brazilian men further explained that the mechanism of hypertension in individuals with metabolic syndrome (elevated BP with WC above 102cm) may have been a consequence of poor vascular compliance in the presence of elevated sympathetic tone or peripheral insulin resistance (both of which raise cardiac output by increasing peripheral resistance and blood flow respectively).20 The Bogalusa heart study indicated that WC was shown to be associated with unfavourable concentrations of insulin, triglycerides, low density lipoproteins and high density lipoproteins which clearly explained its relationship with hypertension [25-27].
4. CONCLUSION
Finally, this study has reaffirmed the usefulness of both BMI and WC in predicting hypertension and has further related age with elevated systolic blood pressure.
ACKNOWLEDGEMENT
The enormous support I received during this study especially as regards data collection, by my research assistant, Mr Chekezie Charles, is most appreciated.
COMPETING INTERESTS
REFERENCES
1. Kanavi RS, Smilee JS, Mallikarjuna PT, Vedavathi KJ, Jayarajan MP. Correlation between body mass index and cardiovascular parameters in obese and non-obese in different age groups. Int J Biol Med Res. 2011;2(2):551-555.
2. Dasgupta S, Hazra SC. The utility of waist circumference in assessment of obesity. Indian J Public Health. 1999;43(4):132-5. 3. Murray CJL, Lopez AD. Global Health
Statistics. Global Burden of Disease and Injury Series. Harvard School of Public Health: Boston, MA; 1996.
4. World Health Organization. Diet, Nutrition and the Prevention of Chronic Diseases, Report of a Joint WHO/FAO Expert Consultation. WHO Technical Report Series No. 916 World Health Organization: Geneva; 2003.
5. Stamler R, Stamler J, Riedlinger WF, Algera G, Roberts RH. Weight and blood pressure: findings in hypertension screening of 1 million Americans. JAMA. 1978;240:1607–1610.
6. MacMahon S, Cutler J, Brittain E, Higgins M. Obesity and hypertension: epidemiological and clinical issues. Eur Heart J. 1987;8(Suppl B):57–70.
7. Cassano P, Segal M, Vokonas P, Weiss ST. Body fat distribution, blood pressure, and hypertension: a prospective cohort study of men in the Normative Aging Study. Ann Epidemiol. 1990;1:33-48. 8. Roche AF, Siervogel RM. Measures of
body composition: their relationship to blood pressure and use in epidemiologic research. Ann Epidemiol. 1991;1:313–320. 9. Spiegelman D, Israel RG, Bouchard C, Willett WC. Absolute fat mass, percent body fat, and body-fat distribution: which is the real determinant of blood pressure and serum glucose? Am J Clin Nutr. 1992;55:1033-1044.
10. World Health Organisation. Global strategy on diet, physical activity and health. Bulletins of the WHO. 2006;5:16-8. 11. Bray GA. Obesity: Comparative Methods
of weight Control. Westport, Conn: Technomic Publishing 1980.
12. The multiple risk factor intervention trial group. The multiple risk factor intervention trial. Ann NY Acad Sci. 1973;304:293-308. 13. Savva SC, Tornaritis M, Savva ME,
Kourides Y, Panagi A, Silikiotou N, et al. Waist circumference and waist-to-height
ratio are better predictors of cardiovascular disease risk factors in children than body mass index. Int J Obes Relat Metab Disord. 2000;24:1453-8.
14. World Health Organisation (1989) Measuring obesity-classification and description of anthropometric data. Report on a WHO consultation of the epidemiology of obesity, Warsaw, 21-23 October 1987. World Health Organisation: Copenhagan, Denmark.
15. Lucile LA, Nwankwo M, Ukoli F, Omene J, Halie GT, Kuller LH. J Natl Med Assoc. 1990;82(8):573–576.
16. Siminnialayi, IM, Emmen-Chioma, PC and Dapper DV. The prevalence of obesity as indicated by BMI and waist circumference among Nigerian adult attending family medicine clinics as outpatients: Niger J. Med. 2008;17:340-5.
17. Hall JE, Brands MW, Hildebrandt DA. Role of sympathetic nervous system and neuropeptides in obesity hypertension. Brazilian J Med Biol Res. 2000;33(6):605-18.
18. Higgins M, Kannel W, Garrison R, Pinky J, Stokes J. Hazards of obesity- the Framingham experience, Acta Medica Scadinavia. 1988;723(Suppl):23-36. 19. Kannel WB, cupules LA, Ramaswami R,
stokes J, kreger BE, Higgins M. regional obesity and risk of CVD: the Framinghan study J Clin Epid. 1991;44:183-90.
20. Roberta SL. Cassani 1, Fernando Nobre 1, Antônio Pazin-Filho 1 and André Schmidt 1 Relationship Between Blood Pressure and Anthropometry in a Cohort of Brazilian Men: A Cross-Sectional Study. Am J Hypertens; 2009.
21. Poirier P, Eckel RH. Obesity and cardiovascular disease. Curr Atheroscler Rep. 2002;4:448-453.
22. Poirier P, Lemieux I, Mauriège P, Dewailly E, Blanchet C, Jean Bergeron J, Després J. Impact of Waist Circumference on the Relationship Between Blood Pressure and Insulin; The Quebec Health Survey. Hypertension. 2005;45:363-367
23. Karlsson C, Lindell K, Ottosson M, Sjostrom L, Carlsson B, Carlsson LM. Human adipose tissue expresses angiotensinogen and enzymes required for its conversion to angiotensin II. J Clin Endocrinol Metab. 1998;83:3925–3929. 24. Paul M, Wagner J, Dzau VJ. Gene
the polymerase chain reaction. J Clin Invest. 1993;91:2058-2064.
25. Fredman DS, Dietz WH, Srinivasan SR, Berenson GS. The relation of overweight to cardiovascular risk factors among children and adolescents: the Bogalusa Hearth Study. Pediatr (Rio J). 2004;80(1):35-40.
26. Freedman DS, Serdula MK, Srinivasan SR, Berenson GS. Relation of circumferences and skinfold thickness to
lipid and insulin concentrations in children and adolescents: the Bogalusa Heart Study. Am J Clin Nutr. 1999;69:308-17. 27. Janssen I, Katzmarzyk PT, Srinivasan SR,
Chen W, Malina RM, Bouchard C, et al. Combined influence of body mass index and waist circumference on coronary artery disease risk factors among children and adolescents. Pediatrics. 2005;115: 1623-30.
© 2015 Igho; This is an Open Access article distributed under the terms of the Creative Commons Attribution License
(http://creativecommons.org/licenses/by/4.0), which permits unrestricted use, distribution, and reproduction in any medium,
provided the original work is properly cited.
Peer-review history: