_____________________________________________________________________________________________________ (Past name: British Journal of Medicine and Medical Research, Past ISSN: 2231-0614, NLM ID: 101570965)
Bone Marrow Lymphocyte Subsets in Newly
Diagnosed Acute Myeloid Leukemia Patients and
Their Relation to Standard Prognostic Factors and
Response to Induction Therapy
Hoda Mohamed El Gendi
1, Noha Bassiouny Hassan Mostafa
1*and Marina Mounir William Labib
11Department of Clinical Pathology, Faculty of Medicine, Ain Shams University, Egypt.
Authors’ contributions
This work was carried out in collaboration between all authors. All authors read and approved the final manuscript.
Article Information
DOI: 10.9734/JAMMR/2018/46278 Editor(s): (1) Dr. Babatunde Olanrewaju Motayo, Department of Pathology, Federal Medical Center, Abeokuta, Ogun State, Nigeria and Department of Virology, College of Medicine, University of Ibadan, Ibadan, Nigeria. (2)Dr. Alex Xiucheng Fan, Department of Biochemistry and Molecular Biology, University of Florida, USA. Reviewers: (1) Ota Fuchs, Czech Republic. (2)Azza Mahmoud Kamel, Cairo University, Egypt. Complete Peer review History:http://www.sdiarticle3.com/review-history/46278
Received 21 October 2018 Accepted 02 January 2019 Published 19 January 2019
ABSTRACT
Aims: Immune responses act as a surveillance and protective system against malignant cells. Thus, the aim of this work was to study different lymphocyte subsets in bone marrow (BM)of newly diagnosed acute myeloid leukemia (AML) patients and identify their prognostic significance.
Study Design: Cohort study.
Place and Duration of Study: Hematology department of Ain-Shams University Hospital (ASUH) from July 2017 till March 2018.
Methodology: This study was conducted on 33 newly diagnosed AML patients, all were subjected to peripheral blood count and flow cytometric immunophenotyping on bone marrow (BM) blasts (using acute leukemia panel in addition to monoclonal antibodies to detect different BM lymphocyte subsets); whereas cytogenetic studies using fluorescence in situ hybridization (FISH) technique were performed to determine risk groups. The patients’ remission status following induction therapy (day28) was determined.
Results: Natural killer (NK) cells were relatively elevated (median 15.9%) in t (15:17), while the median percentage of T- cytotoxic (Tc) [43.5%], T-helper (Th) [39.5%] and NK-T cells [39.9%] were
higher in t (8:21). Percentage of BM total lymphocytes showed a significant negative correlation with both total leukocyte count (r=-0.645, p<0.001) and percentage of BM blasts (r=-0.348, p=0.047), with positive correlation with platelet count (r=0.42, p=0.015). A numeric cutoff of 5% and 48% for both total BM lymphocytes and T-cytotoxic cells, respectively were associated with good response to induction.
Conclusion: Total BM lymphocytes and their subsets in BM of newly diagnosed AML patients were different from normal values. High total BM lymphocytes, T-helper, cytotoxic and B-cells were associated with complete remission to induction therapy.
Keywords: Acute myeloid leukemia (AML); Fluorescence in situ hybridization (FISH); Natural killer (NK); lymphocyte subsets.
1. INTRODUCTION
Acute myeloid leukemia (AML) represents a group of clonal hematopoietic stem cell disorders with uncontrolled proliferation and accumulation of myeloblasts [1]. The discovery of new prognostic and predictive markers is mandatory to improve prognostication and help inventing novel therapeutic strategies. Immune responses act as a surveillance and protective system against malignant cells for their eradication [2]. Concerning the role of different immune cells in many neoplasms; both natural killer (NK) cells and CD8+ T-cytotoxic (Tc) act by their cytolytic activities in elimination of neoplastic cells, while B-cells act by releasing anti-tumor antibodies and other inhibitory effects [3].
The proportions of various immune cells in the bone marrow (BM) vary in different types of myeloid neoplasms and their relative numbers at diagnosis may correlate with prognosis [4]. In AML, many researchers have focused on the immunophenotypic and genetic aberrations of neoplastic cells, lacking behind the surrounding non-neoplastic immune system cells, therefore a particular focus has been placed on NK cells, identifying functional links between NK cell activity and AML prognosis; likewise T-cells have been shown to be critical players in AML progression [5,6]. Thus understanding the different lymphocyte subsets at beginning of AML
is critical for development of new
immunotherapeutic strategies. Therefore in this study, we aimed to study different lymphocyte subsets in BM of newly diagnosed AML patients and their relation to standard prognostic factors and response to induction therapy.
2. MATERIALS AND METHODS
2.1 Patient Cohort
The present study was conducted on thirty-three newly diagnosed AML patients presented to
hematology department of Ain-Shams University Hospital (ASUH) from July 2017 till March 2018. This study was approved by the ethical committee of faculty of medicine Ain-Shams University, An informed consent was taken from all subjects participating in this study. Their ages ranged from 19-81 years with a mean of 41 years, eighteen were males and fifteen were females. All patients were subjected to full
medical history and thorough clinical
examination, the diagnosis of AML was established following the WHO classification [7]. In all cases, a retrospective review of their hemogram data, peripheral blood smears, bone marrow aspirates, results of flow-cytometric immunophenotyping and cytogenetic analysis (FISH) in selected cases for risk group stratification. Clinical follow up was done for all studied patients to detect response to induction therapy at day 28. Patients were treated with cytarabine and daunorubicin or idarubicin, with the exception of AML with t (15; 17) (q24; q21); PML/RARA who all received all-Trans retinoic acid [8].
2.2 Multiparametric Flow Cytometry
Flow cytometry (FCM) was performed on (1 ml EDTA) BM samples by NAVIOS 2 laser 6 color FCM [Beckman coulter, USA]. The acute leukemia panel of fluorescein isothiocyanate
(FITC)/ Phycoerythrin (PE) - conjugated
monoclonal antibodies (Beckman coulter, life science, Hielach, USA) were used for diagnosis and sub-classification of AML. Sample was considered positive for any marker if ≥20% of cells were expressing it, except for CD34 and MPO if only ≥10%. Gating was done on the residual normal BM lymphocyte population based on forward and side scatters and their bright expression of CD45. Those gated lymphocytes were analyzed for the percentages of CD3 + (PC5) CD4+ (FITC) [T-helper], CD3+(PC5)CD8+
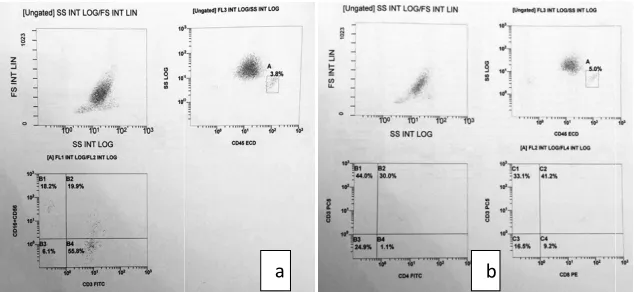
Fig. 1. Scatter blot Flow cytometric analysis gating done on BM lymphocytes according to forward (FS) versus side scatter (SS) and CD45 versus SS (a) CD3/CD16CD56 (b) CD3CD4 /
CD16+CD56+(PE) [NK-T], CD3
CD16+CD56+(PE) [NK] and CD19+(PE)
CD20+(FITC) [B-cells] (Fig.1).
2.3 Cytogenetic Studies
FISH analysis was performed on BM samples collected on Li-heparin tubes; at least 100 interphase nuclei were scanned for the detection
of the signals by cytovision automated
cytogenetis platform [Leica Biosystems
Richmond, USA]. The used probes were Vysis
RUNX1/RUNX1T1 double fusion probe,
PML/RARA single fusion and BCR/ABL single fusion probe. A cut off value for diagnosis of positive results was > 10% for single fusion probe and >3% for double fusion probe. This research did not receive any specific grant from funding agencies in the public, commercial, or not for profit sectors.
2.4 Statistical Analysis
In addition to descriptive analysis, data was analyzed using SPSS version 20 (international business machines corporation, New York, 2010) statistical package, for analytical statistics; Mann Whitney test, Kruskal Wallis test, Fisher’s exact test, correlation analysis (using spearman’s method) were used in addition to logistic multi regression analysis and a receiver operating characteristic (ROC).
3. RESULTS AND DISCUSSION
3.1 Clinical Cohort
Patients were classified by WHO 2016
classification as AML with recurrent genetic
Scatter blot Flow cytometric analysis gating done on BM lymphocytes according to forward (FS) versus side scatter (SS) and CD45 versus SS (a) CD3/CD16CD56 (b) CD3CD4 /
CD3CD8 expression
T],
CD3-CD16+CD56+(PE) [NK] and CD19+(PE)
FISH analysis was performed on BM samples heparin tubes; at least 100 interphase nuclei were scanned for the detection
the signals by cytovision automated
cytogenetis platform [Leica Biosystems
Richmond, USA]. The used probes were Vysis
RUNX1/RUNX1T1 double fusion probe,
PML/RARA single fusion and BCR/ABL single fusion probe. A cut off value for diagnosis of lts was > 10% for single fusion probe and >3% for double fusion probe. This research did not receive any specific grant from funding agencies in the public, commercial, or
In addition to descriptive analysis, data was analyzed using SPSS version 20 (international business machines corporation, New York, 2010) statistical package, for analytical statistics; Mann Whitney test, Kruskal Wallis test, Fisher’s exact ion analysis (using spearman’s method) were used in addition to logistic multi-regression analysis and a receiver operating
RESULTS AND DISCUSSION
Patients were classified by WHO 2016
classification as AML with recurrent genetic
(RGA) abnormalities (11 of 33; 33.3%), AML not otherwise specified (NOS) (19 of 33; 57.6%) and AML with myelodysplastic related changes (MRC) (3 of 33; 9.1%). Patients were f grouped according to response to induction therapy into responders (11 of 33; 33.3%) and non-responders (22 of 33; 66.7%). Other clinical
and laboratory data are summarized in
(Tables 1-2).
3.2 Lymphocyte Subsets in AML Patients
Total BM lymphocytes percentage (by FCM) in the studied AML patients ranged from 1 with a median of 4.9%; of which the mean of NK cells’ percentage was 12.43% and that for NK
Th and Tc were 20%, 34.6% and
39.8%,respectively while the median of B cel was 2%. Although there was no statistically significant difference between different AML subtypes and both total BM lymphocytes percentage and their different subsets, but it seemed that B cells percentage was higher in AML-RGA especially in t (8; 21) with a median of 12%.
NK cells in t (15;17) showed their highest percentages (median 15.9%), NK
percentage was increased in t(8;21), FAB M4 and M5 with a median of 40% and 25% respectively. T-helper cells’ percentage was increased in t(8;21), 11q23 rearrangement and AML-MRC with median value of 39.5%, 35% and 40%, respectively. T-cytotoxic cells showed higher percentages among all AML patients in comparison to other lymphocyte subsets in contrast to B-cells that showed the lowest percentage (Fig. 2).
a b
Scatter blot Flow cytometric analysis gating done on BM lymphocytes according to forward (FS) versus side scatter (SS) and CD45 versus SS (a) CD3/CD16CD56 (b) CD3CD4 /
(RGA) abnormalities (11 of 33; 33.3%), AML not otherwise specified (NOS) (19 of 33; 57.6%) and AML with myelodysplastic related changes (MRC) (3 of 33; 9.1%). Patients were further grouped according to response to induction therapy into responders (11 of 33; 33.3%) and responders (22 of 33; 66.7%). Other clinical
and laboratory data are summarized in
3.2 Lymphocyte Subsets in AML Patients
Total BM lymphocytes percentage (by FCM) in the studied AML patients ranged from 1-46% with a median of 4.9%; of which the mean of NK cells’ percentage was 12.43% and that for NK-T,
Th and Tc were 20%, 34.6% and
39.8%,respectively while the median of B cells was 2%. Although there was no statistically significant difference between different AML subtypes and both total BM lymphocytes percentage and their different subsets, but it seemed that B cells percentage was higher in ith a median of
Table 1. Clinical data of the thirty-three newly diagnosed AMLpatients
Clinical Parameter Range (Mean ± SD)/
Number(percentage)
Age (years) 19-81 (41.45 ± 17)
Gender Male 18 (54.5%)
Female 15 (45.5%)
AML subtypes NOS
N=19 (57.6%)
M1 5 (15.2%)
M2 10 (30.3%)
M4 3 (9.1%)
M5 1 (3.0%)
RGA
N=11 (33.3%)
t (15; 17) 6 (18.2%)
t (8; 21) 2 (6.1%)
11q23 rearrangement 2 (6.1%)
inv(16) 1 (3.0%)
MRC 3 (9.1%)
Cytogenetic risk group Favorable 9 (81.8%)
Unfavorable 2 (18.2%)
Response to induction therapy
Complete remission 11 (33.3%)
Partial remission 6 (18.2%)
Death 16 (48.5%)
RGA: recurrent genetic abnormalities, NOS: not otherwise specified, MRC: myelodysplasia related changes
Table 2. Laboratory data of the thirty-three newly diagnosed AML patients
Laboratory Parameter Range [(Mean ± SD) or (Median IQR)*]
Hematological Parameters TLC (x 109/L) 0.8-327 [24 (4-44)]*
Hb (g/dL) 4.8 - 12.1 (8.03 ± 1.9)
PLT (x 109/L) 6 - 119 (36.55 ± 32)
Peripheral Blast (%) 0-96 (67.21 ± 25.28)
BM blast (%) 40-99 (76.42 ± 17.8)
Total lymphocytes in BM by FCM (%) a 1-46 [4.95 (3-7.4)]*
Lymphocyte subsets NK cells (%) 1-35 (12.43 ± 8.85)
NK-T cells (%) 3 - 57 (20.01 ± 13.55)
T-helper cells (%) 18-77 (34.61 ± 14.63)
T-cytotoxic cells (%) 19-73 (39.84 ± 12.93) [41 (30.6- 48.1)]*
B cells (%) 1-35 [2 (1-7)]*
a
Total BM lymphocyte percentage is out of the total BM cells and lymphocyte subsets percentages are out of the BM lymphocytes.TLC: total leukocytic count, Hb: hemoglobin, PLT: platelets, BM: bone marrow, NK: natural killer
cells, NK-T cells: natural killer T cells, SD: standard deviation, *IQR: interquartile range.
3.3 Lymphocyte Subsets and
Relationship to Different Parameters and Prognosis
There was a significant negative correlation between percentage of BM total lymphocytes and both total leukocytic count (TLC) (r = -0.645, p<0.001) and BM blasts percentage (r= - 0.34, p=0.047), while a significant positive correlation was found with the platelet count (r= 0.42, p<0.001). B cells showed weak negative correlation with patients’ age (r= 0.34, p=0.025) (Table 3). Comparing responders and non-responders to induction therapy, the TLC and BM
blasts were significantly higher in
non-responders group (p<0.001 & p= 0.047),
although no statistically significant difference was found in different lymphocyte subsets in both
groups, the percentages of total BM
lymphocytes, NK-T, Tc and B-cells were higher in responders than non-responders (Table 4). On performing multiple logistic regression analysis, it revealed that Th, Tc and B cells together were significantly higher in responders (p=0.026), also both low BM blast cells percentage and high total
BM lymphocytes percentage associated
the best cut off value for discrimination was 48% (Table 5; Fig. 3).
3.4 Discussion
Many researches in AML has focused on
understanding the immunophenotypic and
genetic aberrations of neoplastic cells, resulting in better risk- stratification but still the treatment modalities does not change [9]. In this context, the role of the surrounding non
immune system cells has gained increasing interest in AML. Our study of different lymphocyte subsets in 33 newly diagnosed AML patients revealed a median total BM lymphocytes
Fig. 2. Lymphocyte subsets in different AML main subtypes (y lymphocytes. NK-T, T-helper and T
myelodysplastic related changes)
Table 3. Correlation between bone marrow lymphocyte subsets and clinical and laboratory parameters in 33 acute myeloid leukemia patients
Parameter Total lymphocytes %
Age (years) rs 0.15
p value 0.41
TLC (x 109/L) rs -0.645
p value <0.001*
Hb (g/dL) rs 0.21
p value 0.25
PLT (x 109/L) rs 0.42
p value 0.015*
Peripheral blast %
rs -0.199
p value 0.351
BM blast % rs -0.348
p value 0.047*
rs: Spearman rank correlation coefficient, Asterisk indicates P the best cut off value for discrimination was 48%
Many researches in AML has focused on
understanding the immunophenotypic and
genetic aberrations of neoplastic cells, resulting stratification but still the treatment modalities does not change [9]. In this context, the role of the surrounding non-neoplastic s has gained increasing interest in AML. Our study of different lymphocyte subsets in 33 newly diagnosed AML patients revealed a median total BM lymphocytes
percentage of about 5% which were lower than previously reported normal percentages of 15.6%, 10 and 15.1% [10,11,4]. This could be explained by BM infiltration with the hostile microenvironment created by AML. The mean value of NK-T cells was 20%, higher than normal values (11%) reported by Aggarwal et al
was suggested to be a compensation f deficient CD1d molecule [12], however, this increase was not found to prevent disease progression due to lack of their cytotoxic function. In our study the B-cells showed the lowest percentages (2%) among all other lymphocyte subsets compared to the
of 6.5% and 12.5% reported in AML [11,13].
Fig. 2. Lymphocyte subsets in different AML main subtypes (y-axis indicates percentages of all helper and T-cytotoxic cells’ percentages were highest in
myelodysplastic related changes)
Correlation between bone marrow lymphocyte subsets and clinical and laboratory parameters in 33 acute myeloid leukemia patients
Total lymphocytes NK cells %
NK-T cells %
T-helper cells %
T-cytotoxic cells %
0.24 0.02 -0.032 -0.21
0.18 0.92 0.859 0.24
0.241 -0.233 -0.005 -0.005
0.176 0.192 0.978 0.978
-0.23 0.13 0.212 0.04
0.20 0.47 0.236 0.82
-0.27 -0.15 0.271 -0.25
0.12 0.42 0.127 0.16
0.292 -0.256 -0.132 -0.239
0.166 0.227 0.464 0.262
0.200 -0.142 -0.071 -0.262
0.265 0.431 0.695 0.141
rs: Spearman rank correlation coefficient, Asterisk indicates P-value <0.05.
percentage of about 5% which were lower than previously reported normal percentages of 4]. This could be explained by BM infiltration with the hostile microenvironment created by AML. The mean T cells was 20%, higher than normal values (11%) reported by Aggarwal et al. [4], that was suggested to be a compensation for the deficient CD1d molecule [12], however, this increase was not found to prevent disease progression due to lack of their cytotoxic cells showed the lowest percentages (2%) among all other lymphocyte subsets compared to the mean value of 6.5% and 12.5% reported in AML [11,13].
axis indicates percentages of all cytotoxic cells’ percentages were highest in AMLwith
Correlation between bone marrow lymphocyte subsets and clinical and laboratory
cytotoxic B cells %
Table 4. Comparison between responders and non
patients regarding clinical, laboratory parameters and lymphocyte subsets
Parameters Responders
(complete remission) N=11
Age (years) 37 (24
TLC (x 109/L) 9 (4-24)
Hb (g/dL) 9 (7-10)
PLT (x 109/L) 29 (19
Peripheral blast % 6 (0-77)
BM blast % 70 (52
Total Lymphocytes % in BM 6.75 (5
NK cells % 9.4 (5.2
NK-T cells % 19.2 (10.7
T-helper cells % 32 (23
T-cytotoxic cells % 43.8 (36.6
B cells % 4 (1 -
a
Mann whitney test, Asterisk indicates P
significant, S: significant, IQR: interquartile range, TLC: BM: bone marrow, NK: natural killer cells, NK
Table 5. Best cut-off value of lymphocyte subsets for the prediction of non acute myeloid leukemia patients
Parameters AUC
Total lymphocytes % in BM 0.709
T-cytotoxic cells % 0.671
Asterisk indicates P-value <0.05, AUC: area under the curve, Sig.: significance, NS: non
Fig. 3. ROC curve analysis for discriminating responders from non therapy in 33 acute myeloid leukemia patients
a) BM total lymphocytes percentage
In this study, although there was no statistically
significant difference between lymphocyte
subsets in all AML subtypes. However NK cells were relatively higher in those with t(15;17)
Comparison between responders and non-responders in 33 acute myeloid leukemia patients regarding clinical, laboratory parameters and lymphocyte subsets
Responders
(complete remission) Median (IQR)
Non-responders (partial remission and death) N=22 Median (IQR)
p value
37 (24-50) 39.5 (28-57) 0.276
24) 39 (11.5-93.5) 0.028*
10) 8 (6-9) 0.072
29 (19-35) 19.5 (13-53.5) 0.528
77) 67 (29.5- 87.75) 0.067
70 (52-76) 87.5 (75- 94.25) 0.003*
6.75 (5 - 7.5) 4.08 (2.35 - 6) 0.054
9.4 (5.2 - 12.6) 12.4 (5.2 - 18.2) 0.390
19.2 (10.7 - 32.2) 13.75 (7.2 - 27.9) 0.222
32 (23 - 41) 31.3 (25 - 40) 0.674
43.8 (36.6 - 55.2) 39.3 (27.5 - 43.3) 0.113
14) 1 (1 - 5) 0.068
Mann whitney test, Asterisk indicates P-value <0.05, N= number of patients, Sig.: significance, NS: non significant, S: significant, IQR: interquartile range, TLC: total leukocytic count, Hb: hemoglobin, PLT: platelets,
BM: bone marrow, NK: natural killer cells, NK-T cells: natural killer T cells.
off value of lymphocyte subsets for the prediction of non-responders in 33 acute myeloid leukemia patients
95% Cl p value Sig. Cutoff point Sensitivity
0.525-0.853 0.028* S 4.95 68.18
0.487-0.824 0.116 NS 48.3 90.91
value <0.05, AUC: area under the curve, Sig.: significance, NS: non-significant, S: significant, BM: bone marrow
for discriminating responders from non-responders to induction therapy in 33 acute myeloid leukemia patients
a) BM total lymphocytes percentage (b) T-cytotoxic cells percentage
In this study, although there was no statistically
significant difference between lymphocyte
subsets in all AML subtypes. However NK cells were relatively higher in those with t(15;17)
versus other AML-RGA, the same as reported by Alcasid et al. [14] and Ismail and Abdulateef [13]; this could be related to special compensatory mechanisms from the immune system to
a b
responders in 33 acute myeloid leukemia patients regarding clinical, laboratory parameters and lymphocyte subsets
p valuea Sig
0.276 NS
0.028* S
0.072 NS
0.528 NS
0.067 NS
0.003* S
0.054 NS
0.390 NS
0.222 NS
0.674 NS
0.113 NS
0.068 NS
0.05, N= number of patients, Sig.: significance, NS: non-leukocytic count, Hb: hemoglobin, PLT: platelets,
responders in 33
SensitivitySpecificity
81.82 45.45 significant, S:
responders to induction
overcome immune escape from T-cell. The percentages of Tc, Th and NK-T cells were relatively higher in t(8;21) cases versus other AML-RGA, Previous researches focused on
detailed relation of RUNX1 gene on T-cell
development [15-17]. NK-T and NK cells were found to be relatively higher in FAB M4/M5 than other AML-NOS subtypes, which could be attributed to the frequent association of CD56 with FAB M5, also in addition to uniform expression of CD1d antigen by the monocytes and myelomonocytic leukemic cells [18].
In our study, AML with MRC showed a lower percentage in B-cells with highest median percentages in Th and Tc, a finding not matching with the fact that AML-MRC is of poor prognosis [19]. However investigation for NPM and bi-allelic
CEBPA is essential to exclude those specific
groups that have a more favorable prognosis, unfortunately, no molecular studies were done to our patients.
On correlating different lymphocytes subsets with different hematological parameters, we found that the total BM lymphocytes percent showed a negative correlation with TLC and BM blast percentage and a positive correlation with platelet count. Those parameters were of prognostic value in AML patients as reported by Greer et al. [20]. This assumes that high total BM lymphocytes percentage is correlated to good prognosis that was shown in our results where total lymphocytes percentage was apparently higher in the group who achieved complete remission. We additionally identified that a numeric cut off of 5% for total BM lymphocytes and 48% for Tc were associated with good response to induction; Ismail and Abdulateef [13] reported an elevated T-cell percentage in
responder group, they considered these
lymphocytes an effective frontline in the host’s immune response to leukemic blasts.
4. CONCLUSION
Total BM lymphocytes and their subsets in BM of newly diagnosed AML patients were different from normal values reported in the literatures. High total BM lymphocytes, T-helper, cytotoxic and B-cells were associated with complete remission to induction therapy.
CONSENT
Informed consents were taken from all subjects participating in this study.
ETHICAL APPROVAL
This study was approved by the ethical committee of faculty of medicine Ain-Shams University.
ACKNOWLEDGEMENTS
We would like to thank Dr. Mostafa El-Shahed for his help in the statistics of the study
COMPETING INTERESTS
Authors have declared that no competing interests exist.
REFERENCES
1. Kupsa T, Horacek JM, Jebavy L. The role of adhesion molecules in acute myeloid leukemia and (hemato) oncology: A systematic review. Biomed Pap Med Fac Univ Palacky Olomouc Czech Repub. 2015;159(1):1-11.
2. Swann JB, Smyth MJ. Immune
surveillance of tumors. J Clin Invest. 2007; 117(5):1137–1146.
3. Hansen MH, Nielsen H, Ditzel HJ. The
tumor-infiltrating B cell response in
medullary breast cancer is oligoclonal and directed against the autoantigen actin exposed on the surface of apoptotic cancer cells. Proc Natl Acad Sci USA. 2001; 98(22):12659-12664.
4. Aggarwal SH, Swerdlow SP, TenEyck SP,
Boyiadzis M, Felgar RE. Natural killer cell
(NK) subsets and NK-like T-cell
populations in acute myeloid leukemias
and myelodysplastic syndromes.
Cytometry B Clin Cytom. 2016;90B:349– 357.
5. Le Dieu R, Taussig DC, Ramsay AG,
Mitter R, Miraki-Moud F, Fatah R, et al. Peripheral blood T cells in acute myeloid leukemia (AML) patients at diagnosis have abnormal phenotype and genotype and form defective immune synapses with AML blasts. Blood. 2009;114:3909–16.
6. Guo W, Xing C, Dong A, Lin X, Lin Y, Zhu
B, et al. Numbers and cytotoxicities of CD3+CD56+ T lymphocytes in peripheral blood of patients with acute myeloid leukemia and acute lymphocytic leukemia. Cancer Biol Ther. 2013;14:916–21.
7. Vardiman JW, Thiele J, Arber DA,
Organization (WHO) classification of myeloid neoplasms and acute leukemia: Rationale and important changes. Blood. 2009;114(5):937-951.
8. [Anonymous]. National comprehensive
cancer network. NCCN clinical practice guidelines in oncology: Acute myeloid leukemia.
Available:www.nccn.org/professionals/phy sician_ gls/pdf/aml.pdf
9. Ohgami RS, Chisholm KM, Ma L, Arber
DA. E-cadherin is a specific marker for erythroid differentiation and has utility, in combination with CD117 and CD34, for enumerating myeloblasts in hematopoietic neoplasms. Am J Clin Pathol. 2014; 141(5):656-664.
10. Brooimans RA, Kraan J, Van Putten W,
Cornelissen JJ, Löwenberg B, Gratama
JW. Flow cytometric differential of
leukocyte populations in normal bone marrow: Influence of peripheral blood contamination1. Cytometry B Clin Cytom. 2009;76(1):18-26.
11. Anagnostou D. Janus-Faced Lymphoid
Infiltrates. In: Anagnostou D and Matutes E (Eds.), Bone marrow lymphoid Infiltrates: Diagnosis and Clinical Impact, 2nd ed. Springer, London. 2012;113-144. Chapter 8.
12. Guo W, Dong A, Xing C, Lin X, Pan X, Lin
Y, et al. CD1d levels in peripheral blood of patients with acute myeloid leukemia and acute lymphoblastic leukemia. Oncol Lett. 2014;8(2):825-830.
13. Ismail MM, Abdulateef NA. Bone marrow
T-cell percentage: A novel prognostic indicator in acute myeloid leukemia. Int J Hematol. 2017;105(4):453-464.
14. Alcasid M, Ma L, Gotlib JR, Arber DA,
Ohgami RS. The clinicopathologic
significance of lymphocyte subsets in
acute myeloid leukemia. Int J Lab Hematol. 2017;39(2):129-136.
15. North TE, Stacy T, Matheny CJ, Speck NA,
Bruijn de MF. Runx1 is expressed in adult mouse hematopoietic stem cells and differentiating myeloid and lymphoid cells, but not in maturing erythroid cells. Stem Cells. 2004;22(2):158-168.
16. Yamagata T, Maki K, Mitani K.
Runx1/AML1 in normal and abnormal hematopoiesis. Int J Hematol. 2005; 82(1):1.
17. Wong WF, Kohu K, Nagashima T,
Funayama R, Matsumoto M, Movahed E, et al. The artificial loss of Runx1 reduces the expression of quiescence-associated
transcription factors in CD4+ T
lymphocytes. Mol Immunol. 2015;68(2): 223-233.
18. Metelitsa LS, Weinberg KI, Emanuel PD,
Seeger RC. Expression of CD1d by myelomonocytic leukemias provides a target for cytotoxic NKT cells. Leukemia. 2003;17(6):1068.
19. Arber DA, Brunning RD, Orazi A, Bain BJ,
Porwit A, Le Beau MM, et al. Acute myeloid leukaemia with myelodysplasia-related changes In: Swerdlow SH, Campo E, Harris NL, Jaffe ES, Pileri SA, Stein H and Thiele J (Eds.), WHO classification of tumours of haematopoietic and lymphoid tissues, 4th ed. International Agency for Research on Cancer (IARC), France. 2017;150-152. Chapter 8.
20. Greer J, Baer M, Kinney M. Acute myeloid
leukemia in adults. In: Greer JP, Foerster J, Rodgers GM, Paraskevas F, Glader B, Arder DA, Means RT (Eds.), Wintrobe’s clinical hematology, 12th ed. lippincott
williams and wilkins, Philadelphia, USA. 2009;1843-1888. Chapter 79.
_________________________________________________________________________________ © 2018 Gendi et al.; This is an Open Access article distributed under the terms of the Creative Commons Attribution License (http://creativecommons.org/licenses/by/4.0), which permits unrestricted use, distribution, and reproduction in any medium, provided the original work is properly cited.
Peer-review history: