_____________________________________________________________________________________________________ *Corresponding author: E-mail: [email protected];
(Past name: British Journal of Medicine and Medical Research, Past ISSN: 2231-0614, NLM ID: 101570965)
Nonlinear Analysis Using Multiple Cutoff
Frequencies for Local Cerebral Blood Flow during
Biofeedback Training
Toru Tanimura
1, Daisuke Iida
1, Yusuke Jono
1, Masumi Takada
2*,
Yasuyuki Matsuura
1and Hiroki Takada
11Graduate School of Engineering, University of Fukui, 3-9-1 Bunkyo, Fukui, Fukui 910-8507, Japan. 2
Yokkaichi Nursing and Medical Care University, 1200 Kayou-cho, Yokkaichi, Mie 512-8043, Japan.
Authors’ contributions
This work was carried out in collaboration between all authors. All authors read and approved the final manuscript.
Article Information
DOI: 10.9734/JAMMR/2018/45371 Editor(s): (1) Dr. E. Umit Bagriacik, Department of Immunology, Gazi University, Turkey. Reviewers: (1) José Jamacy De Almeida Ferreira, Federal University of Paraíba, Brazil. (2)Luis Rafael Moscote-Salazar, Universidad de Cartagena, Colombia. Complete Peer review History:http://www.sciencedomain.org/review-history/28145
Received 07 October 2018 Accepted 16 December 2018 Published 05 January 2019
ABSTRACT
Biofeedback (BF) is expected not only as a means for gaining control of bodily processes to increase relaxation, relieve pain and improve health, but also to develop and improve the brain's body control function. The aim of the biofeedback training (BFT) is to promote the recovery and the development of physical dysfunctions under consciousness. A BF instrument has three tasks. First is to monitor (in some way) a physiological process of interest. Second is to measure (quantify) what is monitored. Third is to present what is monitored or measured as meaningful information. One technique for non-invasive measurement of brain activity that has been developed in recent years is brain functional imaging using near-infrared spectroscopy (NIRS). Compared to other techniques of measurement of brain activity, NIRS is a low-restraint and non-invasive measuring technique. In addition, it enables a user to take electrophysiological measurements such as Electromyography and Electrocardiography during training activity or other movements. In recent years, NIRS has a high profile for investigations of the relationship between physical control and brain function.
Tanimura et al.; JAMMR, 28(6): 1-12, 2018; Article no.JAMMR.45371
Here, we investigated the connection between BFT and local cerebral blood flow, by performing cranial NIRS with simultaneous electromyogram (EMG), recording from the rectus femoris muscle. Our results suggest that We have succeeded in findings of the nonlinearity for hemodynamics in the cerebral blood flow on the frontal lobe during the muscle contraction and the post-rest.
Keywords: Biofeedback training; kicking action; electromyography; cerebral blood flow; near-infrared spectroscopy; mental training; non-linear; low-pass filter; cut-off frequency.
1. INTRODUCTION
The electromyogram (EMG) is frequently used to monitor motion and muscle performance during biofeedback (BF) training (BFT)Pioneered by Jacobson at Harvard University in 1908, the use of BF techniques resulted in the progressive muscle relaxation technique [1].
Indeed, progressive muscle relaxation is used to control anxiety and is thought to encourage self-care and enhance overall health [2]. Jacobsen (1938) worked to develop progressive muscle relaxation as an effective behavioural technique for the alleviation of neurotic tensions and many functional medical disorders. Crude electromyographic equipment was used to monitor the levels of muscle tension in his patients during the course of treatment. The classification of and historical perspective on biofeedback applications can be found in reports by Gatchel and Price (1979), Gaarder and Montgomery (1981), and Basmajian (1989) et al. Comprehensively reviews the applications and historical perspectives of BF, which are beyond the scope of this discussion [3-5]. BFT is not only a technique used for enhancing health, but is predicted to affect the development and maintenance of brain function [6,7]. The connection between BFT and brain function surely will garner further attention in future, as current studies state that BFT involves not only voluntary movement of the extremities and joints, but receives input from high-level integrative functions of the brain.
Recently, it has been shown that hip flexor muscles used to bend the hip joint when walking, rapidly reduce in mass with age. Hip joint flexors include the femoral rectus and abdominal muscles, which have been implicated as being related to falls in elderly people. Brain blood flow in the cerebrum is easy to contain the artifacts such as physical exercise and cardiovascular activity. Therefore, subjects should seat in order to evaluate the effect of local exercise in this study. We herein examined the average rectified sEMG of the femoral rectus muscles performed
during the BFT of the dominant leg. BF techniques allow subjects to observe EMG signals or signal-derived outputs in order to encourage self-control of a specific muscle. This technique has been used to develop a technique for the “local exercise” of muscles including the femoral rectus, thus contributing to fall prevention and health enhancement in the elderly. Instruction is frequently provided using a visual or auditory signal.
One technique for non-invasive measurement of brain activity that has been developed in recent years is brain functional imaging using near-infrared spectroscopy (NIRS). With developments such as the miniaturization of diagnostic equipment, brain science is developing rapidly and a variety of brain activities are being defined [8-20].
NIRS requires the subject to be restrained to a lesser degree than with other techniques, such as functional magnetic resonance imaging (fMRI) and positron emission tomography (PET) [21-23].
then detect light that is scattered and reflected by the cerebral cortex.
Blood contains two types of hemoglobin, namely oxygenated hemoglobin (Oxy-Hb) that is bound to oxygen and deoxygenated hemoglobin (Deoxy-Hb) that is not bound to oxygen and the absorption spectra differs for both [24]. The present study uses this characteristic to measure Oxy-Hb concentration (Co) and Deoxy-Hb concentration (Cd) using the continuous wave (CW) method, based on the attenuation of detected light versus the intensity of the near infrared light reflection at two wavelengths, λ1
and λ2. The CW method is based on the modified
Lambert-Beer (MLB) method and measures the concentration change from the start of recording multiplied by the optical path [24,26]. This method is useful as the human body scatters light strongly, meaning the direct optical path from emission to detection cannot be reliably measured and therefore, obtained values do not represent absolute Hb levels.
Measurements using NIRS assume
neurovascular coupling in the same way as other measuring techniques [26]. Neurovascular coupling in the brain refers to blood vessels dilating near active nerves, in order that arterial blood that contains high levels of oxygen and glucose can be supplied, with associated changes in Oxy-Hb and Deoxy-Hb [27]. Additionally, active states in brain regions can be estimated by measuring changes in cerebral blood flow. In fact, it has been demonstrated that localized Hb increase and decrease (Co, Cd) reflect cerebral activity [28,29].
In brain activity measurements using NIRS, the prefrontal cortex (related to working memory, control of attention, cognition and emotion) and the premotor cortex (related to planning and preparing for motion) are activated during low-load “full-body movement” (e.g. walking) [30]. In fact, studies report that cognitive function in elderly people is improved through walking exercise [31]. Furthermore, previous work by the authors demonstrated the possibility that specific“ local movement” (masticatory movement in this case) stimulates activity of the prefrontal cortex [32].
In the present study, measurements were taken from the femoral rectus using EMG and NIRS simultaneously for healthy young subjects, whose physiological properties are not markedly different from those of healthy elderly subjects, to reveal the effect of BFT on the brain and in
particular the prefrontal cortex. In addition, the effect of BFT exercise tasks on local cerebral blood flow was investigated.
2. MATERIALS AND METHODS
2.1 Participants
Biometric data were obtained for the femoral rectus muscle in ten healthy young individuals (24.7 ± 4.5 year) with no abnormalities in the extremities and no past medical history of ear or nervous system disease. All subjects were about average size, and their body mass index (BMI) distributed from 18 to 25 kg/m2. The experiment was fully explained to the subjects beforehand, and written consent was obtained. The experiment was approved by the Ethics Committee of Department of human and artificial intelligent systems, Graduate School of Engineering University of Fukui (No.2).
2.2 Materials
Surface EMG tests were performed by connecting an EMG transformation box (AP-U027, TEAC Co., Tokyo) to a commercially available portable multi-purpose bio-signal amplifier-embedded collection device (Polymate AP1532, TEAC Co., Tokyo) and by using dedicated bipolar EMG electrodes with pre-amps(20 dB). Also, AP Monitor is a software to show the teacher signal of the BFT and simultaneously smoothed sequences of the EMG for subjects. Furthermore, an AP Monitor (NoruPro, Tokyo) was used to obtain PC recordings at a 2 kHz sampling frequency to show muscle activity to the subjects in real time. Subjects were given full explanations prior to undergoing the tests and consent was obtained in writing.
2.3 Procedure
The following outline summarizes the experimental process:
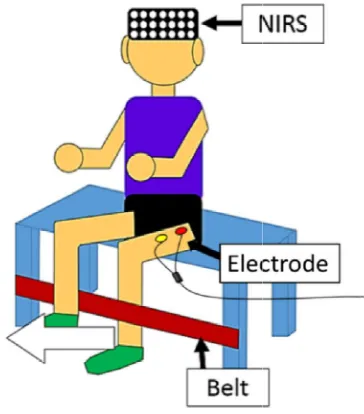
Step 1: Subjects were asked to sit back on a chair (with four fixed legs) and to kick with their dominant leg against a belt, attached to the lower part of the chair (Fig. 1).
EMG was calculated for this period of muscle contraction and muscular activity corresponding to α=75% (third quartile) of maximum voluntary contraction was then estimated.
Fig. 1. Biofeedback training experiment for rectus femoris muscle.
Step 3: Muscular activity corresponding to α% of maximum voluntary contraction was shown to the subject as the instruction signal and five cycles of intermittent signals were provided for 40 seconds of contraction (gradual build-up during the first 20 seconds), hereafter referred to as the “transient period (TP)”, followed by 20 seconds of constant muscle activity, hereafter referred to as the “muscle contraction period (MCP)” and then 40 seconds of relaxation (the first 20 seconds are referred to as the pre-rest and the last 20 seconds as post-rest) .This series of flows was carried out five times in a row (Fig. 2).
The EMG waveforms obtained over 400 seconds were rectified and smoothed in real time at 0.1 second intervals of integration and these integral waveforms were then shown to subjects (in addition to the instruction signals).
frequency for the high and low range cutoff filters was set at 1 kHz and 16 kHz, noise was removed from the surface EMG by inserting an AC removal filter and evaluation performed through a “sensor output signal evaluation system”.
Step 4: In conjunction with Step 3, the optical brain function imaging device LABNIRS (Shimadzu Corporation, Kyoto) was used to measure Co and Cd at a sampling frequency of
Tanimura et al.; JAMMR, 28(6): 1-12, 2018; Article no.
EMG was calculated for this period of muscle ar activity corresponding to α=75% (third quartile) of maximum voluntary
Biofeedback training experiment for rectus femoris muscle.
Step 3: Muscular activity corresponding to α% of as shown to the subject as the instruction signal and five cycles of intermittent signals were provided for 40 seconds up during the first 20 seconds), hereafter referred to as the “transient ds of constant muscle activity, hereafter referred to as the “muscle contraction period (MCP)” and then 40 seconds of relaxation (the first 20 seconds are rest and the last 20 rest) .This series of flows was
2).
The EMG waveforms obtained over 400 seconds were rectified and smoothed in real time at 0.1 second intervals of integration and these integral waveforms were then shown to subjects (in addition to the instruction signals). Cut-off frequency for the high and low range cutoff filters was set at 1 kHz and 16 kHz, noise was removed from the surface EMG by inserting an AC removal filter and evaluation performed through a “sensor output signal evaluation system”.
Step 4: In conjunction with Step 3, the optical brain function imaging device LABNIRS (Shimadzu Corporation, Kyoto) was used to measure Co and Cd at a sampling frequency of
17.5 Hz [26,34]. A holder was placed on the subject’s head, with light-emitting/rec probes arranged based on international 10 sensor placement as shown in Fig.
cerebral blood flow concentrations were measured on the frontal lobe, at 54 channels (Fig. 3).
Owing to space limitations, this manuscript focuses on the analysis of Co only.
Fig. 2. Experiment protocol: a procedure for single task (a); a series of procedures with
repeated tasks (b).
2.4 Data Analysis
For each subject, standardization was performed using average Co in the pre-rest period in each BFT cycle and the standard deviation. Standardized sequences were obtained in each period; the pre-rest, the TP, the MCP and the post-rest.
In this study, we analyzed time sequences of the Co for 8 ch. The time series were smoothed by the low-pass filtering whose cut-off frequency was set to be 0.1, 0.2, 0.3, 0.5, 1, 1.5, 2 Hz, respectively. We can measure the degree of determinism for the mathematical model time series {xt}. Translation errors
; Article no.JAMMR.45371
17.5 Hz [26,34]. A holder was placed on the emitting/receiving probes arranged based on international 10-20 . 3. Changes in cerebral blood flow concentrations were measured on the frontal lobe, at 54 channels
Owing to space limitations, this manuscript e analysis of Co only.
Fig. 2. Experiment protocol: a procedure for single task (a); a series of procedures with
repeated tasks (b).
For each subject, standardization was performed rest period in each BFT cycle and the standard deviation. Standardized sequences were obtained in each rest, the TP, the MCP and the
analyzed time sequences of the Co for 8 ch. The time series were smoothed by off frequency f0
herein estimated for each time series in addition to sequences of their temporal differences by the Double Wayland algorithm [34, 35]. Also, we compared Etrans for the abovementioned time
series with their surrogate sequences that were generated by the Fourier shuffle (FS) algorithm [36, 37]. The length of the time series must be
2 because Fast Fourier Transformation (FFT) is conducted in this algorithm. In this study, the length of the time sequences was set to be 256 (n =8), and time sequences extracted from the onset time (0 s) to 15 s/6 s to 20 s are defined as the first half period/the later half period, respectively. The value of Etrans were estimated
as an average of those for the first half and the later half period.
Fig. 3. Array of irradiation and light-receiving probes.
These translation errors were compared with each other by the Welch-Aspin test in order to evaluate the nonlinearity of the mathematical model describing the hemodynamics in the cerebrum. The significant level was set to be 0.05.
3. RESULTS
BFT was carried out for 10 subjects, and we confirmed the records of the muscle performance in the BFT by the sensor output evaluation system. For all subjects, smoothed integral signal of the rectified EMG was fit to the teacher signal well. We also recorded time series data of local
cerebral blood flow on the frontal lobe at 54 channels (Fig. 3).
In this study, we focused on a period for the fourth task (Fig. 2b), which is comparatively stable compared to the other periods (Fig. 4). Standardized sequences were extracted for the fourth task as in Fig. 5b. The data analysis was conducted for the time series smoothed by the low-pass filtering whose f0 was set to be 0.1, 0.2,
0.3, 0.5, 1, 1.5, 2 Hz, respectively. By the Double Wayland algorithm, Etrans was estimated for time
series data of Co and the sequences of their temporal differences as {xt+τ -xt} (Fig. 6), where
the delay time τ is the time until the autocorrelation function of each time series data becomes less than 1/e (Table 1). The growth of Etrans monotonically increased according to the
increase of the cut-off frequency f0 and . Based
on this result of the values in Etrans for f0 ≥ 0.2 Hz,
it is a solid argument in the MCP and the post-rest that the hemodynamics in the cerebrum is assumed to be described by a stochastic process. The details of that basis are discussed in the next section.
Setting the following statistical hypothesis, Etrans
for each time series was compared with their surrogate sequences that were generated by the FS algorithm (Figs. 7).
Null hypothesis H0: Time series are generated by
the linear mathematical model.
Alternative hypothesis H1: Time series are
generated by the non-linear mathematical model.
For the MCP, statistical significances were observed in the comparison of translation errors estimated from standardized time series smoothed by the low-pass filtering (f0 = 0.1, 0.2)
with those from their surrogate sequences, respectively (Fig. 7a). Also, we could find the statistical significances in the comparison of translation errors estimated from the sequences of temporal differences (f0 = 0.1, 0.2) with those
from their surrogate time series, respectively (Fig. 8a).
Table 1. Delay time τ estimated by the auto-correlation functions
Hz Period
0.1 0.2 0.3 0.5 1 1.5 2 None
Pre-rest 56 46 45 39 29 22 15 1
Transient 57 52 49 35 27 24 19 1
MCV 66 58 53 49 31 26 26 2
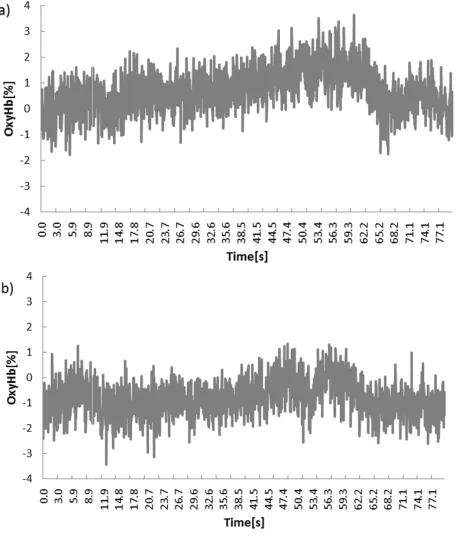
Fig. 4. Standardized variations of the local cerebral blood flow. Typical graph of time series of
Fig. 5. Typical graph of time series of Co for the following periods. Time sequences extracted from Fig. 4; forth task period (a); the
Tanimura et al.; JAMMR, 28(6): 1-12, 2018; Article no.
Standardized variations of the local cerebral blood flow. Typical graph of time series of Co at 36 ch (a); 8 ch (b).
Typical graph of time series of Co for the following periods. Time sequences extracted 4; forth task period (a); the first task period (b).
; Article no.JAMMR.45371
Standardized variations of the local cerebral blood flow. Typical graph of time series of
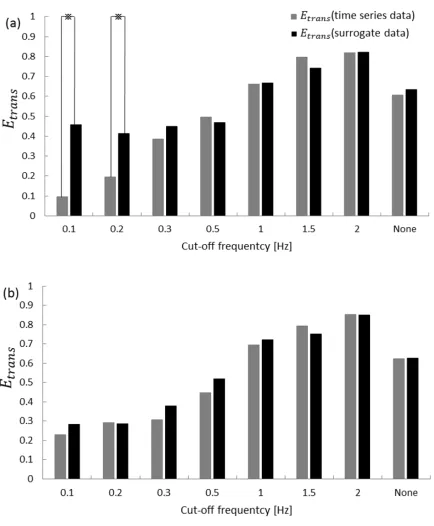
Fig. 6. Translation errors Etrans for all experimental periods. We can compare Etrans estimated from standardized time series smoothed by the low-pass filtering (a); the sequences of their
temporal differences (b).
Fig. 7. Statistical comparison of Etrans estimated from standardized time series smoothed by
Tanimura et al.; JAMMR, 28(6): 1-12, 2018; Article no.JAMMR.45371
Fig. 8. Statistical comparison of Etrans estimated from the sequences of temporal differences
with their surrogate sequences. Translation errors Etrans for MCP (a); post-rest (b).
In these cases, the null hypothesis was rejected as shown in Fig. 7 (*p<0.05).
For the post-rest, statistical significances were observed in the comparison of translation errors estimated from standardized time series smoothed by the low-pass filtering (f0 = 0.1, 0.2,
1) with those from their surrogate sequences, respectively (Fig. 7b). However, there was no statistical significance in the comparison of translation errors estimated from the sequences of temporal differences with those from their surrogate time series (Fig. 8b).
4. DISCUSSION
The BFT is also known as a countermeasure for the patients with intractable epilepsy and reduction method for the mental stress [38-47]. However, a method for objectively evaluating does not have been established yet whereas subjective evaluation and findings were stated in the previous study. Also, there is no study to evaluate the cerebral hemodynamics and investigate the cerebral blood flow regulation during the BFT. According to our previous consideration in the bio-signal, it is necessary to evaluate robust bio-system by using the mathematical models because the changes in
the system can be hardly found out. Moreover, it is important to set the cut-off frequency to denoise in the bio-signal, especially in the brain function analysis. However, there is no prior research that defined the cut-off frequency, based on the mathematical consideration. Therefore, we herein focused on mathematical design of the cut-off frequency in the low-pass filtering.
In general, it is a solid argument that the values of Etrans is less than 0.1 estimated from the
deterministic process as numerical solution to ordinal differential equations for the embedding dimension ≤ 10 dim [48]. In the MCP and the post-rest, the hemodynamics in the cerebrum is regarded as a stochastic process because the values in Etrans was not less than 0.1 estimated
from standardized time series smoothed by the low-pass filtering for f0 ≥ 0.2 Hz. Whereas the
values in Etrans was saturated for the bounded f0
-value (≥ 0.2 Hz), it decreased without the low-pass filtering as →∞ . This is because the rhythmic artifacts are contained as
cardiovascular bio-signal or body motion with the BFT.
Moreover, the values in Etrans estimated from
standardized time series smoothed by this low-pass filtering were less than those from the sequences of temporal differences. It is a concept of the Double Wayland algorithm that stochastic generators enhance the degree of complexity in the sequences of temporal differences.
Artifact could be reduced in standardized time series smoothed by the low-pass filtering (f0 < 1
Hz) because the growth of Etrans the
monotonically increased according to the increase of the cut-off frequency f0. Setting the
cut-off frequency in the low-pass filtering to be less than 0.2 Hz, noise reduction is considered to be more effective than the other cases mentioned above. However, the cerebral blood flow in the frontal lobe is not always generated by the stochastic process as shown in Fig. 6.
Nonlinearity was investigated in the mathematical model of the hemodynamics in the cerebrum; setting the abovementioned null hypothesis H0, Etrans for each time series
(including the sequences of temporal differences) was compared with their surrogate sequences that were generated by the FS algorithm (Figs 7-8). For the MCP, statistical significances were observed in the comparison of translation errors estimated from standardized time series (including the sequences of temporal differences) with those from their surrogate sequences (f0 =
0.1, 0.2) as shown in Figures 7a, 8a. In these cases, the null hypothesis was rejected, and the nonlinearity in the hemodynamics of the cerebrum could be statistically shown for f0 < 0.3.
Setting the cut-off frequency to be f0 ≤ 0.2 Hz in
the low-pass filtering for the time series analysis, the cerebral blood flow is thus considered to be
generated by the nonlinear mathematical model. Base on the stochastic theory, a mathematical model could be derived from the set of stochastic differential equations including the nonlinear group only if we set the cut-off frequency to be 0.2 Hz in the low-pass filtering for the analysis of the hemodynamics in the cerebral blood flow.
In the case of the post-rest, however, there was no common significance in the comparison of the sequences of temporal differences with those from their surrogate time series for each cut-off frequency (Fig. 8b). This is because translation errors estimated from the sequences of temporal differences are more sensitive for the evaluation of complexity in the motion process than those from the time series data.
5. CONCLUSION
In this study we investigated the effect of the BFT on the local cerebral blood flow on the frontal lobe. We have succeeded in finding that the effect can be seen in the MCP and the post-rest. Setting the cut-off frequency to be 1 ≥ f0 ≥ 0.3 Hz,
We have succeeded in findings that the mathematical model of the cerebral blood flow is regarded as a stochastic differential equation with setting the cut-off frequency to be 0.2 Hz in the low-pass filtering for the time series analysis.
CONSENT
The experiment was fully explained to the subjects beforehand, and written consent was obtained.
ETHICAL APPROVAL
The experiment was approved by the Ethics Committee of Department of human and artificial intelligent systems, Graduate School of Engineering University of Fukui (No.2).
COMPETING INTERESTS
Authors have declared that no competing interests exist.
REFERENCES
1. Jacobson E. Progressive relaxation. University of Chicago Press, Chicago, USA; 1938.
Tanimura et al.; JAMMR, 28(6): 1-12, 2018; Article no.JAMMR.45371
Springer Publishing, New York, USA; 1998. 3. Gatchel RJ, Price KP. Critical applications of biofeedback. Pergamon Press, New York, USA; 1979.
4. Gaarder KR, Montgomery PS. Clinical biofeedback: A procedural manual for behavioral medicine. Williams & Wilkins, Baltimore, USA; 1981.
5. Basmajian S. An anthology of visual poetry and collage. Sober Minute Press, Chicago, USA; 1989.
6. Calomeni MR, Rocha JA, Silva AP, Ribeiro LH, Marques L, et al. Brain stimulation used as biofeedback training for recovery of motor functions deteriorated by stroke. Arq Neuropsiquiatr. 2013;71:159-164. 7. Nanhoe-Mahabier W, Allum JH, Pasman
EP, Overeem S, Bloem BR. The effects of vibrotactile biofeedback training on trunk sway in Parkinson's disease patients. Parkinsonism Relat Disord. 2012;18:1017-1021.
8. Furubayashi T, Motizuki H, Terao Y, Arai N, Hanajima R, Hamada M, Matsumoto H, Nakatani-Enomoto S, Okabe S, Yugeta A, Inomata-Terada S, Ugawa Y. Cortical hemoglobin concentration changes underneath the coil after single-pulse transcranial magnetic stimulation. J Neurophysiol Mar. 2013;109(6):1626-163. 9. Groiss SJ, Motizuki H, Furubayashi T,
Kobayashi S, Nakatani-Enomoto S, Nakamura K, Ugawa Y. Quadri-pulse stimulation induces stimulation frequency dependent cortical hompglobin concentration chages within the ipsilateral motor cortical network. Brain Stimulation. 2013;6(1):40-48.
10. Sato Y, Fukuda M, Oishi M, Shirasawa A, Fujii Y. Ictal near-infrared spectroscopy and electrocorticography study of supple-mentary motor area seizures. Journal of Biomedical Optics. 2013;18(7):076022. 11. Bae SJ, Jang SH, Seo JP, Chang PH. A
pilot study on the optimal speeds for passive wrist movements by a rehabilitation robot of stroke patients. IEEE Int Conf Rehabil Robot. 2017;2017:7-12. DOI:10.1109/ICORR.2017.8009213. 12. Lee J, Mukae N, Arata J, Iwata H, Iramina
K, Iihara K, Hashizume M. A multichannel-near-infrared-spectroscopy-triggered robotic hand rehabilitation system for stroke patients. IEEE Int Conf Rehabil Robot. 2017;2017:158-163.
DOI:10.1109/ICORR.2017.8009239. 13. Spinelli L, Zucchelli L, Contini D, Caffini M,
Mehler J, Fló A, Ferry AL, Filippin L, Macagno F, Cattarossi L, Torricelli A. In vivo measure of neonate brain optical properties and hemodynamic parameters by time-domain near-infrared spectroscopy. Neurophotonics. 2017;4(4):041414. DOI:10.1117/1.NPh.4.4.041414.
14. Chiarelli AM, Zappasodi F, Di Pompeo F, Merla A. Simultaneous functional near-infrared spectroscopy and electroen-cephalography for monitoring of human brain activity and oxygenation. Neurophotonics. 2017;4(4):041411.
DOI:10.1117/1.NPh.4.4.041411.
15. Herold F, Wiegel P, Scholkmann F, Thiers A, Hamacher D, Schega L. Functional near-infrared spectroscopy in movement science. Neurophotonics. 2017;4(4): 041403.
DOI:10.1117/1.NPh.4.4.041403.
16. Yasumura A, Omori M, Fukuda A, Takahashi J, Yasumura Y, Nakagawa E, Koike T, Yamashita Y, Miyajima T, Koeda T,11, Aihara M, Tachimori H, Inagaki M. Applied machine learning method to predict children with ADHD using prefrontal cortex activity. J Atten Disord. 2017;1: 1087054717740632.
DOI:10.1177/1087054717740632.
17. Mileder LP, Müller T, Baik-Schneditz N, Pansy J, Schwaberger B, Binder-Heschl C, Urlesberger B, Pichler G. Influence of ductus arteriosus on peripheral muscle oxygenation and perfusion in neonates. Physiol Meas. 2017;28;39(1):015003. DOI:10.1088/1361-6579/aa9c3b.
18. Ates FE, Cangöz B, Özel Kızıl ET, Baskak B, Baran Z, Özgüven HD. Frontal activity during a verbal emotional working memory task in patients with Alzheimer's disease. Psychiatry Res Neuroimaging. 2017;261: 29-34.
DOI:10.1016/j.pscychresns.2016.12.013. 19. Kim DJ, Cho YJ, Park SH, Lim C, Park KH,
Jheon S, Kim JS. Near-Infrared spectroscopy monitoring for early detection of limb ischemia in patients on veno-arterial extracorporeal membrane oxygenation. ASAIO J. ASAIO J. 2017;63(5):613-617.
DOI:10.1097/MAT.0000000000000532. 20. Rasmussen MB, Eriksen VR, Andresen B,
Hyttel-Sørensen S, Greisen G. Quantifying cerebral hypoxia by near-infrared spectroscopy tissue oximetry. J Biomed Opt. 2017;22(2):25001.
21. Villringer A, Dirnagl U. Coupling of brain activity and cerebral blood flow: Basis of functional neuroimaging. Cerebrovasc Brain Metab Rev. 1995;7:240-276.
22. Villringer A. Non-invasive optical spectroscopy and imaging of human brain function. Trends Neurosci. 1997;20:435-442.
23. Okamoto M, Dan H, Sakamoto K, Takeo K, Shimizu K, et al. Three-dimensional probabilistic anatomical cranio-cerebral correlation via the international 10-20 system oriented for transcranial functional brain mapping. NeuroImage. 2004;21:99-111.
24. Shimura T, Amida T. Prefrontal lobe measurement using near infrared spectroscopy: Evaluation of early detection methods and rehabilitation methods of dementia. Corona publishing, Tokyo, Japan; 2009.
25. Watanabe E, Murota Y, Nakajima C. Functional mapping of language activities during the recovery phase of aphasia using near infrared optical topography. High Brain Funct Res. 2005;25:215-223. 26. Zardecki A. Multiple scattering corrections
to the Beer-Lambert law. Proc SPIE. 1983;410:103-111.
27. Komozumi H. Observe the active brain: Visualization of higher brain function. Chem Today. 1997;11:27-33.
28. Hoshi Y, Tamura M. Detection of dynamic changes in cerebral oxgenation coupled to neural function during mental work in man. Neurosci Lett. 1993;150: 5-8.
29. Kato T, Kamei A, Takashima S, Ozaki T. Human visual cortical function during photic stimulation monitoring by means of near-infared spectroscopy. J Cereb Blood Flow Metab. 1993;13:516-520.
30. Miyai I, Tanabe H, Sase I, Eda H, Oda I, et al. Cortical mapping of gait in human: A near-infrared spectroscopic topography study. NeuroImage. 2001;14:1186-1192. 31. Middleton LE, Mitnitski A, Fallah N,
Kirkland SA, Rockwood K. Changes in cognition and mortality in relation to exercise in late life: A population based study. PLoS One. 2008;3:e3124.
32. Matsuura Y, Taniguchi T, Sugiura A, Miyao M, Takada H. Distribution of cerebral blood flow during gum-chewing. Forma 2012;27:1-4.
33. Wayland R, Bromley D, Pickett D, Passamante A. Recognizing determinism
in a time series. Phys. Rev. Lett. 1993;70: 530-582.
34. Takada H, Morimoto T, Tsunashima H, Yamazaki T, Hoshina H, Miyao M. Applications of double-Wayland algorithm to detect anomalous signals. Forma. 2006;21(2):159-167.
35. Yoshikawa K, Takada H. Effect of gaussian noise amplitude on translation error estimated by double-Wayland algorithm. Journal of Mathematics and System Science. 2012;2:482-488.
36. Theiler J, Eubank S, Longtin A, Galdrikian B, Farmer JD. Testing for nonlinearity in time series the method of surrogate data. Physica D. 1992;58:77-94.
37. Theiler J, Prichard D. Constrained-realization Monte-Carlo method for hypothesis testing. Physica D. 1996;94(4): 221-235.
38. Finley WW, Smith HA, Etherton MD. Reduction of seizures and normalization of the EEG in a severe epileptic following sensorimotor biofeedback training. Biol Psychol. 1975;2(3):189-203.
39. Tremback-Ball A, Gherghel E, Hegge A, Kindig K, Marsico H, Scanlon R. The effectiveness of biofeedback therapy in managing Bladder Bowel Dysfunction in children. J Pediatr Rehabil Med. 2018;11(3):161-173.
DOI:10.3233/PRM-170527
40. Tremback-Ball A, Gherghel E, Hegge A, Kindig K, Marsico H, Scanlon R. Awareness of comfort immediately after a relaxation therapy session affects future quality of life and autonomic function. J Pediatr Rehabil Med. 2018;11(3):161-173. DOI:10.3233/PRM-170527.
41. McKenzie RF, Ehrisman WJ, Montgomery PS, Barnes RH. The treatment of headache by means of electroen-cephalographic biofeedback. Headache. 1974;13(4):164-72
42. Tremback-Ball A, Gherghel E, Hegge A, Kindig K, Marsico H, Scanlon R. The effectiveness of biofeedback therapy in managing Bladder Bowel Dysfunction in children. J Pediatr Rehabil Med. 2018; 11(3):161-173.
DOI:10.3233/PRM-170527.
43. van Gelder LMA, Barnes A, Wheat JS, Heller BW. The use of biofeedback for gait retraining. Clin Biomech (Bristol, Avon). 2018;59:159-166.
Tanimura et al.; JAMMR, 28(6): 1-12, 2018; Article no.JAMMR.45371
44. Ma CZ, Zheng YP, Lee WC. Changes in gait and plantar foot loading upon using vibrotactile wearable biofeedback system in patients with stroke. 2018;25(1):20-27. DOI:10.1080/10749357.2017.1380339. Epub 2017 Sep 27.
45. Nagai Y, Aram J, Koepp M, Lemieux L, Mula M, Critchley H, Sisodiya S, Cercignani M. Epileptic seizures are reduced by autonomic biofeedback therapy through enhancement of Fronto-limbic connectivity. EBio Medicine. 2018;27:112-122.
DOI:10.1016/j.ebiom.2017.12.012.
46. Xu J, Bao T, Lee UH, Kinnaird C, Carender
W, Huang Y, Sienko KH, Shull PB. Configurable, wearable sensing and vibrotactile feedback system for real-time postural balance and gait training. 2017;14(1):102.
DOI:10.1186/s12984-017-0313-3.
47. Kubik P, Kraj B, Kubik A. Neurofeedback therapy influence on clinical status and some EEG parameters in children with primary generalized epilepsy. Przegl Lek. 2016;73(3):152-6.
48. Miyano T. Time series analysis of complex dynamical behavior contaminated with observational noise. Int. J. Bifur. Chaos. 1996;6(11):2031-2045.
_________________________________________________________________________________
© 2018 Tanimura et al.; This is an Open Access article distributed under the terms of the Creative Commons Attribution License (http://creativecommons.org/licenses/by/4.0), which permits unrestricted use, distribution, and reproduction in any medium, provided the original work is properly cited.
Peer-review history: