Type of the Paper (Article)
1
Single cell isolation using optical tweezers
2
Anusha Keloth, Owen Anderson, Donald Risbridger and Lynn Paterson*
3
Institute of Biological Chemistry, Biophysics and Bioengineering, School of Engineering and Physical
4
Sciences, Heriot Watt University, Edinburgh EH14 4AS, UK.
5
* Correspondence: [email protected]; Tel.: +44-131-3068
6
7
Abstract: Optical tweezers offer a non-contact method for selecting single cells and translocating
8
them from one microenvironment to another. We have characterized the optical tweezing of yeast
9
S. cerevisiae and can manipulate single cells at velocities up to 0.77 mm/s using laser powers of 40
10
mW from a 785 nm diode laser. We have fabricated and tested three cell isolation devices; a
11
micropipette, a PDMS chip and laser machined fused silica chip and we have isolated single
12
bacteria, yeast and cyanobacteria cells. The most effective isolation was achieved in PDMS chip,
13
where single yeast cells were grown and observed for 18 hours without contamination. The duration
14
of budding in S. cerevisiae was not affected by the laser parameters used, but the time from tweezing
15
until the first budding event began increased with increase laser energy (laser power x time). Cells
16
tweezed using 25 mW for 1 minute were viable after isolation. We have constructed a
micro-17
consortium of yeast cells, and a co-culture of yeast and bacteria, using optical tweezers in
18
combination with the PDMS network of channels and isolation chambers, which may impact on
19
both industrial biotechnology and understanding pathogen dynamics.
20
Keywords: optical tweezers; optical trap; PDMS devices; single cells
21
22
1. Introduction
23
In the last several years there has been a surge in attention towards single cell analysis due to
24
increasing awareness of the importance of cell heterogeneity, advances in genome and transcriptome
25
amplification and the emergence of technologies which enable single cell manipulation. Traditional
26
‘bulk’ studies on millions of cells in a single experiment can only provide general and averaged
27
results regarding cell behaviour. However, even within a genetically identical population, cell
28
heterogeneity exists, due to individual cells experiencing and reacting to differences in their
micro-29
niche or due to stochastic gene expression. As such, single-cell isolation has become an important
30
tool for researchers interested in purifying and analysing single cells to study cell heterogeneity [1]
31
and subsequently investigating cell dynamics [2] or performing genome or transcriptome sequencing
32
[3]. Single cell methods have become a key technique in prokaryotic biology as single cell isolation
33
provides a means by which previously uncultured microbes can be grown in a lab by eliminating
34
competition from faster growing organisms, or the link between microorganism and genome can
35
reveal previously undiscovered microbial functions and metabolites from this ‘unculturable
36
microbial dark matter’ [4]. Isolation of single cells is also key to reproduce a pure culture, where all
37
cells in the culture are derived from a single progenitor cell [5]. Therefore, single cell technologies
38
offer the ability to isolate a single cell from an interfering population and the study of individual cells,
39
unbiased by population effects.
40
This paper summarizes state of the art, single cell isolation techniques and describes the use of
41
optical tweezers to perform single cell isolation. We go on to use optical tweezers in combination
42
with a channel system to move individual cells from one micro environment to another in order to
43
isolate those individual cells from a population of cells. The optical tweezer system is characterised
44
by calculating the applied force on baker’s yeast (S. cerevisiae) cells and cell clonability after tweezing
45
is measured. Three channel systems for isolating cells are described and compared; a micropipette
46
channel, a polydimethylsiloxane (PDMS) device and laser machined channels in fused silica and
47
some potential applications are discussed.
48
1.1. Single cell isolation methods
49
In order to establish a pure culture, a viable cell must be isolated and this physical isolation must
50
be maintained whilst the cell divides to form a colony. Similarly, in order to perform single cell
51
‘omics’ a cell must be physically isolated from other cells in the population. Cell isolation methods
52
preferred by research groups depend on the nature of the sample (number of cells, origin of sample)
53
and the processing to be performed on the isolated cells; culture-based or culture-independent
54
analyses [6]. Isolation may be achieved by statistical means; by dilution to extinction whereupon a
55
sample is diluted until, on average, there is only a single viable cell left in a given location, such as a
56
well of a 96 well plate. It simple and easy to perform however there is no control over where each
57
individual cell in the population goes and it does not necessarily provide single cells.
58
Individual cells may be selectively isolated, rather than leaving the choice of cells to be
59
investigated by chance, by using microscope-based techniques. Early techniques used micro-needles
60
or microcapillaries connected to pressure and suction pumps to selectively micropipette individual
61
cells and move them to another, sterile location, for example a microchamber [7, 8]. The mechanical
62
forces exerted on these cells are large, and can lead to shear damage, however, micromanipulation
63
using hand-held or robotic micropipettes remains popular for cell isolation when working with small
64
numbers of cells [6]. Laser capture microdissection (LCM) [9] is another isolation technique
65
performed under a microscope, allowing a cell from a sample, spread on a sheet of thin polyethylene
66
membrane, to be selected and cut-out using a laser. The laser beam circumscribes an area containing
67
a cell of interest and the cut-out region falls, due to gravity into a microwell. Alternatively, the laser
68
catapults the cut-out region into a microwell. Specimens were traditionally histopathological, so fixed
69
in formalin, embedded in paraffin, or cryo-fixed but nowadays live cells can be isolated using LCM,
70
as can prokaryotes [10] for downstream culture.
71
A popular method of cell isolation, aimed at sorting and analysing large volumes of single cells
72
in a short time, is fluorescence activated cell sorting (FACS) [11]. FACS systems can quantitatively
73
analyse multiple characteristics of millions of single cells from a heterogeneous population and can
74
be easily adapted to deflect a charged droplet containing a cell of interest into a microtiter plate. It
75
can perform high-throughput single-cell analysis and isolate single cells of interest from thousands
76
of cells in a population using up to 18 surface markers and can be used as a platform to select and
77
isolate single cells for high-resolution Next Generation Sequencing analysis to resolve sample
78
heterogeneity and reveal novel biology [12]. However, FACS systems typically require large sample
79
sizes and are primarily designed to process eukaryotic cells and are not optimized for smaller
80
microorganisms [13].
81
Compartmentalization techniques are also available and well suited for eukaryotic or
82
prokaryotic cell isolation, such as ‘lobster traps’ which have been used to cage individual bacteria
83
flowing cells into them and hoping for one cell to enter the trap and proliferate in a confined volume.
85
Microdroplet compartments can be created using a microfluidic network. They are similar to lobster
86
traps since they provide a compartment in which single cells be isolated, they are monodisperse and
87
thus suitable for quantitative studies and in addition can be used for high-throughput experiments
88
[16]. Typically, microdroplets are filled stochastically, but combining microdroplet generation
89
methods with cell pre-selection cells is also possible, for example using the application of acoustic,
90
optical or electric fields [17].
91
Active cell manipulation technologies, in which cells move in response to an applied field, have
92
the advantage of being sterile, non- contact, manipulation methods capable of sorting populations of
93
cells within microfluidic devices based upon the cells’ response to the field. Optical [18], acoustic [19,
94
20] uniform and non-uniform electrical fields [21] and magnetic fields [22] all have uses in either
95
label-free or labelled-cell sorting [23] and in some cases can be adapted for single cell isolation.
96
Microfluidic or chip-based cell sorters have great potential for single cell isolation in
97
microbiology and biotechnology because they can be used for a variety of sample sizes, including
98
small, precious samples of few cells, or large samples which include interesting rare cells. They can
99
offer precise isolation of selected cells, are disposable (thus reducing cross-contamination) and are
100
potentially easier to use, smaller in scale and less expensive compared to some previously mentioned
101
techniques. The use of optical tweezers in particular offers unparalleled selectivity of single cells,
102
precision of translocation of a single cell, viability of isolated cells and potential for automation;
103
desirable factors for many experiments requiring cell isolation.
104
1.2 Single cell manipulation and isolation using optical tweezers
105
Ashkin, the inventor of optical tweezers reported that optical trapping using an 80 mW laser
106
beam at 1064 nm wavelength for 30 min did not affect growth or division of E. coli [24]. Absorption
107
of laser light by a living cell may result in photodamage to the cell.
108
Work which followed Ashkin’s seminal paper reported negative effects of optical trapping
109
including propagation ability [25-27] and cell motility [28], and the induction of a stress response
110
gene in C. elegans [29]. In 2006 Ayano et al. found that E. coli cell growth stopped during optical
111
trapping using a 1064 nm trap, even at very low trap powers. They found that damage to the cell’s
112
growth and interdivision period was proportional to the total laser energy incident on the cell [30].
113
More recently, our group have measured localised heating in water by optical traps and found
114
temperature increments of 99 °C/W for 980 nm laser light, 49 °C/W for 1090 nm, which are expected
115
to cause photothermal damage to cells, and 0 °C/W for 808 nm and 750 nm light, all focused by a x100
116
1.3 NA objective lens [31]. Minimal photochemical damage occurs for laser wavelengths close to 820
117
or 980 nm as demonstrated by the cloning efficiency of mammalian Chinese Hamster Ovary (CHO)
118
cells after irradiation with different wavelengths [26].
119
Despite these reports of photodamage to cells, optical tweezers, and optical forces in general
120
have already been used successfully to manipulate single cells within a variety of devices for a range
121
of applications, both in samples with flow and in static samples with no flow. A dual beam tweezer
122
was used in combination with an image processing algorithm to identify and isolate human
123
peripheral blood cells based on their morphology, and erythrocytes were manipulated distances
124
greater than 1 mm, for times longer than 20 min, without showing any morphologically visible
125
Optical tweezers have been used to move single E. coli cells into individual chambers in a
micro-127
chamber array. After a cell had divided, one of the two daughter cells was moved to a new chamber,
128
allowing generational differences to be monitored. The adaptation of single cells to changes in
129
nutrient concentration was observed for single E. coli tweezed into individual micro-chambers [33].
130
The ability to change the response of cells to changes in nutrient concentration is also important for
131
studies of culturability. Optical tweezers have been combined with microfluidics to move E.coli cells
132
between different reservoirs where they are exposed to different media containing fluorescent stains,
133
without the media being dragged along with the trapped cells [34]. Single yeast cells have been
134
optically manipulated in a nutrient gradient, created within a microfluidic device [35], thus cells are
135
exposed to different environments and detection and analysis of rapid changes to the cells size in
136
response to the osmolarity of the environment can be analysed. The same group subsequently
137
demonstrated rapid switching of the environmental glucose concentration around a yeast cell by
138
combining microfluidics and optical tweezers, and observed the cycling of intracellular GPF tagged
139
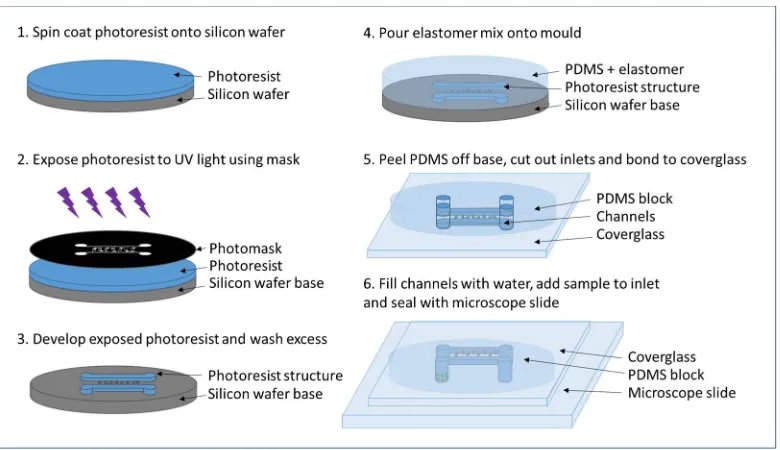
proteins between the nucleus and cytosol in response to the changes in glucose availability [36, 37].
140
A simple DVD pickup has been adapted to tweezing colloid and red blood cells in a laminar flow to
141
direct the cell to the correct output for isolation from the rest of the sample flow [38]. A dynamic
142
optical tweezer has been used in combination with microfluidics and image processing to select out
143
rare cells based on their morphology from a sample flow [39]. This was developed further to include
144
microarrays into which cells docked. The arrays of cells could be simultaneously optically levitated
145
and manipulated into a different microfluidic environment within the same chip [40]. More recently,
146
Probst et al. demonstrated tweezing of single E.coli cells into cultivation compartments allowing
147
individual cell selection and precision inoculation [41], unlike the stochastic flow- based filling of the
148
compartments previously shown [15]. Cell growth was unaffected after irradiation using 1064 nm at
149
60 mW for under 1 minute.
150
In this paper we demonstrate the isolation of single cells using optical tweezers. The tweezing
151
of yeast cells is characterised and discussed, and then three different cell isolation devices are
152
fabricated and tested; a hollow glass microneedle channel, a PDMS-based device and a device
153
inscribed in fused silica. We measure the growth of tweezed cells in the PDMS-based device to
154
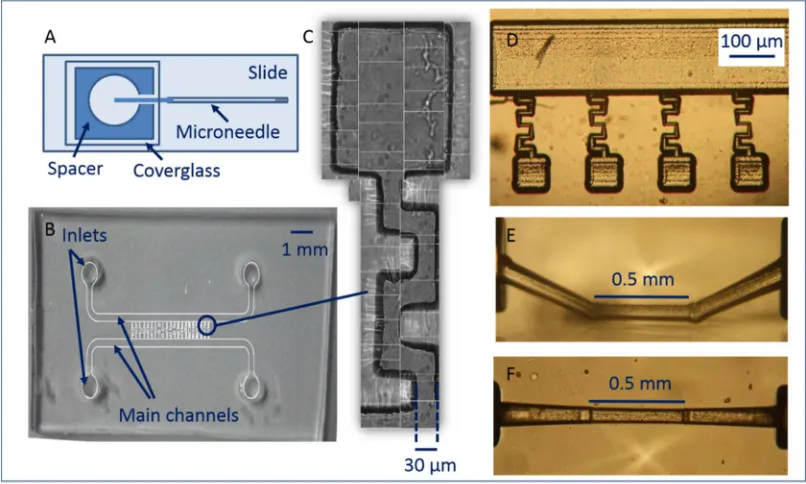
determine if growth rate has been affected by the isolation process. The tweezing and isolation of
155
bacteria, cyanobacteria and yeast is achieved and the advantages and drawbacks of the three devices
156
are discussed.
157
2. Materials and Methods
158
An optical tweezer system operating at 785 nm was used to manipulate and isolate cells.
159
Labview was used to control stages, camera, image acquisitions and the laser. Three devices were
160
fabricated and used in order to assess their suitability for cell isolation experiments. Cells used in
161
experiments were primarily the yeast S. cerevisiae, however bacteria (E.coli, B. subtilis) and
162
cyanobacteria cultures were also used.
163
2.1 Optical tweezers system
164
A 785 nm laser diode (FPL785S-250, Thorlabs) with maximum output of 250 mW and controlled
165
via customised LabView software using a controller (CLD1015, Thorlabs) was used in an optical
166
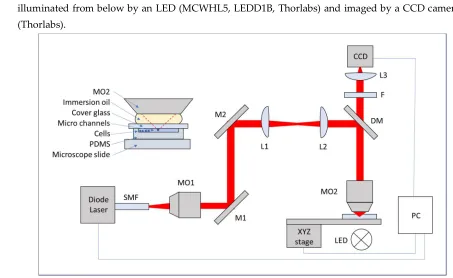
tweezers assembly, as shown in figure 1. The beam is directed via a dichroic mirror (DM) into the
167
Axis Motorized Translation Stage (MT3/M-Z8, Thor labs). The stage is controlled via customised
169
LabVIEW software using DC Servo Motor Controllers (KDC101, Thor labs). The sample is
170
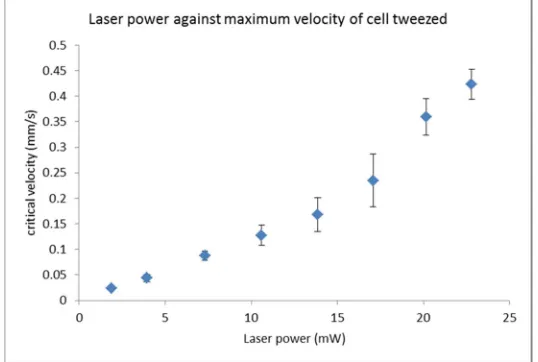
illuminated from below by an LED (MCWHL5, LEDD1B, Thorlabs) and imaged by a CCD camera
171
(Thorlabs).
172
173
Figure 1. Optical tweezers. The beam emitted from the laser via a single mode fibre (SMF) is
174
collimated by a 10x microscope lens (MO1). The two mirrors, M1 and M2, direct the laser light into
175
an image relay system (L2 and L3). The laser light is reflected using a dichroic mirror (DM) into a
176
100x 1.3 NA immersion objective lens (MO2). Inset is a sample which is placed on the sample stage.
177
178
2.2 Cell tweezing, imagaing and tracking
179
Optical tweezers characterisation was performed by selecting a single cell, translating it along
180
the z axis by 20-40 m such that the cell is a distance away from the chamber surface and other cells,
181
and measuring the critical velocity, , at which the cell fell out of the trap when translated in the x
182
direction. Cells were stably translated in the x direction a distance of 300 m and back again at one
183
velocity then the velocity was increased in 5 m/s increments (using Thorlabs APT software) until
184
the cell fell out the trap. This was repeated for approximately 20 cells at several laser powers. Cell
185
images were captured using Thorcam software and processed using ImageJ (Figure 2A-E, Figure 2G
186
inset). The cell minor (a) and major (b) axes were measured and images processed by background
187
subtraction, contrast enhancement (figure 2C), thresholding (figure 2D), and filling in holes (figure
188
2E) was performed in ImageJ to generate a number for cell area.
189
Figure 2: Yeast cell image analysis and tweezing. A: Image of S. cerevisiae cell to be tweezed and
191
its size analysed, B: Zoom in using ImageJ, C: Enhanced contrast, D: Thresholding applied, E: holes
192
filled in, ‘particle’ to be measured in ImageJ. F: schematic of how cell is translated in optical tweezers,
193
G: S. cerivisiae with large daughter cell attached. Inset shows how cell dimensions, minor axis a and
194
major axis b are measured in this case, H: Cell and attached daughter align in optical tweezer with
195
long axis, b, in direction of beam propagation, I: Cell and attached daughter are lifted in z using
196
optical tweezers. A background cell is seen to move out of focus, J: Cell and attached daughter are
197
tweezed at a velocity where they fall out of the trap.
198
199
The critical velocity of cells at various laser powers is measured and used to measure Stokes’
200
drag force;
201
= 3 (1)
202
to attain the trapping force, where is the dynamic viscosity of water and is the particle
203
diameter. Drag is also known to increase if a particle approaches a wall of the channel, showing a
204
linear relationship with / where H is the height of the channel [42]. Faxen provided a correction,
205
, to the Stokes’ drag calculation to account for this;
206
= 1 − + − − (2).
207
Stokes’ Law addresses spherical objects, whereas S. cerevisiae (yeast) cells used here are prolate
208
spheroid structures which reproduce asexually by developing a clone cell on their surface which
209
eventually grows to the size of the parent cell and splits from it; an asymmetric division process
210
known as budding. It is well known that non-spherical objects align with their long axis aligned to
211
the axis of beam propagation in optical tweezers and indeed we observe this for individual yeast cells
212
and cells with a budding daughter attached (figure 2G-I and video S1 in which a budding cell is
213
tweezed using 1.89 mW through a series of higher velocities until it falls out at 0.01 mm/s).
214
Corrections to the Stokes’ Drag for non-spherical objects have been proposed. The concept of an
215
equivalent radius of an ellipsoidal particle could be used in place of radius in Stokes’ equation [43]
216
or a correction may be used taking into account the aspect ratio for ellipsoidal and cylindrical
217
particles, and / for particles oriented with their long axes parallel to the wall [44]. Corrections to
218
Stokes drag for prolate spheroids, oblate spheroids and deformed prolate spheroids have been
219
produced recently [45]. The correction for motion of the cell in the direction parallel to the long axis
220
(as shown in figure 2F, left) used in this work, from [43], is
221
= ( − 1)/
( ) / + ( − 1)
/ − (3)
222
where the aspect ratio = as indicated in figure 2F. This motion can be seen immediately
223
before the cell falls out the trap in video S1 and in figure 2J. For motion transverse to the long axis of
224
the cell (Figure 2F, right) the correction, from [43], is
225
= ( − 1)/ ( ) / + ( − 1) / + (4)
226
which is the motion typically seen in a stably trapped S. cerevisiae cell translated in optical tweezers
227
(video S1, from which figure 2G-J was taken). The Faxen correction (Fc) and elliopsoid corrections to
228
LabVIEW was used to control laser power and on/off status, to translate the stage in 3D, to map
230
the chips and set waypoints at the locations of chambers and isolated cells, to autofocus the
231
microscope and finally, to capture time lapse images of isolated cells in their respective chambers.
232
Experiments were performed at room temperature, except when isolating and growing S. cerevisiae
233
which was at 30 °C. As an indicator of phototoxic damage to the cell we have measured two features
234
of the cell cycle. First, we measured the time taken for a daughter bud to become visible on cells
235
which were optically tweezed. Second, we measured the duration of the budding event, from first
236
observation of the bud on the surface of the mother cell until the daughter cell detaches. Time lapse
237
imaging, controlled by LabVIEW, was used on multiple chambers in the PDMS device (Figure 3C) in
238
which tweezed cells were located. Cells which had not been tweezed were also tracked as a control
239
for adequate replication conditions, which were in water (nutrient-poor environment) and at 30 °C.
240
An image of the cells was captured approximately every 13 minutes for 18 hours.
241
2.3 Device design and fabrication
242
Three devices were made and tested in cell isolation experiments. Firstly, pulled, hollow, glass
243
capillaries (also known as microneedles or micropipettes) were inserted into chambers to make a
244
linear microchannel into which single cells could be optically manipulated and mechanically
245
removed into a new sample (Figure 3A).
246
247
Figure 3: Chip designs. A: Pulled micropipette-based chip B: PDMS chip, C: Channel and
248
isolation chamber in PDMS chip, D: ULI and chemically etched chip with channels on the surface of
249
fused silica, E: ULI and chemically etched sub-surface channel in fused silica, side view, F: ULI and
250
chemically etched sub-surface channel in fused silica, top view.
251
252
A network of meandering channels was designed and fabricated using PDMS, a gas permeable
253
elastomer (Figure 3B, C). This channel network was the bonded to glass to seal it and single selected
254
network of channels was laser inscribed on the surface of fused silica (Figure 3D), loaded with
256
sample, and then sealed with a coverslip and optical tweezing was performed within the channels.
257
2.3.1. Hollow glass microneedle channel (micropipette)
258
Microneedles were fabricated by pulling borosilicate capillaries (BF100-50-10, Sutter) using a
259
micropipette puller (P-97, Sutter) programmed to a temperature of 289 (RAMP), pull 30, velocity 120
260
and delay 200. These settings were optimal to produce hollow glass needles which had a narrow
261
opening of tens of micrometres and a minimal taper over a length of over 1.5 cm. The microneedle
262
was loaded via the unpulled end with sterile water, using a syringe and hypodermic needle and
263
capillary sealant used on the unpulled opening to prevent flow or evaporation in the microneedle. A
264
sample chamber was made by placing an adhesive vinyl spacer (80 micrometres thick, 1.5 cm in
265
diameter with a 1cm hole and a notch cut out) onto a glass microscope slide. The chamber was filled
266
with cells and a cover glass placed on top. The microneedle was directed under the coverslip, through
267
the notch into the sample (Figure 3A). A drop of immersion oil was placed on the coverslip. The
268
opening of the microneedle and surrounding cells were imaged under the x100 objective lens in
269
advance of optical tweezing.
270
2.3.2. PDMS chip
271
Cell isolation chips were fabricated with polydimethyl siloxane (PDMS) on a microstructured
272
mould. A schematic of the method is shown in figure 4. Polydimethylsiloxane (PDMS) is a polymer
273
that can be easily moulded into custom designs. Its optical transparency and gas-permeability make
274
it particularly attractive for studying cells.
275
Patterns of channels and chambers required for cell isolation were generated using AutoCAD
276
and transferred to a chromium (Cr)-on silicon glass plate mask with a resolution of 4 µm (by
277
JDPhotodata). This mask was used to create a relief of the chip structure using photoresist (AZ 2070)
278
spin-coated at 750 RPM to a thickness of approximately 15 µm on a silicon wafer. The AZ 2070
279
substrate was soft-baked on a contact hotplate at 100°C for one minute and left overnight to evaporate
280
the solvent and to increase the density of the film. The mask was placed on the wafer using a
contact-281
aligner and the photoresist was exposed to UV light for one minute, followed by a post-exposure
282
bake. Finally, the wafer was developed in AZ 726 MIF Developer. The mould was placed in a
close-283
fitting container and drop of Sigmacote was added offset from the channel structures. A lid was
284
placed on the container and left for 30 minutes for the Sigmacote to evaporate, forming a hydrophobic
285
layer on the mould. A 10:1 mixture of PDMS Sylgard 184 PDMS prepolymer and curing agent was
286
made. This was poured onto the mould then dried overnight at room temperature to generate a
287
negative relief of the photoresist mould. Once set, the PDMS block was cut from the mould using a
288
scalpel and inlet and outlet holes were made in the block using a biopsy needle. The PDMS block was
289
bonded to a clean cover glass by placing both block (channel side up) and coverglass in a reactive ion
290
etcher (Plasmalab System100, Oxford Instruments) and upon removal, pressing them together with
291
a gentle force. They are stuck together with the channel structure facing towards the glass slide,
292
294
Figure 4: Soft lithography process for making PDMS devices
295
296
Once bonded, the chips were prepared by flushing the channels and chambers with water,
297
media, or buffer via a syringe pump connected to a glass capillary inserted into one of the inlets.
298
Finally, 2 µl of cells were injected into one inlet using a pipette. A microscope slide was placed on top
299
to seal the device. A drop of immersion oil is placed over the channel structures on the coverglass
300
side of the device and channels are inspected using a microscope to ensure chambers and channels
301
are filled with water and ready for cell isolation experiments.
302
The design of the structure comprises two main channels of width 350 µm, with 1 mm diameter
303
inlets at either end. Along the length of these larger channels are a series of smaller (30 µm wide)
304
meandering channels ending with an isolation chamber. The chamber dimensions depend on the
305
type of cell to be isolated, and for yeast cells were designed to be 150 µm diameter (Figure 3C) with
306
a volume of approximately 3.375 x105 µm3.
307
2.3.3. Ultrafast laser inscription and selective chemical etching of cell isolation chambers
308
A third type of device in which to optically tweeze and isolate cells was made using channels
309
and chambers made in fused silica. The chips were fabricated using the technique of ultrafast laser
310
inscription (ULI) to write the channel structures in fused silica, followed by selective chemical etching
311
of the modified structure, resulting in a surface network of channels and chambers on the fused silica,
312
as seen in figure 3D. This fabrication technique has been previously described [46, 47]. The channels
313
were filled with water by pipetting and a 2 l cell sample was added at one end of the main channel.
314
A coverglass was placed on top and a drop of immersion oil was added, above the channel structures.
315
The technique of ULI offers a unique capability to write surface microfluidics, so a
sub-316
surface channel was also made using the same technique in order to quantify the ability to optically
317
tweeze cells in buried channels. The channel can be seen in Figures 3E and F.
318
3. Results and discussion
322
3.1.Tweezing characterisation
323
The maximum velocities that yeast cells could be tweezed at a range of laser powers were
324
measured to gauge the speed that cells could be manipulated through the isolation devices and also
325
to estimate the force exerted on the cells. Experiments were performed in a device as shown in Figure
326
3A, without the micropipette present. As expected, the maximum velocity a cell could be tweezed
327
scaled linearly with laser power (Figure 5).
328
329
Figure 5: Average critical velocity of approximately 20 cells for different optical powers.
330
331
At a power of approximately 2 mW at the focal spot the average maximum velocity a cell could
332
be tweezed was 0.024 mm/s, whereas at approximately 20 mW the average maximum velocity was
333
0.36 mm/s, indicating that single cells may be rapidly selected and isolated using optical tweezers.
334
Using higher laser tweezer powers of 300 mW from a 1064 nm Nd:YAG laser we note that yeast cells
335
can be tweezed at 2.5 mm/s. Forces used in this work have ranged from 1 pN to 40 pN, with laser
336
powers of 2 mW to 40 mW, respectively, calculated using critical velocity, in Stokes’ Drag equation
337
(1). Faxen’s correction (2) and the ellipsoidal shape corrections to Stokes’ drag force (3) and (4)result
338
in negligible changes as shown in table 1, primarily because the aspect ratio of yeast cells is not
339
usually greater than two except when a daughter cell is in the process of budding. In addition, the
340
tweezed cells are lifted using the optical tweezer to the centre of the channel so are at a distance of at
341
least four times the cell diameter away from a wall.
342
343
Table 1: Stokes’ drag forces with no correction applied (FD) (1) and with Faxen’s correction (Fc)
344
(2) and ellipsoidal shape correction ( (3) and (4)) applied. a = minor axis (cell width), b = major
345
347
We have plotted cell length (b), cell width (a), cell area (measured in ImageJ) and aspect ratio
348
(b/a) against the critical velocities of cells for a variety of laser powers (Figure 6A, B, C and D
349
respectively) and see that all four cell parameters scale with critical velocity and that shorter,
350
narrower cells with aspect ratios closer to one can be tweezed with larger velocity.
351
352
Figure 6: Yeast cell dimensions plotted against critical velocity, vc. A: Cell length (b) vs critical
353
velocity (vc), B: cell width (a) vs vc, C: cell area vs vc, D: Aspect ratio (b/a) vs vc. Lines act as a guide to
354
the eye.
355
356
Figure 6 shows that as b, a, area and aspect ratio of cell increase, the maximum velocity that a
357
cell can be tweezed decreases. Unsurprisingly, cells with a large, attached, daughter cell have an
358
aspect ratio greater than 1.5 due to their longer length, b, compared to single cells, but similar sized
359
minor axis, a, and as such are more difficult to tweeze than single cells. Changing the objective lens
360
from an NA of 1.3 to lower NA values of 0.65 and 0.85 (Newport) and using a relatively high power
361
are required to manipulate the cells the necessary distances in isolation devices. Using a numerical
363
aperture of 1.3 and higher powers (40 mW) resulted in maximum velocities up to 0.77 mm/s and thus
364
exposure times of only seconds for cell isolation are possible in isolation experiments.
365
366
3.2 Tweezing in isolation devices
367
At 40 mW of laser tweezers power, S. cerevisiae cells could be manipulated at a maximum
368
velocity of 0.77 mm/s in the chip shown in figure 3A. The depth of this sample is 80 µm and cells are
369
well away from any boundary until they are moved close to the micropipette within the device, in
370
which case the user moves more slowly to manipulate the cell through the channel opening. Cells
371
were relatively easily prepared and isolated using tweezers by manipulating the cell into a pulled
372
glass micropipette (figure 7A-C).
373
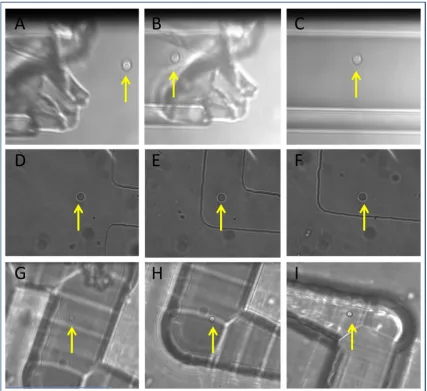
374
375
Figure 7: Tweezing and isolation in 3 devices A: Micropipette, B: PDMS chip, C; ULI chip. The
376
diameter of yeast cells (highlighted by yellow arrow) is approximately 5 µm.
377
378
Removing the micropipette from the device and ensuring that the isolated cell could be used to
379
re-seed a new culture was problematic however was achieved with single cyanobacteria (video S2),
380
of similar dimensions to yeast. The contents of the micropipette were dispensed into a microfuge tube
381
other bacteria present. Although a culture of cyanobactera grew from the isolated cell, it was
383
contaminated with environmental bacteria. This means that a second step to the isolation process
384
may be required to remove the contaminants, such as UV exposure, which may be detrimental to the
385
cells of interest, or by tweezing out individually contaminants as soon as they are observed.
386
Occasionally flow was observed in the micropipette and when removing from the device, relatively
387
large mechanical forces would exacerbate this flow. Single bacteria (B. subtilis) were also isolated into
388
a micropipette using this method (video S3), and again, large mechanical forces experienced by the
389
micropipette upon removal made it problematic to reseed a pure culture.
390
At the same power, within the main channel of a PDMS chip (such as that shown in figure 3B)
391
the maximum velocity was measured to be 0.24 mm/s. The channel height in these devices is only 15
392
µm so the lower maximum speed is due to the closeness of the cell and a wall. The PDMS surface
393
may undulate, knocking the cell out of the trap as it is translated, or the trapped cell may occasionally
394
bump into an untrapped cell. This could be avoided by making deeper and wider channels in future.
395
Single yeast cells were isolated in the PDMS device (figure 7D-F). A cell was selected in the main
396
channel (figure 7D), tweezed though the meandering channel (figure 7E) and deposited in the
397
isolation chamber (figure 7F, video S4). Upon cell isolation in the PDMS chip, observation of the
398
chamber over two days did not reveal any flow or movement of other cells into the chamber. A
399
noticeable loss of liquid was observed after three days, and the chamber dried out. This needs to be
400
taken into consideration if one intends to observe the dynamics of microorganisms for longer than
401
three days. Bacteria could also be loaded into the main channel via an inlet and tweezed into the
402
isolation chamber (video S5 shows two B. subtilis cells isolated together).
403
In the ULI sub-surface chip (as seen in figure 3E and F) the maximum velocity was 0.37 mm/s.
404
In this case the cell was translated in a channel 100 um wide and deep, so could be kept well away
405
from any surface, however the roughness of the etched glass at the top of the channel through which
406
the tweezing beam must be directed is visible in figure 3F, and results in beam aberration. This could
407
be mitigated by annealing the channels after etching, to smooth the rough structures. Preparing the
408
cell sample in the isolation device shown in Figure 3C was problematic as the channels were written
409
on the surface of fused silica, not sub-surface, and a coverglass was placed on top after loading with
410
sample. The coverglass displaced the sample such that it was difficult to contain the cells in the main
411
channel and prevent them from entering the meandering channels. This was achieved with a single
412
yeast cell only after many attempts (Figure 7 G-I), however fabricating a more complex design, similar
413
to figure 3D in a sub-surface chip with inlets and outlets may lead to a more readily contained sample.
414
A point to note here is that, unlike PDMS, fused silica is not gas permeable, so isolation chips made
415
in this way will facilitate studies with obligate anaerobic microorganisms where absence of oxygen
416
is required in the microenvironment. Very few studies have been published using these organisms,
417
but they are abundant in nature and important for medical and industrial processes [48]. From this
418
study PDMS devices proved the most successful of the three devices to work with in combination
419
with optical tweezers for single cell isolation. To further demonstrate the applicability to single cell
420
studies, and the study of dynamics of small numbers of cells, arrays of cells were created. Figure
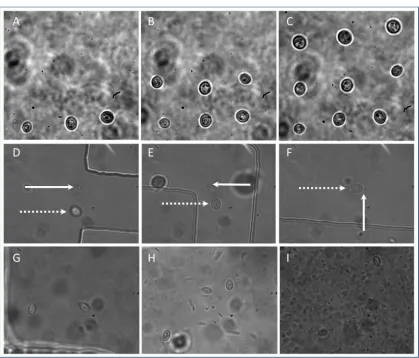
8A-421
C shows stages of the creation of a 3 x 3 array of yeast cells.
422
424
Figure 8: Setting up co-culture, A-C: the creation of a 3x3 array of yeast cells, D-F: a single yeast
425
(dashed arrow) and single bacteria (solid arrow) tweezed through meandering channel in PDMS
426
device into isolation chamber, G: Two yeast cells deposited by optical tweezers into PDMS isolation
427
chamber at t =0, H: t = 1 day showing three yeast cells and bacterial contamination, I: t= 5 days, two
428
yeast cells are visible, the third is at the edge of the chamber and bacteria are numerous.
429
430
The average diameter of the cells is 5 µm and they are spaced approximately 10 µm apart. Each
431
cell was exposed to 25 mW of laser power for tens of seconds. Time lapse imaging shows that in this
432
environment (water, 30°C) they do not drift out of the 50 µm field of view for at least 15 minutes
433
(video S6, one frame/30 seconds). A more viscous environment may be used to prevent drifting, the
434
chambers may be coated to enable cells to stick in place, or a smaller chamber may be used. To fix
435
cells in position an SLM may be used to create a pattern of traps in 2D or 3D and the surrounding
436
media may be polymerized [49]. This yeast array is constructed of cells from the same population,
437
however co-cultures of cells from different populations may be created. A single yeast cell and a
438
single bacterium have been tweezed together into an isolation chamber to demonstrate that different
439
cell types may be loaded into the device to establish a co-culture (figure 8D-F). Bacteria were pipetted
440
into one of the inlets (in figure 3B) and yeast were pipetted into a second inlet. A single cell of each
441
type is brought to the opening of a meandering channel (figure 8D) and both are transported into an
442
isolation chamber (figure 8F). This has great potential for setting up microconsortia to study the
443
impact on the field of synthetic biology and industrial biotechnology [50] and understanding disease
445
[2].
446
Sterility is an important factor as figure 8G-I shows contamination of a yeast cell co-culture of
447
two cells by an unidentified bacteria. There is no indication that there is contamination on day zero
448
(figure 8G) when the co-culture is established, but by day 5 (figure 8I) the bacteria are numerous and
449
yeast dynamics can no longer be observed. Microbiological aseptic technique was not adhered to in
450
this case but should be implemented in future experiments to avoid contamination of cultures.
451
452
3.3 S. cerevisiae doubling time
453
454
The laser power used and duration a cell is exposed to the tweezing beam dictates the total
455
energy incident upon the particle, which contributes to the extent of both photothermal and
456
photochemical damage sustained. It is know that shock responses in cells can lead to changes in
457
characteristic cell cycle features because they transiently inhibit the mechanisms of cell division and
458
it has also been considered that optical trapping prevents free movement of molecules which play a
459
dynamic role in cell division [30]. As a measure of damage to cell by the tweezing laser we have
460
plotted the time it takes a small number of tweezed cells to begin budding, compared to untweezed
461
controls which have not been exposed to any laser radiation (Figure 9A and B). We have also plotted
462
the duration of the budding event, defined as the time from when a bud is first observed in the time
463
lapse images until the time in which the daughter cell separates from the mother cell, for tweezed
464
cells and untweezed controls (Figure 9C and D). Cells were not synchronized, so single cells of similar
465
size with no visible bud were selected for tweezing.
466
467
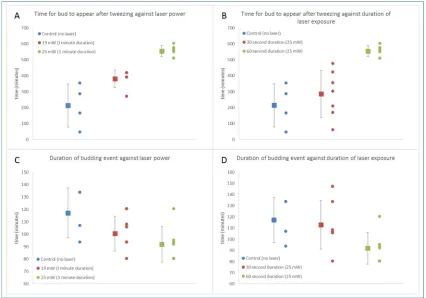
Figure 9: A: Time for S. cerevisiae bud to appear on mother cell surface after tweezing for three
468
laser powers (0, 19 and 25 mW). B: Time for bud to appear for three 25 mW laser durations (0s, 30
469
bud on surface of mother cell until daughter cell detached from mother cell, for three laser powers
471
(0, 19 and 25 mW), D: Duration of budding event for cell exposed to 25 mW laser of different duration
472
(0, 30 and 60 seconds).
473
474
Figures 9A and C show results for cells exposed to no laser beam (Control n=4), cells exposed to
475
19 mW for 60 seconds (n=6) and cells exposed to 25 mW for 60 seconds (n=7). The average time to
476
bud after tweezing, with error bars showing standard deviation, is plotted to the left of the data points
477
in figure 9A, and similarly for the average time of the budding event in figure 9C. The time for
478
budding to occur in the asynchronous yeast cells that were not tweezed (control (no laser)) was on
479
average 213 minutes. Even with the small number of cells measured, this is comparable to 207
480
minutes measured by Leitao and Kellog [51] for yeast cells growing in a nutrient -poor environment.
481
Cells tweezed at 19 mW have a longer average time until budding of 381 minutes and cells tweezed
482
at 25 mW for the same duration of 60 seconds have a longer time of 554 minutes until the appearance
483
of a bud. The duration of the budding event, measured from when the bud first appears until when
484
the daughter cell detached from the mother (Figure 9C) in untweezed control cells was 117 minutes
485
(n=4) and again this is similar to Leitao and Kellog’s measurement of 60 minutes for cells in a
nutrient-486
poor medium. We note that they measure the duration of metaphase and anaphase of the cell cycle,
487
whereas we measure the full budding event which begins in G2 and ends with cytokinesis, hence our
488
measured time is longer. There is not any significant difference in the duration of the budding event
489
between the control cells, and those exposed to 19 mW (100 minutes, n=6) and 25 mW (92 minutes,
490
n=7) (Figure 9C). When the exposure time to the laser beam is zero, 30 seconds (at 25 mW) or 60
491
seconds (also at 25 mW) we see an increase in the time taken for the cell to bud with an increase in
492
exposure time (figure 9B). As already mentioned, it takes on average of 213 minutes for the control
493
cells to produce a bud, 286 minutes for the cells exposed for 30 seconds (n=7) and 554 minutes for the
494
cells exposed to 60 seconds (n=7) to produce an observable bud. Increasing the duration of laser
495
exposure does not significantly impact on the duration of the budding event (figure 9D), with control,
496
30 second and 60 seconds taking an average time of 117 minutes (n=4), 113 minutes (n=7) and 92
497
minutes (n=7). Recent work by Pilat et al has shown that tweezing S. cerivisiae in a 1064 nm optical
498
trap with 19 mW of laser power for 15 minutes resulted in no delay of reproduction although it did
499
reduce the mean cell size [52]. We did not measure cell size in this experiment so cannot comment on
500
how our tweezing parameters affect cell size. Pilat et al also showed that at 38 mW there was a
501
significant delay in reproduction and at powers above 76 mW half of all tweezed cells died. Taking
502
into account the energy deposited on the cell (laser power x trapping time), we have plotted energy
503
505
Figure 10: The dependence on total laser energy of time for bud to appear on tweezed cell, and
506
the duration of the budding event.
507
508
There is no notable difference in the budding time for the laser parameters tested. With further
509
study it may become evident that the size of the daughter bud (or the growth rate of the daughter
510
cell) is also affected. The time for a bud to appear after tweezing does increase in an energy dependent
511
manner, with buds taking longer to appear if the mother cell was exposed to a higher laser energy.
512
At 1.5 J this become particularly evident. Ayano et al. found, when tweezing E.coli with 1064 nm, cell
513
division activity was normal when the total energy was less than 0.36 J, whereas 1.06 J of total energy
514
stopped cell division [30]. Recent work [51] found S. cerevisiae in a nutrient-rich environment tolerant
515
to laser powers of 38 mW for 15 minutes (34 J), where 7% of cell died and trapped cells showed a less
516
than 20% increase in the time between the first bud and the second bud appearing on the mother cell
517
(114 minutes compared to 135 minutes). The delay in bud appearance that we observe is likely to be
518
induced by a checkpoint- induced delay which slows the cell cycle to allow correction of aberrant
519
DNA structures and incomplete kinetochore assembly and thus protects genomic integrity.
520
521
4. Conclusions
522
523
Whilst higher powers will result in faster tweezing and isolation, a power of around 25 mW of
524
785 nm exposed to a cell for one minute is sufficient for isolation and subsequent division of yeast
525
cells. Cells are readily prepared and isolated using optical tweezers in PDMS devices consisting of
526
the design shown in figure 3B and C, whereas glass microneedle channels and laser written channels
527
on the surface of fused silica posed challenges for sample preparation and isolating single cells from
528
the population. PDMS and ULI chips have the potential to integrate microfluidics in which case cell
529
perfusion may be controlled in a manner to interrupt or induce cell growth using selected media. By
530
integrating microfluidics a single cell can be subject to many microenvironments without being
531
removed from the field of view of the microscope and subsequent dynamics can be studied in real
532
time. These devices are also ameanable to functionalization with heaters, electrodes and sensors,
533
Considering that for many users and applications cell viability is ranked higher than throughput
535
when desirable benefits of single cell isolation technologies are listed [6] the full potential of optical
536
tweezers remains to be realized in this field.
537
538
Supplementary Materials: The following are available online at www.mdpi.com/xxx/s1, Video S1: title, Video
539
S2: title, Video S3: title, Video S4: title, Video S5: title, Video S6: title.
540
Author Contributions: Conceptualization, methodology, supervision, investigation, analysis and writing LP;
541
Software and investigation and analysis, O.A.; investigation and analysis, A.K. and D.R.
542
Funding: The research leading to these results has received funding from the European Union Seventh
543
Framework Programme (FP7/2007–2013) under grant agreement n° 311975. This publication reflects the views
544
only of the author, and the European Union cannot be held responsible for any use which may be made of the
545
information contained therein.
546
Acknowledgments: The authors thank Pierre Henri-Thiollier, Prof Gerard Markx, and Jochen Schuster for
547
providing initial PDMS device designs, Neil Ross for assistance in the clean room and Prof Ajoy Kar for ULI
548
laser machining and chemical etching facility and expertise. We also thank Prof Charles Cockell and Sarah
549
Brown, University of Edinburgh for cyanobacteria samples, William Ramsay, Calum Ross, Dr Mike Winson and
550
Isabella McKenna for experimental contributions and Ross McRae for contribution to results analysis.
551
D. Risbridger thanks The Carnegie Trust for a vacation scholarship. O. Anderson thanks Thorlabs APT
552
(Advanced Positioning Technology) for providing guidance for computer operation of the motorised stage, laser
553
driver and camera.
554
Conflicts of Interest: The authors declare no conflict of interest.
555
References
556
1. DiCarlo, D. and Lee, L.P. Dynamic single cell analysis for quantitative biology. Anal. Chem. 2006, 78, 7918–
557
7925, DOI: 10.1021/ac069490p.
558
2. Mohan, R., Sanpitakseree, C., Desai, A.V., Sevgen, S.E., Schroeder, C.M. and Kenis, P.A.J. A microfluidic
559
approach to study the effect of bacterial interactions on antimicrobial susceptibility in polymicrobial
560
cultures. RSC Adv. 2015, 5, 35211, DOI: 10.1039/c5ra04092b.
561
3. Gierahn, T.M., Wadsworth, M.H., Hughes, T.K., Bryson, B.D., Butler, A., Satija, R., Fortune, S., Love, J.C.
562
and Shalek, A.K. Seq-Well: portable, low-cost RNA sequencing of single cells at high throughput. Nature
563
Methods 2017, 14, 395, DOI: 10.1038/nmeth.4179.
564
4. L’Haridon, S., Markx, G.H., Ingham, C.J., Paterson, L., Duthoit, F. and Le Blay, G. New Approaches for
565
Bringing the Uncultured into Culture. Marine Microbiome, An Untapped Source of Biodiversity and
566
Biotechnological Potential 2016, Chapter 15, Editors: Stal, L.J. and Cretoiu, M.S. (Eds.) Springer.
567
5. Barber, M.A. Use of the single cell method in obtaining pure cultures of anaerobes. J. Exp. Med. 1920, 32,
568
295-311.
569
6. Gross, A., Schoendube, J., Zimmermann, S., Steeb, M., Zengerle, R., and Koltay, P. Technologies for
Single-570
Cell Isolation. Int. J. Mol. Sci. 2015, 16, 16897-16919.
571
7. Johnstone, K.I. The isolation and cultivation of single organisms. Methods in Microbiology 1969, 1, Norris, J.
572
R. and Ribbons, D. W. (Eds.). Academic Press, Inc., New York, NY.
573
8. Frohlich, J. and Konig, H. New techniques for isolation of single prokaryotic cells. FEMS Microbiology
574
Reviews 2000, 24, 567-572.
575
9. Emmert-Buck, M.R., Bonner, R.F., Smith, P.D., Chuaqui, R.F., Zhuang, Z., Goldstein, S.R., Weiss, R.A. and
576
Liotta, L.A. Laser Capture Microdissection. Science, 1996, 274, 998-1001, DOI: 10.1126/science.274.5289.998.
577
10. Kang, Y., McMillan, I., Norris, M.H. and Hoang, T.T. Single prokaryotic cell isolation and total transcript
578
amplification protocol for transcriptomic analysis. Nature Protocols 2015, 10, 974-84, DOI:
579
10.1038/nprot.2015.058.
580
11. Hulett, H.R., Bonner, W.A., Barrett, J. and Herzenberg, L.A. Cell sorting: automated separation of
581
12. Wang, A., Middlebrook, A., Pennebaker, K., Chang, C., Shum, E., Fan, C. and Weaver, S. A Complete
583
Workflow from Single Cell Isolation to mRNA Sequencing Analysis, Complete Workflow from Single Cell
584
Isolation to mRNA Sequencing Analysis. 2016, www.bd.com/genomics, white paper.
585
13. Davey, H.M. and Winson, M.K. Using flow cytometry to quantify microbial heterogeneity. Cur. Issues. Mol.
586
Biol. 2003, 5, 9-15.
587
14. Connell, J.L., Wessel, A.K., Parsek, M.R., Ellington, A.D., Whiteley, M. and Shear, J.B. Probing Prokaryotic
588
Social Behaviors with Bacterial “Lobster Traps”. mBio 2010, 1, DOI:10.1128/mBio.00202-10.
589
15. Probst, C., Grünberger, A., Wiechert, W., Kohlheyer, D. Polydimethylsiloxane (PDMS) Sub-Micron Traps
590
for Single-Cell Analysis of Bacteria. Micromachines 2013, 4, 357-369, DOI: 10.3390/mi4040357.
591
16. Lu, H., Caen, O., Vrignon, J., Zonta, E., El Harrak, Z., Nizard, P., Baret, J.-C. and Taly, V. High throughput
592
single cell counting in droplet-based microfluidics. Scientific Reports, 2017, 7, 1366.
593
17. Mazutis, L., Gilbert, J., Ung, W.L., Weitz, D.A. and Heyman, J.A. Single-cell analysis and sorting using
594
droplet-based microfluidics. Nature Protocols, 2013, 8, 870–891.
595
18. Applegate, R.W., Squier, J., Vestad, T., Oakey, J., Marr, D.W., Bado, P., Dugan, M.A. and Said, A.A.
596
Microfluidic sorting system based on optical waveguide integration and diode laser bar trapping. Lab Chip,
597
2006, 6, 422-6.
598
19. Jakobsson, O., Grenvall, C., Nordin, M., Evander, M. and Lauell, T. Acoustic actuated fluorescence
599
activated sorting of microparticles. Lab Chip, 2014, 14, 1943-50, DOI: 10.1039/c3lc51408k.
600
20. Evander, M., Johansson, L., Lilliehorn, T., Piskur, J., Lindvall, M., Johansson, S., Almqvist, M., Laurell, T.
601
and Nilsson, J. Noninvasive acoustic cell trapping in a microfluidic perfusion system for online bioassays.
602
Anal. Chem. 2007, 79, 2984–91.
603
21. Voldman, J. Electrical forces for microscale cell manipulation. Annu Rev Biomed Eng. 2006, 8, 425-54.
604
22. Zborowski, M. and Chalmers, J.J. Magnetic Cell Sorting. Immunochemical Protocols, Burns, R. (Eds)
605
Methods In Molecular Biology, 2005, 295, Humana Press, DOI: 10.1385/1-59259-873-0:291.
606
23. Wyatt Shields, C., Reyes, C.D. and Lopez, G.P. Microfluidic Cell Sorting: A Review of the Advances in the
607
Separation of Cells from Debulking to Rare Cell Isolation. Lab Chip, 2015, 15, 1230-1249, DOI:
608
10.1039/c4lc01246a.
609
24. Ashkin, A., Dziedzic, J.M. and Yamane, T. Optical trapping and manipulation of single cells using infrared
610
laser beams. Nature 1987, 330, 769–771.
611
25. Liu, Y., Cheng, D.K., Sonek, G.J., Berns, M.W., Chapman, C.F. and Tromberg, B.F. Evidence for localized
612
cell heating induced by infrared optical tweezers. Biophys. J. 1995, 68, 2137–2144.
613
26. Liang, H., Vu, K.T., Krishnan, P., Trang, T.C., Shin, D., Kimel, S. and Berns, M.W. Wavelength dependence
614
of cell cloning efficiency after optical trapping. Biophys. J. 1996, 70, 1529–1533.
615
27. Liu, Y., Sonek, G.J., Berns, M.W. and Tromberg, B.J. Physiological monitoring of optical trapped cells:
616
assessing the effects of confinement by 1064-nm laser tweezers using microfluorometry. Biophys. J. 1996,
617
71, 2158–2167.
618
28. Neuman, K.C., Chadd, E.H., Liou, G.F., Bergman, K. and Block, S.M. Characterization of photodamage to
619
Escherichia coli in optical traps. Biophys. J. 1999, 77, 2856–2863.
620
29. Leitz, G., Fallman, E., Tuck, S. and Axner, O. Stress response in Caenorhabditis elegans caused by optical
621
tweezers: wavelength, power, and time dependence. Biophys. J. 2002, 82, 2224–2231.
622
30. Ayano, S., Wakamoto, Y., Yamashita, S. and Yasuda, K. Quantitative measurement of damage caused by
623
1064-nm wavelength optical trapping of Escherichia coli cells using on-chip single cell cultivation system.
624
Biochemical and Biophysical Research Communications 2006, 350, 678–684.
625
31. Haro-González, P., Ramsay, W.T., Maestro, L.M., del Rosal, B., Santacruz-Gomez, K., Iglesias-de la Cruz,
626
M., Sanz-Rodríguez, F., Choo, J.Y., Rodriguez Sevilla, P., Bettinelli, M., Choudhury, D., Kar, A.K., Solé, J.G.,
627
Jaque, D. and Paterson, L. Quantum Dot-Based Thermal Spectroscopy and Imaging of Optically Trapped
628
Microspheres and Single Cells. Small, 2013, 9, 2162-70. DOI: 10.1002/smll.201201740.
629
32. Grover, S.C. Skirtach, A.G., Gauthier, R.C. and Grover, C.P. Automated single-cell sorting system based
630
on optical trapping. Journal of Biomedical Optics 2001, 6, 14–22.
631
33. Wakamoto, Y., Umehara, S., Matsumura, K., Inoue, I. and Yasuda, K. Development of non-destructive,
632
non-contact single-cell based differential cell assay using on-chip microcultivation and optical tweezers.
633
Sensors and Actuators B 2003, 96, 693–700.
34. Umehara, S., Inoue, I., Wakamoto, Y. and Yasuda, K. Origin of Individuality of Two Daughter Cells during
635
the Division Process Examined by the Simultaneous Measurement of Growth and Swimming Property
636
Using an On-Chip Single-Cell Cultivation System. Biophysical Journal, 2007, 93, 1061–1067.
637
35. Enger, J., Goksör, M., Ramser, K., Hagberg, P. and Hanstorp, D. Optical tweezers applied to a microfluidic
638
system. Lab Chip, 2004, 4, 196–200.
639
36. Eriksson, E., Enger, J., Nordlander, B., Erjavec N., Ramser, K., Goksör, M., Hohmann, S., Nyström, T.
640
and Hanstorp, D. A microfluidic system in combination with optical tweezers for analyzing rapid and
641
reversible cytological alterations in single cells upon environmental changes. Lab Chip, 2007, 7, 71–6.
642
37. Eriksson, E., Sott, K., Lundqvist, F., Sveningsson, M., Scrimgeour, J., Hanstrop, D., Goksor, M. and Graneli,
643
A. A microfluidic device for reversible environmental changes around single cells using optical tweezers
644
for cell selection and positioning. Lab Chip, 2010, 10, 617–25.
645
38. Kasukurti, A., Potcoava, M., Desai, S.A., Eggleton, C. and Marr, D.W.M. Single cell isolation using a DVD
646
optical pickup. Opt. Express 2011, 19, 10377.
647
39. Wang, X., Chen, S., Kong, M., Wang, Z., Costa, K.D., Li, R.A. and Sun, D. Enhanced cell sorting and
648
manipulation with combined optical tweezer and microfluidic chip technologies. Lab Chip, 2011, 11, 3656.
649
40. Wang, X., Gou, X., Chen, S., Yan, X. and Sun, D. Cell manipulation tool with combined microwell array
650
and optical tweezers for cell isolation and deposition. J. Micromech. Microeng. 2013, 23, 075006.
651
41. Probst, C., Grunberger, A., Wiechert, W. and Kohlheyer, D. Microfluidic growth chambers with optical
652
tweezers for full spatial single-cell control and analysis of evolving microbes. J. Microbiol Methods 2013, 95,
653
470-6, DOI: 10.1016/j.mimet.2013.09.002.
654
42. Fidleris, V., and Whitmore, R.L. Experimental determination of the wall effect for spheres falling axially in
655
cylindrical vessels. Br. J. Appl. Phys. 1961, 12, 490.
656
43. Happel, J., and Brenner, H. Low Reynolds number hydrodynamics with special applications to particulate
657
media. 1965, Springer.
658
44. Hensley, Z.D. and Papavassiliou, D.V. Drag Coefficient Correction for Spherical and Nonspherical Particles
659
Suspended in Square Microducts. Ind. Eng. Chem. Res. 2014, 53, 10465−10474, DOI: 10.1021/ie5007646.
660
45. Srivastava, D.K., Yadav, R.R. and Srivastava, N. Oseen’s correction to Stokes drag on axially symmetric
661
particle in micropolar fluid. Int. J. Adv. Appl. Math. and Mech. 2016, 3, 41 – 78.
662
46. Choudhury, D., Ramsay, W.T., Kiss, R., Willoughby, N.A., Paterson, L. and Kar, A.K. A 3D mammalian
663
cell separator biochip. Lab Chip, 2012, 12, 948.
664
47. Keloth, A., Three dimensional optofluidic devices for manipulation of particles and cells, Thesis, Heriot
665
Watt University, 2017.
666
48. Steinhaus, B., Garcia, M.L., Shen, A.Q. and Angenent, L.T. A Portable Anaerobic Microbioreactor Reveals
667
Optimum Growth Conditions for the Methanogen Methanosaeta concilii. Applied and environmental
668
microbiology, 2007, 73, 1653–1658, DOI: 10.1128/AEM.01827-06.
669
49. Jordan, P., Leach, J., Padgett, M.J., Blackburn, P., Isaacs, N., Goksor, M., Hanstorp, D., Wright, A., Girkin,
670
J. and Cooper, J. Creating permanent 3D arrangements of isolated cells using holographic optical tweezers.
671
Lap Chip, 2005, 5, 1224-8, DOI: 10.1039/b509218c.
672
50. Braff, D., David Shis, D. and Collins, J.J. Synthetic biology platform technologies for antimicrobial
673
applications. Advanced Drug Delivery Reviews 2016, 105, 35–43.
674
51. Leitao, R.M. and Kellog, D.R. The duration of mitosis and daughter cell size are modulated by nutrients in
675
budding yeast. J. Cell. Biol. 2017, 216, 3463-3470.
676
52. Pilát, Z., Jonáš, A., Ježek, J. and Zemánek, P. Effects of Infrared Optical Trapping on Saccharomyces