Breast Cancer: Targets and Therapy
Dove
press
O r i g i n a l r e s e a r C h
open access to scientific and medical research
Open access Full Text article
Breast carcinomas: variations in sonoelastographic
appearance
eduardo de Faria Castro Fleury1
Maria do Carmo guedes alcoforado assunção-Queiros2
Decio roveda Jr1
1Faculdade de Cências Médicas da
santa Casa de são Paulo, são Paulo, Brazil; 2Faculdade de Medicina
da Universidade de são Paulo, são Paulo, Brazil
Background: This study assessed factors influencing the sonoelastographic presentation of breast carcinoma.
Methods: A prospective collaborative study was conducted by the Santa Casa de São Paulo and CTC-Center, on 540 breast lesions in women referred for percutaneous breast biopsy. Eighty-four carcinomas showing lesions on ultrasonography were included. These lesions were classified into four sonoelastographic scores, where scores of 1, 2, and 3 were considered false-negative, and a score of 4 was considered true-positive. Scores were compared against histopathologic results, which were divided into two groups, ie, soft lesions (group 1) and hard lesions (group 2). False-negative and true-positive results were also assessed for variation according to patient age and mean lesion diameter.
Results: Of the 84 lesions studied, nine yielded false-negative results on sonoelastography and 75 yielded true-positive results. In terms of histopathologic classification, eight were assigned to group 1 and 76 to group 2. The chi-squared test showed a correlation between sonoelastographic scores and histopathologic lesion type. No statistically significant differences were observed according to patient age or largest lesion diameter.
Conclusion: Our results revealed an association between sonoelastographic presentation of breast lesions and histology. False-negative results on sonoelastography were influenced by histologic type of lesion and not by lesion size or patient age.
Keywords: ultrasound, breast, carcinoma, elastography
Introduction
In recent years, sonoelastography has become an increasingly important auxiliary tool for assessing breast lesions detected on ultrasonography.1–4 The method is still being developed, so its applicability in clinical practice remains a matter of debate in the scientific community and its role in the study of these lesions is unclear. The technique was initially employed to differentiate between benign and malignant lesions, but is now being applied to assess probably benign lesions.5,6
Some studies have reported that sonoelastography provides no additional informa-tion to ultrasonographic diagnosis of breast carcinoma, since its diagnostic accuracy is similar to that of conventional ultrasound,7 while other investigations have shown the method to be applicable only for detecting lesions less than 2.0 cm in size.8 The main limitations to the clinical applicability of sonoelastography are interobserver variation and false-positive results.9
Breast carcinomas are found in around 20% of ultrasound-guided percutaneous breast biopsies.6,10 These carcinomas tend to have typical features of malignancy with a Correspondence: eduardo F C Fleury
Faculdade de Ciências Médicas da santa Casa de são Paulo, rua Dr Cesário Motta Jr, 61 são Paulo, sP 01221-020, Brazil email [email protected]
Breast Cancer: Targets and Therapy downloaded from https://www.dovepress.com/ by 118.70.13.36 on 20-Aug-2020
For personal use only.
Number of times this article has been viewed
This article was published in the following Dove Press journal: Breast Cancer: Targets and Therapy
Dovepress
Fleury et al
high positive predictive value, such as irregular margins that yield a positive predictive value of 86% on ultrasonography.11 Other data that should be assessed include shape, margins, orientation, echotexture, posterior acoustic features, relation-ship with surrounding tissue, and vascularization.12 However, some carcinomas can present as probably benign lesions on ultrasonography and are generally classified as BI-RADS® (Breast Imaging and Reporting Data System) category 3, leading to false-negative results.13,14 These lesions are usually related to specific tumor types, such as medullary, mucinous, and papillary carcinomas.
Approximately 95% of breast cancers are epithelial carci-nomas, where 80% of these are ductal carcicarci-nomas, 10% are lobular carcinomas, 5% are other carcinoma subtypes such as mucinous, papillary and medullary, with the remaining 5% being stromal tumors and metastases. Ductal carcinomas can be in situ or invasive.15 The in situ carcinomas are con-sidered premalignant lesions because they do not have focal invasion of tumor cells into the adjacent stroma, whereas invasive carcinomas do.16
The presentation of invasive ductal carcinoma on ultra-sound depends on the degree of aggressiveness, but most often these lesions are associated with a shorter duplication time and a marked desmoplastic reaction. They tend to appear as lesions with irregular spicular/indistinct margins. The desmoplastic reaction associated with high cellularity makes these lesions stiffer than healthy breast tissue.17,18 These changes present high positive predictive values on conventional ultrasound. Even though these lesions are aggressive, they can be associated with areas of surrounding necrosis in high-grade carcinomas, where neoangiogenesis does not accompany tumor growth, presenting an area of inner liquefaction.
Ductal carcinomas in situ, because they have no associ-ated desmoplasia and are restricted to the breast duct, most often present as microcalcifications on mammography, and usually cannot be seen on conventional ultrasonography.
Focusing on invasive lobular carcinoma, a greater inci-dence of multifocal lesions is evident compared with that for invasive ductal types, ie, lobules compromised by the carcinoma and interspersed with areas of healthy tissue. Such lesions are usually characterized as nonmass lesions on ultrasonography.
Mucinous and papillary carcinomas tend to present as lesions that are indeterminate by imaging methods, and typically affect patients during menopause and without associated marked desmoplasia. The clinical peculiarity of these tumors compared with invasive ductal carcinomas is
their feature of being softer, less locally aggressive lesions that do not significantly invade adjacent tissues.19–21 They are generally classified as probably benign lesions on convention ultrasonography.
As outlined, breast carcinomas have a broad array of clini-cal and imaging presentations. This variation stems from the multifactorial influence that, in addition to histologic type, may also vary according to socioeconomic status, access to screening and treatment programs, and potential biologic differences between carcinomas. Biologic differences reflect genetic influence, lifestyle differences, nutrition, and envi-ronmental exposure.15,22,23 Understanding these differences is key to correctly interpreting the findings obtained.
Currently, there are no studies reported in the medical literature showing variation of sonoelastographic presenta-tion of breast carcinoma according to histologic type. In a recent study from 2012, Evans et al24 attempted to establish a correlation between shear-wave sonoelastography and histologic prognostic factors, but without establishing a relationship between histologic type and presentation of sonoelastography. Other studies only report false-negative results by sonoelastography, without establishing its relation-ship with histologic type.
The aims of the present study were to investigate the correlation between histologic type of breast carcinoma and sonoelastographic appearance, to explore factors which may influence the results of sonoelastography, and to discuss its clinical applicability.
Materials and methods
A prospective collaborative study was conducted by the Santa Casa de São Paulo and CTC-Center involving analysis of 540 breast lesions in patients referred for percutaneous breast biopsy between April 2010 and December 2011. Twenty lesions were excluded due to use of unsuitable versions of sonoelastographic software; a further 25 nonmass malignant lesions on ultrasound and 411 histopathologically confirmed benign lesions were also excluded. A total of 84 histopatho-logically confirmed malignant lesions that were mass on ultrasono graphy were included in the study. The study was approved by the institutional research ethics of the Santa Casa de Misericórdia de São Paulo committee and informed consent forms were signed by all patients.
Ultrasonography and sonoelastography
studies
Ultrasonography was performed first with the patient in the dorsohorizontal or lateral decubitus position,
depend-Breast Cancer: Targets and Therapy downloaded from https://www.dovepress.com/ by 118.70.13.36 on 20-Aug-2020
Dovepress Breast cancer sonoelastography
ing on which position provided best access to the lesion. Lesions were classified according to the criteria proposed by the BI-RADS lexicon, whereby lesions classified as category 1, 2 and 3 are considered benign, and categories 4 and 5 are suspicious for malignancy.25
The elastographic study was performed with the patient lying in the same position used for conventional ultrasono-graphy examination (B-mode) and with the transducer posi-tioned perpendicular to the region of interest (ROI). Before examination, the target lesion was repeatedly compressed to ensure there was no lateral shift. After activation of elasto-graphy, continuous manual compression was applied to the target region perpendicularly to the pectoral muscle until tis-sue resistance was detected. When resistance was felt, manual pressure was interrupted, allowing spontaneous decompres-sion of the breast parenchyma. The study area comprised the region from the subcutaneous tissue to the pectoral muscle and also the margins of the mass up to 0.5 cm.26
The elastographic imaging technique used comprises three phases: tissue is imaged with and without light com-pression, and radiofrequency data lines are acquired in the ROI (step 1); a displacement is estimated between every two lines of radiofrequency data (step 2); and a strain value for every point in the ROI is estimated based on deformation of the radiofrequency data (step 3). Each pixel of the elasticity image was assigned one of 256 specific colors, depending on the magnitude of strain. The scale ranged from blue for components with greatest strain (ie, softest components) to red for those with no strain (ie, hardest components). Green indicated average strain in the ROI. The images obtained by elastography are superimposed onto the B-mode images.
The elastographic classification adopted a four-point scale according to the color variation during compression and after decompression of the ROI. A score of 1 was assigned to lesions presenting the same color spectrum as the peripheral breast tissue. A score of 2 was assigned to lesions that, after decompression, presented variation to lighter strains of more than 50% of the mass area when compared with the image acquired during compression. A score of 3 was assigned to lesions presenting color variation of less than 50% of the lesion area (between 10% and 50%) after decompression. Finally, a score of 4 was assigned to those lesions showing no relevant color variation during compression and after decompression of the parenchyma, appearing blue in both images (Figure 1).
The histologic findings of the lesions were compared with the elastographic classification. Scores of 1 and 2 were con-sidered as benign, a score of 3 as probably benign, and a score of 4 as suspicious for malignancy. Percutaneous biopsy was
performed after the sonographic studies using a 14 gauge needle attached to an automatic biopsy gun. The mean num-ber of cores obtained was 5.4 (3–9 fragments).
The classification employed by the authors was similar to that proposed by the BI-RADS Fifth Edition, where a score of 2 can be compared with a soft lesion, a score of 3 with an intermediate lesion, and a score of 4 with a hard lesion.
Ultrasonography and sonoelastography were performed by two radiologists, both of whom were specialists in breast diagnosis. Examinations were performed using a Sonix SP ultrasound system (Ultrasonix Medical Corporation, Vancouver, BC, Canada) and a 5–14 mHz multifrequency linear probe. For the sonoelastography study, special software was used on the Ultrasonix system, version 3.0.2 (beta 1) upgraded to the commercial version 2.6.
Percutaneous biopsy
After sonoelastography, patients underwent biopsy by percu-taneous sample collection using a 14 gauge needle coupled with a semiautomatic core biopsy gun or vacuum-assisted breast biopsy using an 11 gauge needle.
anatomopathologic study
A histopathologic study was carried out by a pathologist experienced in the diagnosis of breast lesions. Malignant lesions were classified into seven categories according to histology: invasive ductal carcinomas not otherwise specified, medullary, apocrine, neuroendocrine carcinoma (A); tubular, mucinous, papillary carcinoma, cribriform carcinoma (B); metaplastic, anaplastic, undifferentiated high grade carci-noma (C); invasive lobular carcicarci-noma (D); mixed ductal and lobular carcinoma (E); in situ carcinoma (F); and metastatic carcinoma (G), as proposed by Carey et al.15 For convenient statistical analysis, the lesions were allocated into three broad groups according to lesion hardness, whereby group 1 contained softer lesions (categories B, F, and G), group 2 contained harder lesions (categories A, D, and E), and group 3 comprised category C lesions. No group 3 lesions were included in this study because the five lesions assigned to this category were all nonmass lesions.
statistical analysis
The ultrasonography and sonoelastography results were com-pared against the histopathologic results. Sonoelastographic scores of 1, 2, and 3 were considered false-negatives, while a score of 4 was true-positive. These scores were compared with histologic groups. Histologic groups were also compared for patient age and lesion size (greatest diameter).
Breast Cancer: Targets and Therapy downloaded from https://www.dovepress.com/ by 118.70.13.36 on 20-Aug-2020
Dovepress
Fleury et al
The association between sonoelastographic score and histopathologic result was compared using the chi-squared test after correction by the Yates method,27 which is recommended when the classes to be analyzed are small. Quantitative variables were compared between two independent groups using the Student’s t-test for indepen-dent samples, or when applicable, by the Mann–Whitney U nonparametric test. The Anderson–Darling test was also applied to test normality of quantitative variables.28 All sig-nificance probabilities (P-values) shown are bilateral, where values ,0.05 are considered to be statistically significant. Minitab software version 15.1 (Minitab Inc., State College, PA, USA) was used for statistical analysis of the data.
Results
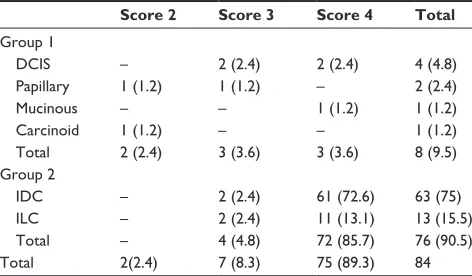
Of the 84 lesions analyzed, eight (9.5%) corresponded to histologic group 1 and 76 (90.5%) to group 2. Eight (9.5%) lesions yielded false-negative results on conventional ultra-sonography, being classified as BI-RADS category 3, versus nine (10.7%) false-negative results for sonoelastography, where two (22.2%) were classified as score 2 and seven (77.8%) as score 3. The distribution of histopathologic results together with sonoelastography scores is shown in Table 1.
When applied, the chi-squared test with type 2×2 contingency tables to determine the association between histopathologic results and sonoelastographic scores revealed an association between results at a P-value ,0.001 (Table 2). For this calcu-lation, scores of 2 and 3 were considered soft (false-negative results) and a score of 4 (true-positive results) as hard, while group 1 lesions were soft and group 2 lesions were hard.
Comparison of the mean patient age for false-negative results on sonoelastography with that for true-positive results
revealed no significant variation between the two groups (P=0.495, Student’s t-test), although the mean (standard deviation) age of the women with false-negative results was 55.1±9.2 years versus 51.5±15.2 years for those with true-positive results (Figure 2).
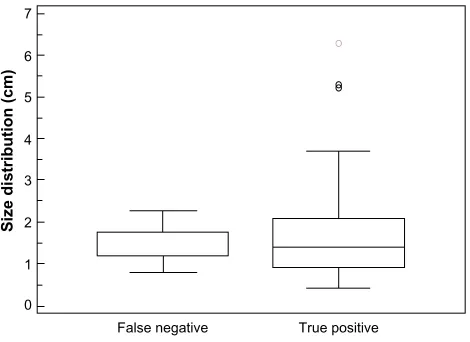
Comparison of lesion size found that false-negatives had a mean lesion diameter of 1.2 (range 0.8–2.3) cm, while true-positives had a mean diameter of 1.4 (range 0.4–6.3) cm. No significant difference was found between the two groups using the Mann–Whitney U test (P=0.9712; Figure 3).
Discussion
Since 2000, the majority of studies involving sonoelasto-graphy has sought to assess the extent to which the method can differentiate between benign and malignant lesions.2–5 However, sonoelastography is derived from the most ancient tool known to medicine, ie, physical palpation, where malig-nant lesions tend to be stiffer than benign due to their intrinsic high cellularity and association with the local desmoplastic reaction commonly found in these lesions.1 Nevertheless, not all carcinomas are stiffer than healthy breast tissue, and have different stiffness depending on histologic type and differ-ent clinical presdiffer-entations, such as association with necrosis, which may render them softer on manual palpation.16,19,20,29
Sonoelastography does not assess the shape, size, or echographic characteristics of lesions. The technique simply measures stiffness based on deformations in response to light external mechanical stress in the ultrasound study. These stimuli causes deformation in the tissues, including the ROI, which is measured by differences in the radiofrequency lines produced.26 The method is not set to replace conventional
Table 1 Distribution of histopathologic results by sonoelasto-graphic scores (%)
Score 2 Score 3 Score 4 Total
group 1
DCis – 2 (2.4) 2 (2.4) 4 (4.8)
Papillary 1 (1.2) 1 (1.2) – 2 (2.4)
Mucinous – – 1 (1.2) 1 (1.2)
Carcinoid 1 (1.2) – – 1 (1.2)
Total 2 (2.4) 3 (3.6) 3 (3.6) 8 (9.5)
group 2
iDC – 2 (2.4) 61 (72.6) 63 (75)
ilC – 2 (2.4) 11 (13.1) 13 (15.5)
Total – 4 (4.8) 72 (85.7) 76 (90.5)
Total 2(2.4) 7 (8.3) 75 (89.3) 84
Notes: group 1 corresponds to soft carcinomas, group 2 to hard carcinomas, scores 2 and 3 to false-negative results, and score 4 to true-positive results. Abbreviation: DCis, ductal carcinoma in situ; iDC, invasive ductal carcinoma; ilC, invasive lobular carcinoma.
Table 2 Chi-square test to verify association between sonoelastographic scores and histologic groups
Group 1 (soft lesions)
Group 2 (hard lesions)
Total
OF – observed frequencies
TP 3 72 75
Fn 4 5 9
eF – expected frequencies
TP 6.25 68.75 75
Fn 0.75 8.25 9
Difference OF × eF
TP 1.69 0.15 1.84
Fn 14.08 1.28 15.36
Total 7 77 84
Notes: χ2 cal =12.32; χ2 tab =3.84; P=0.00045. scores of 2 and 3 were considered
Fn and a score of 4 indicated TP, where group 1 contained soft lesions and group 2 hard lesions.
Abbreviations: Fn, false-negative; TP, true-positive; OF, observed frequency; eF, expected frequency; cal, calculated; tab, tabulated.
Breast Cancer: Targets and Therapy downloaded from https://www.dovepress.com/ by 118.70.13.36 on 20-Aug-2020
Dovepress Breast cancer sonoelastography
ultrasound for diagnosing breast lesions, but instead consti-tutes a complementary method that contributes information supplementary to that obtained by ultrasonography based on the stiffness of the tissues examined.
The results of the present study show that invasive ductal carcinomas of low and intermediate grades, usually associated with intense desmoplasia, tend to present as hard lesions by sonoelastography (Figure 4), while high-grade/ undifferentiated carcinomas, which generally have a high mitotic index and are associated with necrotic areas, are generally less stiff and may present on sonoelastography study as a false-negative result. These lesions show fast and aggressive growth, with less surrounding desmoplasia when compared with low-grade carcinomas (Figure 5).
Ductal carcinomas in situ, because they have no associ-ated desmoplasia and are restricted to the breast duct, usually have the appearance of benign lesions on sonoelastography and are less stiff than invasive ductal types, explaining their presentation as false-negative results on sonoelastography (Figure 6). Similar findings were reported by Izumori et al, who showed an association between carcinoma in situ on ultrasonography studies and solid and cystic mass lesions with a benign presentation. They also observed that carci-nomas in situ visible only on ultrasonography had a more benign evolution and affected older patients.16
When lobular carcinoma as a nonmass lesion at conven-tional ultrasonography is suspected, it should not be referred for sonoelastography study given the risk of false-negative results due to healthy tissue amid diseased tissue.22 When these present as mass lesions, sonoelastography can be used, where 86% were found to present as stiff lesions in our series.
Score 1 Lesions that presented the same spectrum of colors as the adjacent breast tissue upon compression and decompression
Lesions that had soft tissue color variations covering over 50% of the lesion after decompression
Lesions that presented a color variation on less than 50% of the area (between 10% and 50%) after decompression
Lesions with no significant color variation during compression and decompression
Decompression Definition
Score 2
Score 3
Score 4
Figure 1 Classification used and proposed by authors.
Note: assessment of breast masses during compression and after decompression of breast parenchyma, where scores of 1, 2, and 3 indicate benign masses, and a score of 4 is suspicious for malignancy.
False negative True positive 35
40 45 50 55 60 65 70
Age distribution (years
)
Figure 2 age distribution for false-negative (group 1) and true-positive (group 2) results.
Note: no significant difference in mean age was observed between the two groups
(P=0.4946, student’s t-test).
0
False negative True positive 1
2 3 4 5 6 7
Size distribution (cm)
Figure 3 size distribution for false-negative (group 1) and true-positive (group 2) results.
Note: no significant difference in median size was observed between the two
groups (Mann–Whitney U test; P=0.9712).
Breast Cancer: Targets and Therapy downloaded from https://www.dovepress.com/ by 118.70.13.36 on 20-Aug-2020
Dovepress
Fleury et al
Inclusion of nonmass lesions may have contributed to the lower diagnostic accuracy reported in other series.5,7
Papillary and mucinous carcinomas are usually well dif-ferentiated and associated with cystic components or pools of mucin on histology. Owing to these characteristics, these lesions should not present as stiff lesions on sonoelastography but as soft lesions (Figure 7).
The diagnostic hallmarks of these lesions are patient age and comparisons with earlier imaging studies. If the lesion was not apparent on earlier imaging, or shows growth while retaining the same morphology, then the possibility of papil-lary or mucinous tumor should be considered. These lesions tend to present as soft on sonoelastography, which may serve as information supplementary to the ultrasound study. Similar presentation was observed in carcinoid tumor metastasis, rated with a score of 2 by sonoelastography at this study.
These differences in presentation of breast carcinoma can already be seen in the material obtained by percutane-ous core biopsy, where low-grade invasive ductal carcinoma specimens are stiffer, whereas high-grade specimens are often softer.
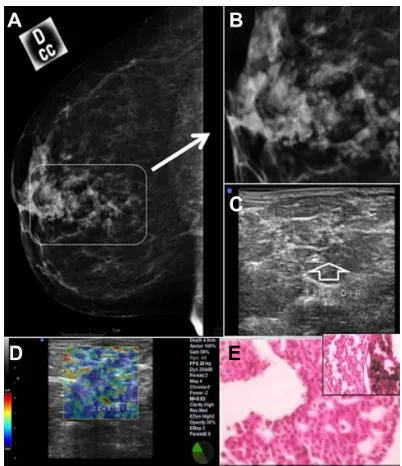
Our analysis found no statistically significant size dif-ference between tumors classified as true-positive and those classified as false-negative on sonoelastography (Figure 8). However, there was a tendency for false-negative results to be related to smaller lesions when compared with true-Figure 4 atypical presentation of invasive ductal carcinoma in a 40-year-old patient, presenting as a palpable mass.
Notes: Conventional ultrasound shows a hyperechoic and circumscribed mass (arrow), classified as BI-RADS® 4a (A). On sonoelastography, the lesion appears as a hard
mass, classified as score 4 (B). Histology confirmed the lesion as intermediate-grade invasive ductal carcinoma (C). Abbreviation: Bi-raDs, Breast imaging and reporting Data system.
Figure 5 heterogeneous mass in the left breast of a 45-year-old patient.
Notes: Classified as Bi-raDs® 5 by conventional ultrasound, with a diameter of 3.0
cm (A). Sonoelastography shows the behavior of a soft lesion, classified as score 2 (B). Magnetic resonance imaging confirmed the heterogeneity of the lesion, with
areas suggestive of interspersed necrosis, indicated by the full arrow (C). histology
confirmed areas of necrosis in a high-grade invasive ductal carcinoma, indicated by
arrowhead (D).
Abbreviation: Bi-raDs, Breast imaging and reporting Data system.
Figure 6 Clustered retroareolar microcalcifications in the right breast of a 52-year-old patient.
Notes: (A) shows mammogram classified as BI-RADS® 4c. (B) shows a magnification
of the microcalcifications (solid arrow). (C) shows the correlation between
microcalcifications and ultrasound, which shows as a nonmass lesion (open arrow).
On sonoelastography, it was not possible to characterize the lesion, which was
classified as score 1 (D). Histology confirmed ductal carcinoma in situ with associated microcalcifications (E). The inset shows the microscopic playstation of the lesion. Abbreviation: Bi-raDs, Breast imaging and reporting Data system; CCD, right craniocaudal view.
Breast Cancer: Targets and Therapy downloaded from https://www.dovepress.com/ by 118.70.13.36 on 20-Aug-2020
Dovepress Breast cancer sonoelastography
positives, suggesting no correlation between lesion size and false-negative results, in line with previous reports. More studies should be done to validate this observation.
Assessment of mean age of patients with false-negatives compared with true-positives on sonoelastography showed a tendency to find false-negative results in older patients, a fact congruent with the types of tumors found in these patients: mucinous, ductal in situ, and papillary carcinomas. This fact may be valuable, bearing in mind that these patients generally make up part of the screening program, and when they present a new lesion on ultrasound study, even if it has the appearance of a probably benign lesion and is soft on sonoelastography, the possibility of these types of carcinoma must be taken into account as a differential diagnosis. More studies are needed to support this statement.
One of the benefits of using sonoelastography in clinical practice is its high specificity for detecting benign and probably benign lesions classified as BI-RADS category 3. This is the main factor favoring introduction of sonoelastography as an
additional study to supplement conventional ultrasonography, which despite having greater sensitivity than sonoelastography, has low specificity. A total of nine false-negative results out of the 84 lesions studied were found on sonoelastography versus eight on conventional ultrasonography. When ultrasonography and sonoelasto graphy are combined, this figure falls to six cases, and on associating mammography findings, the number falls lower still to four cases. This suggests that analysis of breast lesions should be based on joint analysis, drawing on all diagnostic methods available in an attempt to reduce the number of false-negatives. Further studies are underway to ascertain the diagnostic accuracy of combined methods.
One of the limitations of sonoelastography is the current lack of technical standardization for the examination and the classification to be adopted. The method is still being refined, and there is no consensus on the best software to be used (which varies depending on the manufacturer of the device). In the course of our study we carried out five software upgrades, and for one of the versions noted a marked Figure 7 Mucinous carcinoma in a 58-year-old patient.
Notes: The mammogram shows focal asymmetry with indistinct margins in the medial quadrant of the left breast, indicated by the filled arrow (A). The mass was classified
as score 3 on sonoelastography because of the soft areas observed at the periphery of the lesion, indicated by the arrowhead (B). Ultrasound examination showed an
irregular mass in the topography of the lesion classified as BI-RADS® 4c, indicated by double arrows (C). Histology confirmed a medullary carcinoma (D). The inset shows
the microscopic playstation of the lesion.
Abbreviation: Bi-raDs, Breast imaging and reporting Data system; CCD, right craniocaudal view; CCe, left craniocaudal view.
Figure 8 invasive ductal carcinoma of intermediate grade in a 63-year-old patient.
Notes: Characterized as an irregular mass on ultrasonography and classified as BI-RADS® 5, with a diameter of 3.5 cm (A). sonoelastography shows the behavior of a rigid
lesion, classified as score 4 (B). Histology confirmed invasive ductal carcinoma (C). Abbreviation: Bi-raDs, Breast imaging and reporting Data system.
Breast Cancer: Targets and Therapy downloaded from https://www.dovepress.com/ by 118.70.13.36 on 20-Aug-2020
Dovepress
Fleury et al
change in sensitivity concerning the ROI, which led to three false-negative results. The 25 lesions studied during this period up to the changing of the software were excluded. This illustrates the fact that false-negative results may be obtained if the software is not properly calibrated, and limit clinical applicability when the software calibration is very sensitive to deformation. Studies are underway to reduce these limitations and to facilitate the sonoelastography reproducibility, such as measures of compression and lateral shift in ROI areas.
New technologies have been employed in sonoelastogra-phy, the most recent being shear-wave elastograsonoelastogra-phy, which aims to reduce interobserver variation and to aggregate quantitative values to the technique obtaining objective values for stiffness of the lesion . However, in a recently published study by Berg et al,30 it is concluded that qualitative analy-sis of sonoelastography findings still has the best results. Our results demonstrate that the softer the suspect lesion is, greater the chance to be related to undifferentiated and high-grade carcinoma, with a worse prognosis. More studies should be conducted to validate these findings.
Conclusion
The present study shows that breast carcinomas have a broad spectrum of presentation on sonoelastography, and the results for this technique are influenced by the histology of the lesion rather than by its size or patient age. Our results highlight the importance of being aware of the different forms of histopatho-logic presentation of breast carcinomas in order to correctly interpret findings and to avoid negative results. The false-negative results in this study were shown to be influenced by histologic type of lesion and not by lesion size or patient age.
Acknowledgment
The authors are grateful to all the patients who participated in this study.
Author contributions
EFCF conceived the study, carried out the biopsies, interpreted the images acquired, undertook the sequence alignment, and performed the statistical analysis. DR carried out the biopsies and interpreted the images acquired. MCAGA-Q interpreted the histologic results. All authors took part in drafting the article or revising it critically for important intellectual con-tent. All authors read and approved the final manuscript.
Disclosure
The authors report that they have no competing interests in this work.
References
1. Ophir J, Céspedes I, Ponnekanti H, Yazdi Y, Li X. Elastography: a quantitative method for imaging the elasticity of biological tissues.
Ultrason Imaging. 1991;13:111–134.
2. Burnside ES, Hall TJ, Sommer AM, et al. Differentiating benign from malignant solid breast masses with US strain imaging. Radiology. 2007;245:401–410.
3. Cho N, Moon WK, Park JS, Cha JH, Jang M, Seong MH. Nonpalpable breast masses: evaluation by US elastography. Korean J Radiol. 2008;9:111–118.
4. Itoh A, Ueno E, Tohno E, et al. Breast disease: clinical application of US elastography for diagnosis. Radiology. 2006;239:341–350. 5. Scaperrotta G, Ferranti C, Costa C, et al. Role of sonoelastography in
non-palpable breast lesions. Eur Radiol. 2008;18:2831–2839. 6. Fleury EF, Rinaldi JF, Piato S, Fleury JC, Roveda D Jr. Appearance of
breast masses on sonoelastography with special focus on the diagnosis of fibroadenomas. Eur Radiol. 2009;19:1337–1346.
7. Sohn YM, Kim MJ, Kim EK, Kwak JY, Moon HJ, Kim SJ. Sonographic elastography combined with conventional sonography: how much is it helpful for diagnostic performance? J Ultrasound Med. 2009;28:413–420.
8. Giuseppetti GM, Martegani A, Di Cioccio B, Baldassarre S. Elastosonography in the diagnosis of the nodular breast lesions: preliminary report. Radiol Med. 2005;110:69–76.
9. Regner DM, Hesley GK, Hangiandreou NJ, et al. Breast lesions: evaluation with US strain imaging – clinical experience of multiple observers. Radiology. 2006;238:425–437.
10. Stavros AT, Thickman D, Rapp CL, Dennis MA, Parker SH, Sisney GA. Solid breast nodules: use of sonography to distinguish between benign and malignant lesions. Radiology. 2005;196:14–15. 11. Hong AS, Rosen EL, Soo MS, Baker JA. BI-RADS for sonography:
positive and negative predictive values of sonographic features.
AJR Am J Roentgenol. 2005;184:1260–1265.
12. Kim EK, Ko KH, Oh KK, et al. Clinical application of the BI-RADS f inal assessment to breast sonography in conjunction with mammography. AJR Am J Roentgenol. 2008;190:1209–1215. 13. Costantini M, Belli P, Lombardi R, Franceschini G, Mulè A, Bonomo L.
Characterization of solid breast masses: use of the sonographic breast imaging reporting and data system lexicon. J Ultrasound Med. 2006;25:649–659.
14. Zonderland HM, Pope TL Jr, Nieborg AJ. The positive predictive value of the breast imaging reporting and data system (BI-RADS) as a method of quality assessment in breast imaging in a hospital population.
Eur Radiol. 2004;14:1743–1750.
15. Carey LA, Perou CM, Livasy CA, et al. Race, breast cancer subtypes, and survival in the Carolina Breast Cancer Study. JAMA. 2006;295: 2492–2502.
16. Izumori A, Takebe K, Sato A. Ultrasound findings and histological features of ductal carcinoma in situ detected by ultrasound examination alone. Breast Cancer. 2010;17:136–141.
17. Causer PA, Jong RA, Warner E, et al. Breast cancers detected with imaging screening in the BRCA population: emphasis on MR imaging with histopathologic correlation. Radiographics. 2007;27:S165–S182. 18. Wang Y, Ikeda DM, Narasimhan B, et al. Estrogen receptor-negative
invasive breast cancer: imaging features of tumors with and without human epidermal growth factor receptor type 2 overexpression.
Radiology. 2008;246:367–375.
19. Lam WW, Chu WC, Tse GM, Ma TK. Sonographic appearance of mucinous carcinoma of the breast. AJR Am J Roentgenol. 2004;182: 1069–1074.
20. Soo MS, Willifond ME, Walsh R, Bentley RC, Kornguth PJ. Papillary carcinoma of the breast: imaging findings. AJR Am J Roentgenol. 1995;164:321–326.
21. Harvey JA. Unusual breast cancers: useful clues to expanding the differential diagnosis. Radiology. 2007;242:683–694.
22. Kapp AV, Jeffrey SS, Langerød A, et al. Discovery and validation of breast cancer subtypes. BMC Genomics. 2006;7:231.
Breast Cancer: Targets and Therapy downloaded from https://www.dovepress.com/ by 118.70.13.36 on 20-Aug-2020
Breast Cancer: Targets and Therapy
Publish your work in this journal
Submit your manuscript here: http://www.dovepress.com/breast-cancer---targets-and-therapy-journal
Breast Cancer: Targets and Therapy is an international, peer- reviewed open access journal focusing on breast cancer research, identification of therapeutic targets and the optimal use of preven-tative and integrated treatment interventions to achieve improved outcomes, enhanced survival and quality of life for the cancer patient.
View the full aims and scopes of this journal here. The manuscript management system is completely online and includes a very quick and fair peer-review system, which is all easy to use. Visit http:// www.dovepress.com/testimonials.php to read real quotes from published authors.
Dovepress
Dove
press
Breast cancer sonoelastography
23. Smid M, Wang Y, Zhang Y, et al. Subtypes of breast cancer show preferential site of relapse. Cancer Res. 2008;68:3108–3114. 24. Evans A, Whelehan P, Thomson K, et al. Invasive breast cancer:
relationship between shear-wave elastographic findings and histologic prognostic factors. Radiology. 2012;263:673–677.
25. American College of Radiology. Breast imaging reporting and data sys-tem (BI-RADS), ultrasound. 5th ed. Reston, VA, USA: American Col-lege of Radiology; 2003. Available from: http://www.acr.org/∼/media/ ACR/Documents/PDF/QualitySafety/Resources/BIRADS/ Posters/ BIRADS%20Reference%20Card_web_F.pdf. Accessed May 13, 2014.
26. Fleury EF, Fleury JC, Piato S, Roveda D Jr. New elastographic classification of breast lesions during and after compression. Diagn Interv Radiol. 2009;15:96–103.
27. Engineering Statistics Handbook [homepage on the internet]. 1.3.5.18. Yates Algorithm. Available from: http://www.itl.nist.gov/div898/hand-book/eda/section3/eda35i.htm. Accessed July 20, 2014.
28. Zar JH. Biostatistical Analysis. 2nd ed. Englewood Cliffs, NJ, USA: Prentice Hall; 1984.
29. Yang WT, Hennessy B, Broglio K, Mills C, Sneige N, Davis WG. Imaging differences in metaplastic and invasive ductal carcinomas of the breast. AJR Am J Roentgenol. 2007;189:1288–1293.
30. Berg WA, Cosgrove DO, Dore CJ, et al. Shear-wave elastography improves the specificity of breast US: the BQ1 multinational study of 939 masses. Radiology. 2012;262:435–449.
Breast Cancer: Targets and Therapy downloaded from https://www.dovepress.com/ by 118.70.13.36 on 20-Aug-2020