Abstract
BELYEA, JENNIFER LEE. Spectroscopic Characterization of the Function and Mechanism of Dehaloperoxidase. (Under the direction of Stefan Franzen)
SPECTROSCOPIC CHARACTERIZATION OF THE
FUNCTION AND MECHANISM OF
DEHALOPEROXIDASE
by
JENNIFER LEE BELYEA
A thesis submitted to the Graduate Faculty of
North Carolina State University
in partial fulfillment of the requirements
for the Degree of
Masters of Science
DEPARTMENT OF CHEMISTRY
Raleigh, North Carolina
June 2004
APPROVED BY:
____________________ ____________________
Dr. Edmond Bowden
Dr. Steven Lommel
____________________
Dr. Stefan Franzen
Dedication
This work is dedicated to my family. My parents have always been my cheerleaders encouraging me to do to my best and keeping my sprits up when thing did not work out
as I desired. My sister has become much more than a source of spare parts she is a driving force that pushes me to better myself as a person. My husband is my greatest
Biography
Jennifer Lee Belyea was born on June 24, 1976 in Singapore, to Charles and Lek Lek Browning. Jennifer grew up with a younger sister, Carol Sui, in West Plains Missouri
Acknowledgements
I would like to thank my advisor, Stefan Franzen, for the opportunity to work in his laboratory and the chance to work with dehaloperoxidase. Thanks to Drs. Bowden and
Lommel for the opportunity to work in their laboratories. Thanks to Dr. Tim Sit for the help and his patience with the cloning work. Thanks to Dr. Clay Clark and his lab for the
use of their stopped-flow apparatus. Thanks to Dr. Martin Vos for his work with the NO recombination experiments. I would like to thank Marisha Godek, Lauren Collins and Robin Casey for their help getting this project of the ground. Thanks to Scott Brewer and
Dr. Simon Lappi for their help with instruments and advice. Special thanks to Mike Davis and Lauren Gilvey for their interest in this project and willingness to work on and
Table of Contents
Page
LIST OF TABLES………...vii
LIST OF FIGURES………viii
CHAPTER 1: Introduction and Background………..………... 1
1.1Introduction and Background……….. 2
1.2Cloning, Expression and Purification of DHP and 6x His DHP………. 2
1.3Involving DHP and 6x His DHP………. 3
1.4CO Recombination as a Function of Temperature……….. 3
1.5Effects of Glycerol Concentration on NO Ligand Recombination……….. 3
References…..……… 5
Chapter 2: Cloning, Expression and Purification of DHP and 6x His Tagged DHP……. 6
2.1 Introduction……….…. 7
2.2 Materials and Methods………. 7
2.3 Results and Discussion………... 11
References…..………..…. 14
Chapter 3: Assays of Dehaloperoxidase Enzyme Activity………... 15
3.1 Introduction………. 16
3.2 UV-Vis Spectroscopic Assays...………. 20
3.2.1 DHP and 6x His DHP assays using 2,4,6-Trifloropehenol, 2,4,6- Trichlorophenol, 2,4,6-Tribromophenol, and 2.4.6-Triiodiophenol………. 21
3.3 Stopped – Flow Assays of 6x His DHP….……….… 22
3.4 UV-Vis Spectroscopic Assays Results of DHP and 6x His DHP assays using 2,4,6- Trifloropehenol, 2,4,6-Trichlorophenol, 2,4,6-Tribromophenol, and 2.4.6- Triodiophenol……….……….… 24
3.5 Hydrogen Peroxide Susceptibility Results………..…… 34
3.6 Stopped-Flow Assays Results………...……….. 41
3.7 Conclusions………... 43
References………. 46
Chapter 4 CO Recombination as a Function of Temperature………... 47
4.1 Introduction……….…… 48
4.2 Methods……….….. 49
4.3 Results....………..………... 50
4.4 Discussion………57
4.5 Conclusions...……….. 64
References………. 66
Chapter 5: Transient Absorption Experiments to Probe Glycerol Concentration and Substrate binding Effects on the NO Rebinding Kinetics of Dehaloperoxidase………...…..…. 62
5.1 Introduction……….………….... 68
5.2 Methods……….……….……. 68
5.3 Results and Discussion……….…………..… 68
5.4 Conclusions………...……….. 73
List of Tables
Page
Table 3.1 Table of wavelength for reactions with DHP and 6x His DHP….……….….. 33
LIST OF FIGURES
Page
Figure 2.1 1% Agarose gel of Successful PCR Reaction...………..……… 12
Figure 2.2. Sequence of dehaloperoxidase ……….………. 13
Figure 3.1. Peroxidase and monooxygenase pathways for oxidative dehalogenation of p-halophenols……….. 18
Figure 3.2 Peroxidase cycle depicted in a ping pong as mechanism……… 19
Figure 3.3 UV-Vis assay of DHP, 2,4,6-tribromophenol at pH 6.0……….…….24
Figure 3.4 Difference spectrum of a UV-Vis assay of DHP assay….……….. 25
Figure 3.5 UV-Vis assay of 6x His DHP, 2,4,6-tribromophenol at pH 6.0……….. 26
Figure 3.6 Difference spectrum of the a UV-Vis assay of 6x His DHP...……… 26
Figure 3.7 UV-Vis assay of DHP, 2,4,6-triflorophenol at pH 6.0……… 27
Figure 3.8 Difference spectrum of a UV-Vis assay of DHP ……….………... 28
Figure 3.9 UV-Vis assay of 6x His DHP, 2,4,6-triflorophenol at pH 6.0………. 28
Figure 3.10 Difference spectrum of a UV-Vis assay of 6x His DHP ……….…………. 29
Figure 3.11 UV-Vis assay of DHP, 2,4,6-trichlorophenol at pH 6.0……… 20
Figure 3.12 Difference spectrum a UV-Vis assay of DHP ……….. 30
Figure 3.13 UV-Vis assay of 6x His DHP, 2,4,6-trichlorophenol at pH 6.0……… 30
Figure 3.14 Difference spectrum of a UV-Vis assay of 6x His DHP ……….. 31
Figure 3.15 UV-Vis assay of DHP, 2,4,6-triiodiophenol at pH 6.0……….. 31
Figure 3.16 Difference spectrum of a UV-Vis assay of DHP ……….. 32
Figure 3.17 UV-Vis assay of 6x His DHP, 2,4,6-triiodiophenol at pH 6.0……….. 32
Figure 3.20 Graph of the area between under the soret band for 6x His DHP …..……. 36
Figure 3.21. Hydrogen Peroxide susceptibility test on HRP ….……….. 37
Figure 3.22 Graph of the area under the soret band for HRP ..……… 38
Figure 3.23 Hydrogen peroxide susceptibility test on HHMb……….………. 39
Figure 3.24 Hydrogen Peroxide susceptibility test on HHMb …………...……….. 40
Figure 3.25 Graph of the area soret band for HHMb ………..………. 41
Figure 3.26 Stopped-flow experiment of HRP and 6x His DHP ………...….. 42
Figure 3.27 Stopped-flow experiment of HRP and 6x His DHP……….. 42
Figure 4.1 νC-O or A states of DHP-CO pH 7.0 ………..………. 51
Figure 4.2 νC-O or A states of DHP-CO with TBP pH 7.0 ………..………. 51
Figure 4.3 B bands of DHP-CO with TBP pH 7.0 ……….. 52
Figure 4.4 νC-O or A states of HHMb-CO pH 7.0 ………..……….. 52
Figure 4.5 B bands of HHMb-CO pH 7.0 ……… 53
Figure 4.6 νC-O or A states of H64V-CO pH 7.0 CO ……….……….. 53
Figure 4.7 B bands of H64V-CO pH 7.0 ………. 54
Figure 4.8 νC-O or A state of H64V-CO with TBP pH 7.0 ………..……… 54
Figure 4.9 B bands of H64V-CO with TBP pH 7.0 ……….……… 54
Figure 4.10 νC-O or A states of DHP-CO pH 4.0 ………...……….. 55
Figure 4.11 B bands of DHP-CO pH 4.0 ………. 55
Figure 4.12 νC-O or A states of DHP-CO with TBP pH 4.0 ……….……… 56
Figure 4.13 B bands of DHP-CO with TBP pH 4 ……….……….. 56
Figure 4.15 νC-O or A states of HHMb-CO pH 4.0 ………. 57
Figure 4.16 The heme active site of HHMb………..59
Figure 4.17 The heme active site of DHP………..60 Figure 4.18 The heme active site of DHPwith substrate 4-iodiophenol bound...………..60 Figure 4.19 Percent of CO ligand recombination of as a function of temperature…...… 63
Figrue5.1 The difference spectrum obtained from DHPNO….………..……..… 70 Figure 5.2 The difference spectrum obtained from H64VNO ….………..……….. 70
Figure 5.3 Time dependence of the differential absorption signal of DHPNO..……….. 71 Figure 5.4. Time dependence of the differential absorption of DHPNO………. 71 Figure 5.6. Time dependence of the differential absorption signal of H64VNO……… 72
1.1 Introduction and Background
Dehaloperoxidase (DHP) is an enzyme isolated from the marine worm Amphitrite
ornata1-6. In the presence of peroxide and a suitable substrate such as tribromo-, trichloro- or
even trifluorophenol, DHP catalyzes the oxidation of the phenol to a quinone product1. The
exact nature of the product distribution has not been determined, but assays show that the
reactivity is similar to horseradish peroxidase7. None of this would be remarkable if not for
the fact that the structure of DHP is nearly isomorphous with known myoglobin structures,
and known globins have essentially no peroxidase activity1,4. This makes DHP the first
known peroxidase with a globin fold and in fact, only the second enzyme known to have a
globin fold3. Due to the structural homology with globins and activity as a peroxidase,
dehaloperoxidase is an ideal enzyme to probe the structure/function relationship of proteins.
Until now, all of the studies of DHP have been carried out using protein isolated from
A. ornata. Even though there is an X-ray crystal structure of the enzyme with a bound
substrate analog (4-iodophenol), the proof that DHP is the enzyme required farther
characterization5. The characterization of the mechanism and dynamics of this enzyme is a
central target of the work in this thesis. Several spectroscopic studies were developed to
understand the mechanism of DHP. The protein initially had to be isolated from the worm1-6.
It is not convenient to obtain large amounts of protein by this method therefore the first
barrier that had to be over come was the lack of protein.
1.2 Cloning, Expression and Purification of DHP and 6x His DHP
The spectroscopic studies undertaken in this thesis require large amounts of protein.
For this reason the initial phase of this project is devoted to the cloning expression and
advantage in that, site-directed mutants could be expressed and studied as well9.
Recombinant forms of dehaloperoxidase are isolated as a stable oxyferrous dimmer of 31kD.
1.3 Assays Involving DHP and 6x His DHP
With a source of recombinant dehaoperoxidase the activity of the enzyme is tested to
ensure that the recombinant protein behaves like the wild type dehaloperoxidse. UV-Vis
assay data in this section suggests that dehaloperoxidase does not use peroxide as a
cosubstrate. Our conclusion, therefore, is that there must be an alternative mechanism to
generate compound I.
1.4 CO Recombination as a Function of Temperature
Fourier transformed infrared (FTIR) spectroscopy is used to further characterize the
recombinant dehaloperoxidase. Similar Fourier transformed infrared experiments on native
dehaloperoxidase have resulted in similar results to those shown in chapter four of this thesis.
Do to a greater availability of recombinant protein; we have expanded the sample conditions
to include different pHs and presence of substrate. In this section Fourier transformed
infrared data shows shifts in A and B states due to pH and the presence of substrate,
2,4,6-tribromophenol. This method, FTIR, has provided the only means of a direct comparison of
the recombinant and native forms of dehaloperoidase.
1.5 Effects of Glycerol Concentration on NO Ligand Recombination
Picosecond Transient absorption experiments measuring the effects of glycerol
concentration on NO ligand recombination were performed at the Laboratorie d’Optique et
Biosciences located at Ecole Palaiseau, in France. This study shows that the presence of
substrate has the same effect as increased viscosity on ligand recombination. This data can
in Chapter 2. Similar studies have been done on myoglobin and mutants of myoglobin.
Dehaloperoxidase is a structural homolog to the sperm whale myoglobin mutant H64V. In
H64V the 64th residue a histidine, that was mutated to a valine. Dehaloperoxidase has a
References
1. LaCount, MW., Zang, EL., Chen, YP., et al. The crystal structure and amino acid sequence of dehaloperoxidase form Amphitrite ornata, indicate common ancestry with globins, Journal of Biological Chemisty 2000; 275: 18712 – 18716.
2. Zhang, E., Chen, YP., Roaach, MP., et al. Crystallization and initial spectroscopic characterization of the heme-containing dehaloperoxidase from the marine polychaete
Amphitrite ornata,. Acta Cryst. 1996; D52: 1191-1193.
3. Roach, MP., Chen, YP., Dawson, JH., et al. Notomastus lobatus Chloroperoxidase
and Amphitrite ornata, Dehaloperoxidase both contain histidine as their proximal
heme iron ligands, Biochemistry 1997; 36: 2197-2202.
4. Lebioda, L., LaCount, MW., Woodin, SA., et al An enzymatic globin from a marine worm Nature 1999; 401: 445
5. Chen, YP., Woodin, SA., Lincoln, DE., and Lovell, CR., An unusual dehalogenating peroxidase from the marine terebellid polychaete Amphitrite ornata, The Journal of Biological Chemistry 1996; 9: 4609-4612.
6. Han, K., Woodin, SA., Ely, B., et al. Amphitrite ornata, a Marine Worm, Contains Two Dehaloperoxidase Genes, Marine Biotechnology 2001; 3: 287-292
7. Hewson, WD., Dunford, HB., Oxidation of p-Cresol by Horseradish Peroxidase Compound I, The Journal of Biological Chemistry. 1976; 19: 6036-6042
Chapter 2: Cloning, Expression and Purification of DHP and
2.1 Introduction
The goal of the work presented in this chapter is to clone DHP in order to provide an
abundant and independent source of protein. Until now, studies concerning DHP have been
completed using protein isolated from A. ornata. The native form of protein is not abundant
and may contain contaminates. Protein isolated from the marine worm way have one or
more contaminates that possess the true peroxidase activity observed; thus, a non native
source of protein is an ideal approach to eliminate contaminates and to provide an abundant
source of protein.
In the following chapter, the cloning, expression and purification of DHP is
documented. The major obstacle to the expression of DHP in E. coli is the presence of the
codon, AGG, in the A. ornata gene for dehaloperoxidase that is not read by the E. coli
translational apparatus. To overcome this obstacle, cloning of the dehaloperoxidase gene
into a “Rosetta” cell line that contains all the tRNAs utilized in the DHP gene sequence is
described7.
2.2 Materials and Methods
Cloning of the DHP gene into the Rosetta (DE3) pLysS cell line:
The DHP coding region was amplified from a cDNA construct with PfuTurbo® DNA
polymerase (Stratagene, La Jolla, CA) using primers that incorporated a unique NcoI site at
the amino terminus (5’TATTACCATGGGGTTTAAACAAGATATTGC) and a BamHI site
at the carboxyl terminus (5’TATTAGGATCCTACTTCATGCCTGCGCTGC). An alternate
5’ primer coding for an additional 6 His residues (bold typeface;
also used to produce a 5’ Histidine-tagged DHP for ease of purification on Ni-NTA columns.
A Stratagene RoboCycler Gradient 96 thermacycler was used to conduct all the PCR’s with
the following program for the amplification of the DHP gene coding for both His tagged and
non His tagged proteins; window 1: 94oC for 3 minutes 47-58oC for 1 minute then 72oC for
90 seconds 2 cycles, window 2: 94 oC for 45 seconds 47-52oC for 45 seconds and 72oC for 80
seconds 38 cycles, window 3 72oC for 10 minutes 1 cycle, window 4 cools to 6oC. The
amplified DNA were purified using QIAprep Miniprep kits (Qiagen, 27104).
Complementary nucleotide overhang ends on the DHP amplification product and the
pET-16B plasmid were generated using Bam HI (New England Biolabs, R0136S) and Nco I
(New England Biolabs, R0193S) for ligation in to the pET-16B vector. After ligation of the
DHP gene into pET-16B the vector was heat shocked into DH5α competent E. coli cells.
Plasmids were isolated from the DH5α cells using QIAprep Miniprep kits (Qiagen, 27104).
Expression of the DHP Enzyme from the pET-16b expression vetor: 6XHis and
unmodified sequence in Rosetta (DE3) pLysS were stored as glycerol stocks in a –70 OC
freezer. The glycerol stock was used to streak a 2XYT agar plate supplemented with
ampicillin and chloramphenicol. The plate was incubated overnight at 37 oC. 2XYT media
containing ampicillin and chloramphenicol was inoculated with several colonies. The
cultures were allowed to grow at 37 oC for 10 to 16 hours then were centrifuged in a Sorvall
RC-5B using 250 ml bottles at 8000 X g (7,000 rpm with a KA-10 rotor) for 10 minutes. No
induction was necessary. After centrifugation the cell pellet was collected and frozen in a
-20 OC freezer until purification.
Purification of 6X-His tagged Dehaloperoxidase from Rosetta (DE3) pLysS:
in 10 ml of lysis buffer (50 mM NaH2PO4, 300 mM NaCl, 10 mM imidazole, pH 8.0) per
gram wet weight of cell pellet for 15 minutes. Once cells were thawed, they were
resuspended by stirring at 4 oC for 10 minutes. After resuspension, lysozyme was added to a
final concentration of 1 mg/ml and incubated on ice for 30 minutes. After incubation with
lysozyme, the cell mixture was sonicated in a Fisher Scientific FS20 sonicator for 30 minutes
in an ice water bath. RNase A and DNase I were added to the viscous lysate resulting in a
final concentration of 10 µl/ml and 5µl/ml, respectively. The lysate was allowed to incubate
on ice for 15 minutes, before being centrifuged at 10,000x g for 30 minutes at 4 oC (KA-21.5,
9,250 RPM).
The purification of the 6X His tagged protein was done using Ni-NTA agarose
(QUIAGEN Cat.No. 30210). The procedure was modified from Qiagen’s manual which
accompanies the Ni-NTA agarose. The lysate, which was translucent red in color, was
loaded onto the column. The effluent was translucent with an orange tint. When the lysate,
was loaded the wash buffer (50mM NaH2PO4, 300 mM NaCl, 20 mM imidazole, pH 8.0)
was applied at 3 times the column volume. The elution buffer (50 mM NaH2PO4, 300 mM
NaCl, 250 mM imidazole, pH 8.0) was then added to the column. Fractions were collected
according to the intensity of the color of the eluted protein solution. Once the column was
completely eluted, the fractions were analyzed by SDS-PAGE and by UV-vis spectroscopy.
Fractions that had a purity number (ratio of Soret absorbance to absorbance at 280 nm) of 2.5
or greater were pooled. The pooled fractions were concentrated by Amicon centriprep
YM-10 (4321). The concentrated protein solution was then used for assays.
A 50 g cell pellet was thawed and suspended by stirring in a minimal amount of lysis
buffer (50 mM Tris, 100 mM NaCl, 5 mM EDTA; 4 ml per gram of cell pellet) for 30
minutes at 4 oC. After stirring, the cell solution was refrozen with liquid nitrogen or dry ice
until completely solid. The red color of the frozen cell solution intensified upon freezing.
The cells were then thawed in a 37 oC oven. This solution was centrifuged for 20 minutes at
26,892 X g (KA-21.5, 15000 RPM with 50 ml centrifuge tubes). After centrifugation the
supernatant and pellet were collected separately.
Heme biosynthesis lagged behind the synthesis of the protein; therefore, heme was
added to the apo-protein to maximize yield. The pellet was resuspended in a minimal
amount of lysis buffer and 40 µl of heme solution per gram of original cell pellet. The cell
mixture was allowed to stir for 30 minutes at 4OC. After stirring with heme solution the
pellet was sonicated in a Fisher Scientific FS20 sonicator for 30 minutes. After sonication
the pellet solution was centrifuged for 25 minutes at 26,892 X g (15000 RPM, KA-21.5 rotor
with 50 ml centrifuge tubes). The supernatant was collected and 0.01 ml of heme solution
per gram of original cell pellet (10 mg heme/ ml of 0.1 M NaOH) was added. The
supernatant was allowed to stir at 4OC for 1 hr. After stirring, the supernatant was centrifuged
for 15 minutes at 26,892 X g (15000 RPM, KA-21.5 rotor with 50 ml centrifuge tubes). The
supernatant and the supernatant from the earlier step were combined and dialyzed in lysis
buffer. After dialysis, the DHP solution was centrifuged for 15 minutes at 26,892 X g
(15000 RPM, KA-21.5 rotor with 50 ml centrifuge tubes). The supernatant was collected
and the pH was determined.
DHP was purified using CM52 cation exchange resin (Whatman Cat. #4057050) in a
was equilibrated with 3.5L of column buffer (20 mM Phosphate pH 5.0). The protein
solution was loaded onto the equilibrated column and was washed with 80 ml of column
buffer. A 300 ml linear gradient of 20 mM Phosphate pH 5.0 to 20 mM Phosphate 0.5 M
NaCl, pH 5.0 was used to elute the protein. Fractions were collected and analyzed for DHP
using a UV-Vis spectrophotometer. All fractions with a purity number of 2.5 or better were
pooled. The pooled fractions were concentrated by Amicon centriprep YM-10 (cat. # 4321).
The concentrated protein solution was then loaded onto an 80 ml sephacryl S-300 (Fluka cat.
# G01051) Kontes* Brand Flex-Column* Economy, K4204000-1050 column in 20 mM
Phosphate pH 5.0 buffer. Fractions from this column were analyzed by SDS-Page.
The addition of hemin to the protein to constitute apo-dehaloperoxidase (vide supra)
resulted mixed oxidation states of the heme. In order to ensure that only the ferric form was
isolated, the DHP protein was treated with 1.7 molar excess potassium ferricyanide (Fisher
P232). Excess ferricyanide was removed by size exclusion chromatograpy carried out by
using a sephedex G-25 column. The protein was concentrated using an Amicon centriprep
YM-10 (4321) and the purity of the DHP was determined from a ratio of the absorbances at
409 and 280 nm. Purity numbers (A280/A409) in this case were always greater than 3.4. The
concentration of the DHP was determined spectrophotometrically at 409 nm using a molar
absorptivity of 1.88 x 10⁵ M-1 cm-1.
2.3 Results and Discussion
Polymerase chain reaction amplification of dehaloperoxidase gene with and without
additional codons for an N-terminus His tag was successful. Figure 2.1 is a 1% agarose gel
showing a MW ladder in the far right lane, the next three lanes show the successful PCR
means the attempt to make a C-terminus His tag was not successful. The last lane of the gel
in figure 2.1 shows a successful amplification of the gene for the non his tagged DHP gene.
Figure 2.1 1% Agarose gel lane 1 at far right contains MW marker, lanes 2-4 contain gene for the N-terminus His tagged gene, lanes 5-7 are blank, lane 8 contains the non his tagged gene.
Protein expression in Rosetta (DE3) pLys cells resulted in ~ 10 mg of His and non
His tagged protein for every 50g of cell pellet. Expression of the same plasmids in BL-21
(DE3) pLys cells did not result in any measurable amounts of protein. The result is attributed
to the AGG codon. Figure 2.2 shows the sequence of the DHP gene with the AGG codons
that E. coli does not read are highlighted in yellow. An initial inspection of the codons
present in the DHP gene sequence compared with the known codons used in E.coli was done.
This led to the determination that the AGG codon for the amino acid arginine, was not used
atg ggg ttt aaa caa gat att gcc acc atc cgc ggt gat ctc agg acc tat gca
cag gac att ttc ctc gca ttt ttg aat aag tac ccg gac gag agg agg tac ttc
aaa aac tat gtc ggc aaa tct gac caa gag ctc aag tca atg gcc aag ttc ggt
gat cac act gag aaa gtg ttc aac ctg atg atg gaa gtt gcg gac cga gcc acc
gat tgt gtc ccc ctt gcg tcc gac gcc aac aca ctc gtc cag atg aaa cag cat
tcc agc ctg acg act gga aac ttc gag aaa ctg ttc gtg gca ttg gtg gag tat
atg aga gcg tct ggc cag tcc ttc gac tct caa agc tgg gat agg ttc ggc aag
aat ttg gtc tcc gcg ctg agc agc gca ggc atg aag tag
Figure 2.2. Sequence of dehaloperoxidase with AGG codons highlighted. E. coli does not naturally read the AGG codon.
Dehaloperoxidase and 6xHis tagged Dehaloperoxidase have been successfully cloned
and expressed in E. coli. The use of the Rosetta cell line proved to be the key to overcoming
the codon preferencing problem, which was not allowing protein to be produced in other cell
lines. Protein purification procedures for both forms of DHP have been developed. With
current methods we are now able to produce the quantity and quality of protein necessary for
further experiments.
9. LaCount, MW., Zang, EL., Chen, YP., et al. The crystal structure and amino acid sequence of dehaloperoxidase form Amphitrite ornata, indicate common ancestry with globins, Journal of Biological Chemisty 2000; 275: 18712 – 18716.
10.Zhang, E., Chen, YP., Roaach, MP., et al. Crystallization and initial spectroscopic characterization of the heme-containing dehaloperoxidase from the marine polychaete
Amphitrite ornata,. Acta Cryst. 1996; D52: 1191-1193.
11.Roach, MP., Chen, YP., Dawson, JH., et al. Notomastus lobatus Chloroperoxidase
and Amphitrite ornata, Dehaloperoxidase both contain histidine as their proximal
heme iron ligands, Biochemistry 1997; 36: 2197-2202.
12.Lebioda, L., LaCount, MW., Woodin, SA., et al An enzymatic globin from a marine worm Nature 1999; 401: 445
13.Chen, YP., Woodin, SA., Lincoln, DE., and Lovell, CR., An unusual dehalogenating peroxidase from the marine terebellid polychaete Amphitrite ornata, The Journal of Biological Chemistry 1996; 9: 4609-4612.
14.Han, K., Woodin, SA., Ely, B., et al. Amphitrite ornata, a Marine Worm, Contains Two Dehaloperoxidase Genes, Marine Biotechnology 2001; 3: 287-292
3.1 Introduction
Dehaloperoxidase has been reported to have peroxidase activity. X-ray crystal
structures have shown that DHP has a globin fold and a distal valine. Both the globin fold
and distal valine disputes the reported peroxidase activity. Peroxidases and globins typically
have a distal histidine residue not a valine. The distal histidine residue plays a key role in
peroxidase activity and DHP was the first globin reported to have peroxidase activity.
Dehaloperoxidase lies in a unique junction in the study of structure-function relationship due
the unusual characteristics of a globin fold coupled with peroxidase activity.
The enzyme Horseradish Peroxidase (HRP, EC 1.11.17) is a highly studied
peroxidase that is commercially available; thus, we chose to model DHP assays after the
current assays in use for HRP1,2. Several assays were developed to characterize the
peroxidase activity of DHP,and a modified standard peroxidase assay was utilized as well.
Since a viable sample of the native enzyme from the marine worm Amphitrite ornata was not
obtained, no direct comparison to recombinant forms was made.
Horseradish peroxidase is a very different enzyme than dehaloperoxidase. For
instance, HRP is a plant enzyme that has native glycosylations, a calcium ion required for
function, disulfide bonds, and a channel that allows the substrate to approach the heme active
site1,2. Dehaloperoxidase is a marine worm enzyme that has no glycosylations, no required
calcium ions or disulfide bonds, and has a true binding pocket for substrate3,4. The
differences include the amino acid residues in the distal pocket, HRP has a distal histidine
where, DHP has a distal valine3-5.
The difference between HRP and DHP extended into their expression as recombinant
inclusion bodies and once the protein was freed from the inclusion bodies, the HRP protein
required folding since the E. coli produced HRP did not fold with proper disulfide bond
formations1. Dehaloperoxidase was not expressed in inclusion bodies. Despite the many
differences between dehaloperoxidase and HRP, we were able to compare reaction rates
using UV – Vis and stopped – flow analysis.
Peroxidase enzymology is complicated due to the formation of an irreversible enzyme
substrate complex, and two-substrate two-product reactions. It is common for peroxidases to
have irreversible reactions along with detectable covalent compounds as intermediates,
compound I and II, instead of enzyme-substrate complexes1. The Michaelis-Menton
approach to enzymology does not apply to the study of peroxidases. The Michaelis-Menton
approach is based on the concept that the enzyme-substrate interaction is reversible and not
stable enough to be a long lived species.
A typical peroxidase reaction is presented with the two-substrate two-product reaction
scheme in Figure 3.1. Native protein is activated to the compound I state by peroxide. Next,
one substrate molecule interacts with compound I and product one is released, which then
modifiesthe enzyme to the compound II form. The compound II form of the enzyme reacted
with a second substrate, which was then followed by the release of product two and the
regeneration of the native protein see Figure 3.1. Alternatively the protein in the Oxy state of
the protein can react with an electron to generate the Peroxy form of the protein. The Peroxy
form can react with two H+ to generate compound I. Equations 3.1 – 3.4 make up the
currently accepted mechanism for peroxidase cycle, where AH represented a reducing
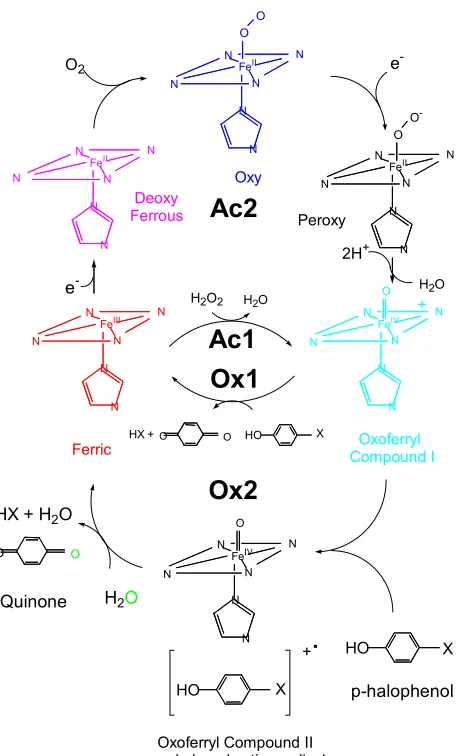
Figure 3.1. is a description of a peroxidase and monooxygenase pathways for oxidative dehalogenation of p-halophenols. The X label represents F, Cl, or Br. The pathways Ac1 and Ac2 are two possible oxygen activation pathways involving peroxide and oxygen binding (with electron transfer), respectively. The two possible oxidation mechanisms involve oxygen atom transfer (Ox1) and oxidation via electron transfer in two steps (Ox2). The oxygen of the quinone product is derived from solvent water in Ox2 as indicated by the green color of the O atom.
Peroxy Oxy Deoxy Ferrous Oxoferryl Compound I Ferric O O -O O N N N N FeII N N N N FeII N N N N N N FeII N N N N N N N N FeIII N N N N FeIV N N N N O + N N FeIV N N N N O
Oxoferryl Compound II and phenol cation radical
Ox1
Ox2 Ac1 Ac2
HO X HX +O O
H2O
H2O2 H2O
H2O
2H+
e
-O2 e
-HO X
+
.
HX + H2O
O O
HO X
k1
Native peroxidase + H2O2→ compound I + H2O (eq. 3.1)
k2
Compound I + AH → compound II + .A (eq. 3.2)
k3
Compound II + AH → Native peroxidase + .A + H2O (eq. 3.3)
H2O2 + 2AH → 2H2O + 2.A (eq 3.4)
Notice the 1:2 stoichiometry between H2O2 and substrate. The rate of substrate
consumption was twice that of H2O2. Equation 3.5 was the equation that represented the rate
of a peroxidase cycle1,6. Figure 3.2 was a pictorial representation of a peroxidase cycle as a
ping pong mechanism1. The one electron product is represented as ·A. ·A is produced when
the product can diffuse out of the active site faster than the electron transfer rate for two
electrons. Although we cannot say for sure, we do not believe that this is the mechanism of
DHP. We believe that diffusion of substrate into and out of DHP is slow enough to allow for
a two electron product to be formed.
υ/[E]o = ( 1/k1[H2O2])-1+ (k2 + k3/ k2 k3[AH] (eq. 3.5)
H2O2 H2O AH ·A AH ·A
____________________________________________________________ Native I II Native
A mechanism that is used to depict the formation of compound I of heme peroxidases
is the Poulos-Kraut push/pull mechanism. In this mechanism the push rises from the
partially negatively charged or polarized histidine ligand to the heme iron. The increased
basicity of the axial ligand stabilizes higher oxidation states (e.g. Fe(IV)) so that compounds
I and II can be formed. In peroxidases, the residues that play a role in the push are Asp and
His, along with the iron of the heme. An analogy has been made between this triad and the
catalytic triad of serine proteases7. In serine proteases the catalytic triad Asp-His-Ser
increase the basicity (nucleophilicity) of the serine residue for attack on the carbonyl carbon
of the peptide bond. The pull in the push/pull mechanism is comprised of interactions of
amino acids in the distal pocket with bound peroxide to facilitate oxygen-oxygen bound
cleavage in peroxide. This in turn is required for the formation of compound I. Since
dehaloperoxidase had a distal valine, not a histidine, a modified pull step was proposed by
our group. The proposed mechanism does not have a direct abstraction of a proton by the
distal histidine residue as does the Poulos-Kraut mechanism.
3.2 UV-Vis Spectroscopic Assays
Using a UV-Vis spectrophotometer to monitor reactions catalyzed by DHP and 6x
His DHP, the disappearance of substrate and the appearance of product were observed. It
was also possible to observe the destruction of both recombinant forms of DHP by peroxide.
All UV-Vis spectroscopic assays were performed on a Hewlett Packard chemstation UV-Vis
spectrophotometer, using a Hewlett Packard 89090A, temperature controlled cell holder. All
assays of DHP were done with the same stock of protein that was done for the 6x His DHP.
For comparison purposes, assays of DHP and 6x His DHP were performed with the same
3.2.1 DHP and 6x His DHP assays using 2,4,6-Trifloropehenol, 2,4,6-Trichlorophenol, 2,4,6-Tribromophenol, and 2.4.6-Triiodiophenol
In all assays, both recombinant forms of dehaloperoxidase were assayed at 25 oC,
while being stirred at 250 rpm in 20 mM potassium phosphate pH 6.0 buffer, 156 µM
2,4,6-trihalophenol, 50 µM hydrogen peroxide and 0.5 µM DHP. The reaction was initiated with
the addition of hydrogen peroxide. UV- Vis spectra was collected every 5 seconds for 100
seconds which resulted in 20 spectra. Stock solutions of the trihalophenols were made by
weighing out solid and dissolving the solid into 20 mM potassium phosphate pH 6.0. Heat
from a hot plate was necessary to dissolve the 2,4,6-trichlorphenol, 2,4,6-tribromophenol,
and the 2,4,6-triiodiophenol in water. The 2,4,6-triflorophenol did not require heating, since
it dissolved in aqueous solution, but it must be mixed well because it had a tendency to stick
to walls of the container. All substrate solutions were made freshly prior to use and
discarded when the UV – Vis spectrum of the solution began to differ from its original
spectra. Solutions were usually stable for four to six hours after being made. All
halophenols were ordered from Acros Organics at 98% purity or better and were used
without further purification. Buffer components and hydrogen peroxide were purchased
from Fisher Scientific Inc. Co. and used without further purification.
3.2.2 Hydrogen Peroxide Susceptibility
Peroxidases were activated when a peroxide molecule was available to initiate a
reaction between the peroxidase and substrate. Since peroxide has a vital role in the
reactions of peroxidases, the tolerance of dehaloperoxidase to peroxide became a central
issue. The peroxide susceptibility study was addressed when standard HRP assays caused
spectroscopic assays exhibited a dramatic decrease in the Soret band of dehaloperoxidase,
but there was very little change in the Soret band of HRP.
Since dehaloperoxidase has a globin fold and peroxidase activity, its response to
peroxide is of great interest. In the hydrogen peroxide susceptibility studies we chose to use
HRP as a model peroxide and horse heart myoglobin (HHMb) as a typical globin. Several
hydrogen peroxide susceptibility assays were required to determine whether
dehaloperoxidase responds to peroxide as a peroxidase or as a globin. In other words, are
compounds I and II formed and does the protein show stability with respect to degradation by
peroxide.
Hydrogen peroxide susceptibility was determined using UV-Vis spectroscopy.
Protein was added to a 1cm cuvette that had been blanked using 10 mM potassium phosphate
pH 7.0. Hydrogen peroxide was added to the cuvette at 1 to 1000 molar ratio of protein to
peroxide. The reaction was monitored every 3 to 5 seconds after addition of peroxide.
Hydrogen peroxide susceptibility of HHMb was determined at a 1 to 100 molar ratio of
protein to peroxide, due to its rapid degradation at the higher ratio.
3.3 Stopped – Flow Assays of 6x His DHP
Stopped-flow analysis of HRP, is a common technique which is employed to obtain
rate constants in work done in the laboratory of H. Brian Dunford2. We chose to use
2,4,6-tribromophenol in the stopped-flow assays, since it represented a substrate which is active for
both recombinant dehaloperoxidase and HRP. We wish to thank Dr. Clay Clark of
Department of Biochemistry at North Carolina State University, and members of his
laboratory for the opportunity to use their Applied Photohpysics SX.18MV Stopped-flow
For the stopped-flow experiments one drive syringe contained the
2,4,6-tribromophenol, 20 mM potassium phosphate pH 6.0, 1.1µM or 11µM hydrogen peroxide
and 0.1M potassium nitrate while the second drive syringe contained the 6x His DHP or HRP
at a concentration of 1.2µM or 12µM and 0.1M potassium nitrate. Solutions of
tribromophenol were monitored via UV-Vis, and once the UV-Vis spectrum of the
2,4,6-tribromophenol solution began to vary from its original spectrum, it was discarded and a new
solution was made. Solutions of 2,4,6-tribromophenol were typically stable for six hours.
Drive and storage syringes were rinsed extensively with 18MΩ water, followed by
flushes with buffer solutions and reaction solution before use and between kinetic runs. The
stopped-flow apparatus was cleaned using 10 shots of 18 ΩM, water (a shot was one mixing
reaction) followed by 10 shots of buffer solution, followed by 10 shots of the reaction
solution. Once the appropriate solutions had been shot, an overlay of shots 9 and 10 were
done to see if there were variations. If there were no variations between shots 9 and 10 then
the experiment was ready, but if there were variations further cleaning was necessary.
Shot volume was set to 500µL for experiments with 1.2µM 6x His DHP or HRP and
1.1µM hydrogen peroxide and the volume was decreased to 120µL for 12µM 6x His DHP or
HRP and 11µM hydrogen peroxide. The larger volume for the more dilute experiment was
necessary to obtain data with less noise. Since the more concentrated experiment allowed us
to use a smaller volume, we were able to collect data at constant pressure conditions. The
constant pressure condition eliminated much of the noise that plagued the lower
concentration/higher volume experiment. All future stopped-flow experiments should be
3.4 UV-vis Spectroscopic Assays Results of DHP and 6x His DHP assays using
2,4,6-Trifloropehenol, 2,4,6-Trichlorophenol, 2,4,6-Tribromophenol, and 2.4.6-Triodiophenol
Since the native substrate for DHP is 2,4,6-tribromophenol, UV-vis absorption assay
was developed for this substrate and was then applied to other substrates. To identify the
differences in the two forms, our initial goal was to assay the recombinant DHP and the
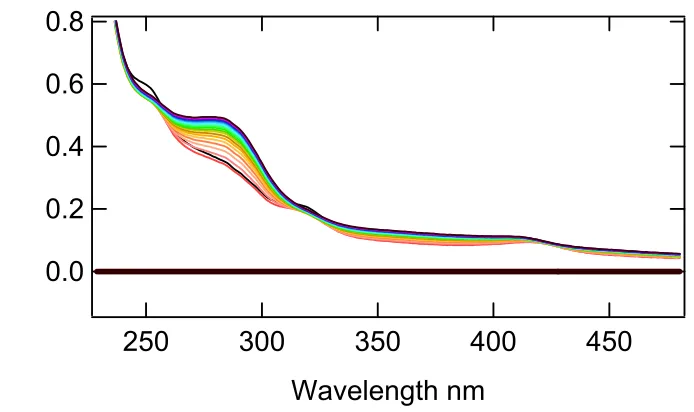
recombinant His tagged DHP. In Figure 3.3 DHP was assayed with 2,4,6-tribromophenol as
the substrate. The initial spectrum was black, which was taken before the addition of
peroxide. Each spectrum after the initial black spectrum was taken approximately five
seconds apart. The color scheme following our initial black reading follows this pattern:
orange, yellow, green, blue, and then purple. The last spectrum was taken 97 seconds after
the initiations of the reaction.
0.8
0.6
0.4
0.2
0.0
Absorbance a.u.
450
400
350
300
250
Wavelength nm
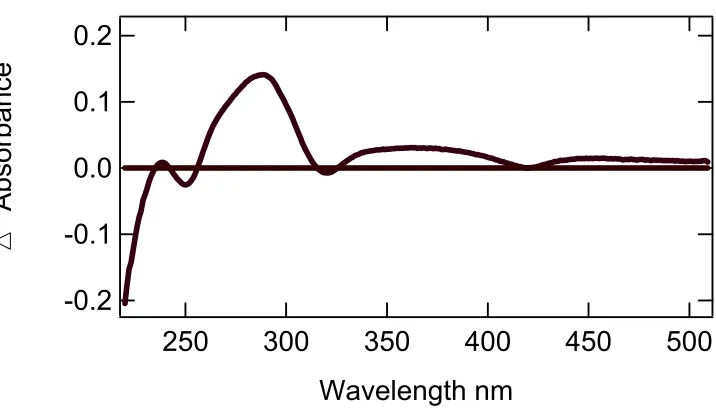
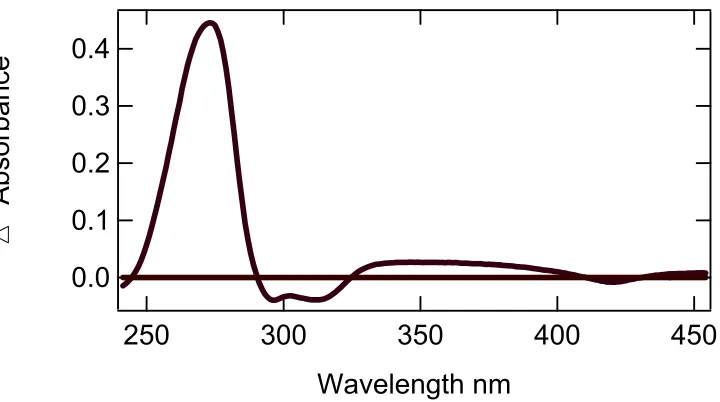
The difference spectrum in Figure 3.4, of the first and last spectra showed the
wavelengths of the greatest interest to be 289 nm, 320nm, and 420nm. The peak at 289nm
was attributed to the formation of product; while, the dip at 320 nm represented the
consumption of the substrate. The valley formed at 420 nm was due to the heme shift and
the eventual degradation of the protein (please see section 3.5 on peroxide susceptibility for
an explanation of this).
0.2
0.1
0.0
-0.1
-0.2
Absorbance
500
450
400
350
300
250
Wavelength nm
Figure 3.4 Difference spectrum of the first and last spectra collected from a UV-Vis assay of DHP in 20 mM potassium phosphate pH 6.0 using 2,4,6-tribromophenol as the substrate.
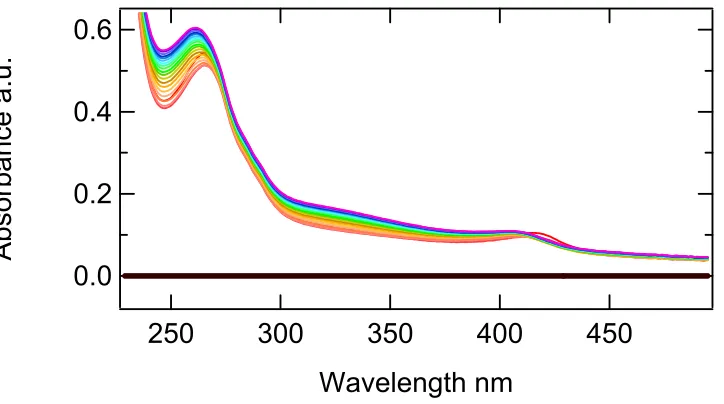
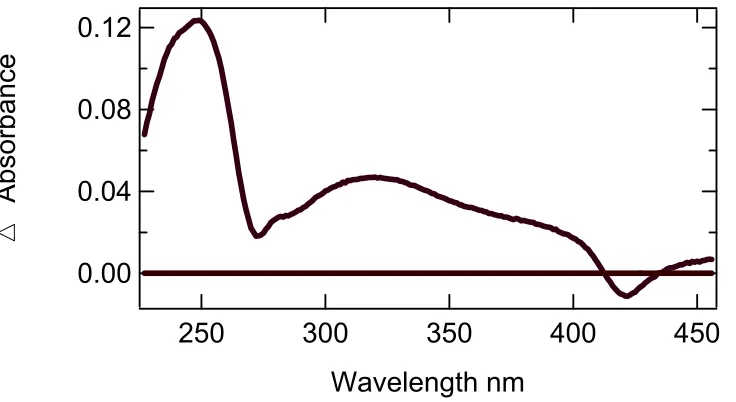
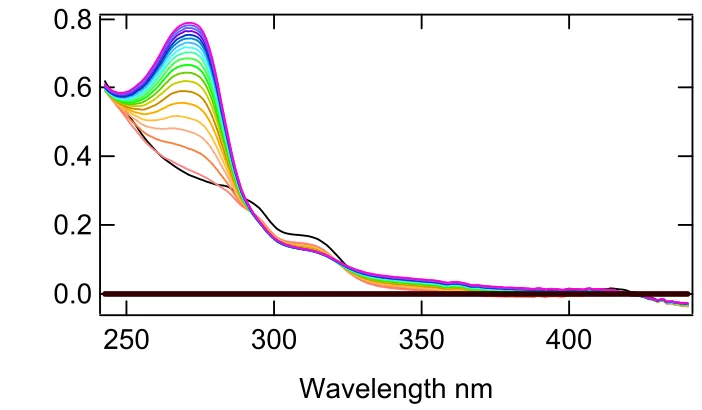
In assays of 6x His, DHP showed identical results (see Figure 3.5). The difference
spectrum in Figure 3.4 of the first and last spectra showed the wavelengths of the greatest
interest to be 289 nm, 320nm, and 407nm. The peak at 289nm and 320 nm represented the
substrate and product as it was in the assay of DHP. Note that in the assays of DHP, the
wavelength that represented the difference in the heme was 420nm. The valley formed at
0.4
0.3
0.2
0.1
0.0
Absorbance a.u
450 400
350 300
250
Wavelength nm
Figure 3.5 UV-Vis assay of 6x His DHP, 2,4,6-tribromophenol at pH 6.0.
0.20 0.15 0.10 0.05 0.00 -0.05 -0.10
Absorbance
450 400
350 300
250
Wavelength nm
The assays of DHP and triflorophenol, trichlorophenol, and
2,4,6-triiodiophenol showed similar results, with the major difference being in the wavelengths
representing the substrate consumption and the yield of product. In comparing the result of
the difference assays for the two forms of dehaloperoxidase, we obtained similar peaks for
substrate and products. The major variation to this was that the heme shift appeared different
between 6x His DHP and DHP. See figures 3.7 – 3.18 and table 3.1.
0.6
0.4
0.2
0.0
Absorbance a.u.
450
400
350
300
250
Wavelength nm
0.12
0.08
0.04
0.00
Absorbance
450
400
350
300
250
Wavelength nm
Figure 3.8 Difference spectrum of the first and last spectra collected from a UV-Vis assay of DHP in 20 mM potassium phosphate pH 6.0 using 2,4,6-triflorophenol as the substrate.
0.4
0.3
0.2
0.1
0.0
Absorbance a.u.
450 400
350 300
250
Wavelength nm
0.20
0.15
0.10
0.05
0.00
Absorbance
450 400
350 300
250
Wavelength nm
Figure 3.10 Difference spectrum of the first and last spectra collected from a UV-Vis assay of 6x His DHP in 20 mM potassium phosphate pH 6.0 using 2,4,6-triflorophenol as the substrate.
0.8
0.6
0.4
0.2
0.0
Absorbance a.u.
400
350
300
250
Wavelength nm
0.4
0.3
0.2
0.1
0.0
Absorbance
450
400
350
300
250
Wavelength nm
Figure 3.12 Difference spectrum of the first and last spectra collected from a UV-Vis assay of DHP in 20 mM potassium phosphate pH 6.0 using 2,4,6-trichlorophenol as the substrate.
0.4
0.3
0.2
0.1
0.0
Absorbance a.u.
450 400
350 300
250
Wavelength nm
0.3
0.2
0.1
0.0
Absorbance
400 350
300 250
Wavelength nm
Figure 3.14 Difference spectrum of the first and last spectra collected from a UV-Vis assay of 6x His DHP in 20 mM potassium phosphate pH 6.0 using 2,4,6-trichlorophenol as the substrate.
0.6
0.4
0.2
0.0
Absorbance a.u.
450 400
350 300
250
Wavelength nm
80 60 40 20 0 -20
Absorbance x10
-3
400 350
300 250
Wavelength nm
Figure 3.16 Difference spectrum of the first and last spectra collected from a UV-Vis assay of DHP in 20 mM potassium phosphate pH 6.0 using 2,4,6-triiodophenol as the substrate.
0.4
0.3
0.2
0.1
0.0
Absorbance a.u
450 400
350 300
250
Wavelength nm
0.12
0.08
0.04
0.00
Absorbance
400 350
300 250
Wavelength nm
Figure 3.18 Difference spectrum of the first and last spectra collected from a UV-Vis assay of 6x His DHP in 20 mM potassium phosphate pH 6.0 using 2,4,6-triiodophenol as the substrate.
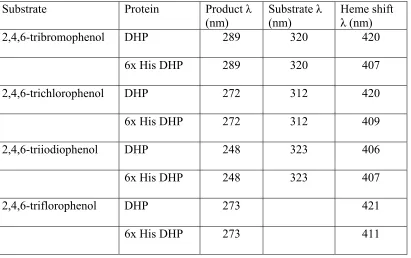
Substrate Protein Product λ
(nm) Substrate (nm) λ Heme shift λ (nm)
2,4,6-tribromophenol DHP 289 320 420
6x His DHP 289 320 407
2,4,6-trichlorophenol DHP 272 312 420
6x His DHP 272 312 409
2,4,6-triiodiophenol DHP 248 323 406
6x His DHP 248 323 407
2,4,6-triflorophenol DHP 273 421
6x His DHP 273 411
6x His Dehaloperoxidase can use floro-, chloro-, bromo- and iodio- trihalogenated
phenols as substrates. We have shown that assays of 6x His DHP with trihalogenated
phenols results in substrate consumption and heme degration. Limited product turnover is
attributed to heme degration. Definitive rates of product formation and substrate
consumption can not be calculated from the UV – vis assays do the heme degration.
3.5 Hydrogen Peroxide Susceptibility Results
Since dehaloperoxidase has a globin fold and peroxidase activity its response to
peroxide is of great interest. Assays that use a molar ratio of 1:1 of protein to peroxide
would have theoretically generated compound I. In all of the assays shown thus far, an
excess of peroxide was used. The use of excess peroxide results in the formation of
compound II in all of the reactions of 6x His DHP and HRP. ASoret band at 420 nm, which
was a typical value of a compound II Soret, was detected using the UV-vis absorbance assay.
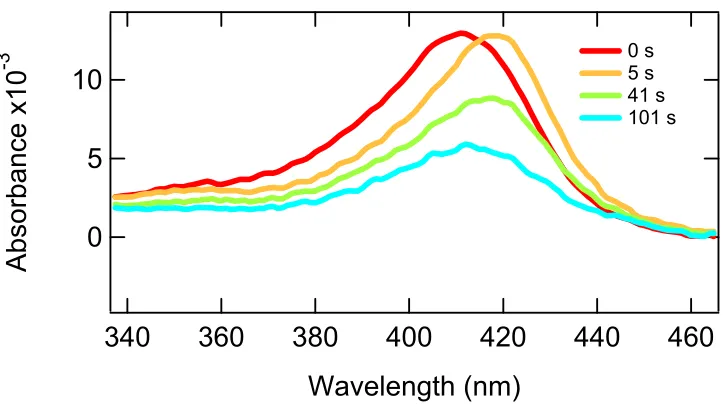
In Figure 3.19, 6x His DHP has an initial absorbance at 420 nm, which resulted from
0.07 µM of protein (red trace). Five seconds after the addition of hydrogen peroxide (final
concentration of 70 µM) was added to the protein solution, the Soret shifted to 420 nm which
was indicative of compound II (yellow trace). One hundred and one seconds after the
addition of peroxide, the Soret shifted back to the original location, but the intensity was
decreased (blue trace). At 101 seconds the absorbance of the Soret represented 0.03 µM of
6x His DHP present. Addition of peroxide to 6x His DHP resulted in rate 5.7 x 10 –6µM of
10
5
0
Absorbance x10
-3
460
440
420
400
380
360
340
Wavelength (nm)
0 s 5 s 41 s 101 s
Figure 3.19 Hydrogen Peroxide susceptibility test on 6x His DHP to probe tolerance to excess peroxide.
The red trace represented 6x His DHP before the addition of peroxide in the resting
state; note, the Soret maximum is at 414 nm. The orange trace which was taken 5 seconds
after the addition of peroxide and showed a shift in the Soret maximum to 420 nm, which is
typical of compound II. The green trace was a mixture of resting 6x His DHP and compound
II; note, it was broader and had a Soret maximum at 418 nm. At 101 seconds after the
addition of peroxide the Soret maximum was back to 414 nm, though the intensity was lower
(blue trace).
Since the Soret was shifting, we chose to look at the area under the Soret band instead
of a single wavelength for an indicator of how much intact 6x His DHP was present at the
times indicated in the figure above. We chose to define the Soret band from 340 nm to 460
nm. When we calculated the area under the Soret band between 340 nm and 460 nm and
DHP was exponential. An exponential decay was expected for a pseudo first order decay and
since an excess of peroxide induces a pseudo first order reaction, this result was expected.
0.65
0.60
0.55
0.50
0.45
0.40
0.35
Area from 340 nm to 460 nm
20
40
60
80
100
Time s
Figure 3.20 Graph of the area between 340 nm and 460 nm that lies under the Soret band for 6x His DHP vs. seconds after addition of 1000 molar excess of peroxide was added to the protein solution.
Hydrogen peroxide susceptibility tests of HRP showed a very different response to
excess peroxide. In Figure 3.21 the red trace representedHRP before peroxide was added.
Notice that the Soret maximum was at 420 nm; thus, compound II was present. According to
Dr. H Brian Dunford this was common when there are impurities in the water used to
dissolve the freeze dried protein. The resting state of HRP was 403 nm; thus, we are seeing
compound II at the onset of the experiment. Thirty-five seconds after the addition of 1000
molar excess peroxide we saw that the Soret band had decreased very slightly (green trace).
but no further decrease was noted (blue trace). The decay of HRP do to the addition of
peroxide is negligible during the time of this experiment.
35
30
25
20
15
10
Absorbance x10
-3
440
430
420
410
400
390
380
Wavelength nm
0 s 35 s 83 s
Figure 3.21. Assay of hydrogen peroxide susceptibility test on HRP to probe HRP’s tolerance to excess peroxide.
Since the Soret was shifting in the 6x His DHP assay we chose to look at the area
under the Soret band instead of a single wavelength for an indicator of how much intact 6x
His DHP was present at different times. We chose to do the same area calculation with the
HRP data. We chose to define the Soret band from 380 nm to 440 nm. When we calculated
the area under the Soret band between 380 nm and 440 nm and graphed area vs. time, we
1.46
1.44
1.42
1.40
1.38
1.36
Area from 380 nm to 440 nm
20
40
60
80
Time s
Figure 3.22 Graph of the area between 380 nm and 440 nm that lies under the Soret band for HRP vs. seconds after addition of 1000 molar excess of peroxide was added to the protein solution.
Hydrogen peroxide susceptibility test of HHMb showed a third very different
response to excess peroxide. In Figure 3.23 the initial spectrum of HHMb was taken before
the addition of peroxide (red trace). The black trace was taken 32 s after 1000M excess of
peroxide was added. Since degradation of HHMb occurred rapidly, we chose to inspect
20
10
0
-10
Absorbance x10
-3
440
420
400
380
Wavelength nm
0 s 32 s
Figure 3.23 Assay of hydrogen peroxide susceptibility test on HHMb to probe HHMb’s tolerance to excess peroxide.
In Figure 3.24 the initial spectrum of HHMb showed the Soret maximum to be at 407
nm (red trace). Five seconds after the addition of 100 fold excess peroxide, the Soret band
decreased in intensity, but the maximum remained constant at 407 nm (orange trace). Eight
seconds after the start of the reaction, a shift in the Soret maximum and broading of the line
shape (light orange trace) was observed. At 11 seconds we noticedthe Soret band had a
maximum at 422 nm (green trace). The Soret maximum remained at 422 nm up to 98
15
10
5
0
Absorbance x10
-3
460
440
420
400
380
360
340
Wavelength nm
0 s 5 s 8 s 11 s 14 s 98 s
Figure 3.24 Hydrogen Peroxide susceptibility test on HHMb to probe HHMb tolerance to excess peroxide.
Once again we chose to look at the area under the Soret band, instead of a single
wavelength for an indicator of how much intact HHMb was present at different times. We
chose to define the Soret band from 340 nm to 440 nm. When we calculated the area under
the Soret band between 340 nm and 440 nm and graphed the area vs. time, we obtained
Figure 3.25. In this figure the degradation of HHMb was erratic. Once again this was a
different response than what was obtained for 6x His DHP and a different response than that
which was obtained for HRP. Addition of 100 molar excess of peroxide to HHMb resulted
0.84
0.82
0.80
0.78
0.76
0.74
Area from 340 nm to 460 nm
20
40
60
80
Time s
Figure 3.25 Graph of the area between 340 nm and 460 nm that lies under the Soret band for HHMb vs. seconds after addition of 1000 molar excess of peroxide was added to the protein solution.
3.6 Stopped-Flow Assays Results
Figures 3.26 and 3.27 showed stopped-flow assays of 6x His DHP and HRP. In
Figure 3.26 consumption of substrates was monitored at 316 nm. The appearance of product
was monitored at 272 nm in Figure 3.27. HRP wasrepresented in the solid traces and 6x His
DHP is represented in the dashed traces. Table 3.2 contains the terms used in the exponential
0.50
0.48
0.46
0.44
0.42
Absorbance @ 316 nm
10
8
6
4
2
0
Time (s)
HRP Substrate DHP SubstrateFigure 3.26 Stopped-flow experiment monitoring the consumption of 2,4,6-tribromophenol at 316 nm by HRP (solid line) and 6x His DHP (dashed line). Assay conditions were 20 mM potassium phosphate pH 6.0, 0.1 M KNO3, 12 µM enzyme, and 11 µM H2O2.
0.58
0.56
0.54
0.52
0.50
Absorbance @ 272 nm
10
8
6
4
2
0
Time (s)
HRP Products DHP ProductsFigure 3.27 Stopped-flow experiment monitoring the grow-in of products at 272 nm by HRP (solid line) and 6x His DHP (dashed line). Assay conditions were 20 mM potassium
Wavelength Enzyme y A k Turnover #
316 nm 6x His DHP 0.42297 0.77434 0.070127 3.00
316 nm HRP 0.57867 -0.076449 3.6519 138
272 nm 6x His DHP 0.56742 -0.067414 0.088627 3.00
272 nm HRP 0.41831 0.064612 3.5505 123
Table 3.2 Exponential fits of the traces in figure 3.24 and 3.25 results and approximate turnover numbers. Turnover numbers have units of µmole of substrate or product * µmole of enzyme-1 * s-1.
3.7 Conclusions
UV-vis spectroscopic assays of DHP and 6x His DHP show that both recombinant
forms of dehaloperoxidase were active on triflorophenol, trichlorophenol,
2,4,6-tribromophenol and 2,4,6-triiodiophenol. Both recombinant enzymes were yield products
that had the same UV-Vis characteristics on the same time scale. The major difference that
was observable in the UV-Vis assays of DHP and 6x His DHP was the shift that has been
identified in the heme degradation. The nature of this difference between the two
recombinant forms of dehaloperoxidase requires further investigation. Due the speed of the
degradation, this study should be done as a stopped-flow experiment. Degradation do to
addition of 1000 molar excess peroxide was negligible for HRP. Degradation do to addition
of 1000 molar excess peroxide was complete and immediate for HHMb. Degradation do to
addition of 1000 molar excess peroxide resulted in 5.7 x 10⁻⁶µM 6 x His DHP per second per
µM peroxide.
Stopped flow analysis of 6x His DHP and HRP has shown us that HRP was 52 times
generating product. The stopped flow study also showed us that the time resolution on our
UV-Vis instrument was sufficient to continue studies of 6x His DHP, but not for HRP.
Since the results of the peroxide susceptibility of DHP resembled that of myoglobin,
it would indicate that dehaloperoxidase may not use peroxide as a native cofactor. Instead of
peroxide, dehaloperoxidase may have used a flavoprotein that aided in the electron and
proton transfer to the heme that had oxygen bound in the sixth coordination site. Such
electron and proton transfer in the presence of oxygen is known in the chemistry of
cytochrome P450’s and the use of a flavoprotein is required for function of chloroperoxidase
form Notomastus lobatus,the only other known heme peroxidase with a globin fold.
In the literature, dehaloperoxidase was reported to produce a haloquinone product.
The haloquinone would result from a two electron transfer from the trihalogenated phenol.
We have not been able to isolate this product, but if true, then the standard mechanism for
peroxidase cycle would apply to dehaloperoxidase, since the excepted cycle had two one
electron transfer steps due to rapid diffusion of substrate and product. Breaking from the
excepted paradigm seemed appropriate in the case of dehaloperoxidase, since
dehaloperoxidase had an actual binding site for substrate that HRP did not. This site could
act as a cage that traps the substrate long enough for a two electron transfer to occur.
The assays in this thesis represented an attempt to understand the mechanism of
dehaloperoxidase. Much more work needs to be done, but conditions for future studies using
the stopped-flow approach to determine rate constants has been established and are currently
being worked on as well as attempts to isolate and characterize compound I. We are
attempting to isolate assay products via LC-MS and GC-MS. We are also probing the use of
ongoing and much of the methods development portion of the assay studies has already been
References
16.H. Brian Dunford, Heme Peroxidases, Wiley-VCH, New York, 1993
17.Hewson, WD., and Dunford, HB., Journal of Biological Chemistry, 1976; 251: 6036-6042.
18.Zhang E, Chen YP, Roaach MP, et al. Crystallization and initial spectroscopic
characterization of the heme-containing dehaloperoxidase from the marine polychaete
Amphtrite ornate . Acta Cryst. 1996; D52: 1191-1193.
19. Chen YP, Woodin SA, Lincoln DE, Lovell CR. An unusual dehalogenaating peroxidase from the marine terebellid polychaete Amphirite ornate. J. Biol.Chem. 1996; 271: 4609-4612.
20.Roach, MP., Chen, YP., and Dawson, JH., Notomastus lobatus chloroperoxidase and
Amphirite ornata dehaloperoxidase both contain histidine as their proximal heme iron
ligand Biochemistry, 1997; 36: 2197-2202
21.Goodin DB, McRee DE. The Aspp-His-Fe Triad of cytochrome c peroxidase controls the Reduction Potential, Electronic Structure, and Coupling of the Tryptophane Free Radical to the Heme. Biochemistry 1993; 32: 3313-3324.
22.W. W. Clealand, The Enzymes, 3rd edition, P. D. Boyer, ed; Academic, New York,
4.1 Introduction
Myoglobin has been the model system for protein structure-dynamics-function
studies for greater than 40 years1. Crystal structures show a pattern of eight α- helixes
surrounding a heme prosthetic group. Ligands that bind to the heme must find a way though
the helixes to either enter into the protein interior and bind to the heme or to escape from the
globin2. Detailed research on the mechanism of ligand binding seems to have prompted
more questions that it has answered. The idea that ligand binding is a one step process had
to be modified when the non-exponential internal recombination and multistep kinetics gave
an insight to a more complicated ligand binding process 3.
Recently myoglobin has been studied using x-ray crystallography of photoproducts,
time-resolved spectroscopy and protein engineering. These studies have shown that
photolyzed ligands which reside close to the heme in the primary docking site B. Two more
internal cavities have been identified as C and D, are both occupied by photolized CO
ligands. There are a total of four sites that are large enough to hold a Xe atom, and with
recent experiments it has been shown that these sites are responsible for both ligand capture
and escape 1-6.
We have combined Fourier transform inferred spectroscopy with cryogenic
temperatures and photolysis to probe the CO recombination of 6x His DHP. The purpose of
these experiments is to explore of electrostatics and steric hindrance of the ligand binding
pocket as well as the docking sites the ligand occupies after photolysis. Globins have highly
conserved histidine 64 residues and valine 68 residues on their distal side. Dehaloperoxidase
has both histidine and valine residues except they are in an alternate orientation with the
residues have been shown to be part of the overall kinetic barrier to ligand binding, in
myoglobin systems, we believe dehaloperoxidase would be very interesting to study using
this method1-5.
The imidazole side chain of the histidine 64 in myoglobin is protonated at low pH.
The protonated state causes the residue to swing toward the solvent to better solvent the
positive charge which results in the open conformation that has been associated with Ao. Ao
is characterized by an apolar pocket and in myoglobin appears at ~1965 cm-1. The closed
conformation is related to A1 and A3, at ~1945 and ~1933 cm-1, where the positive partial
charge of the Nε–H of the histidine 64 imidazole interacts electrostatically with the bound
CO. Opposite orientations of the CO molecule with respect to the heme have been associated
with B2 and Bl at 2119 and 2131 cm-1. Bo, 2150 cm-1, represents CO ligands at site B in the
A3 conformation with a strong interaction with histidine 64 in the unbound state1.
4.2 Methods
Sample preparations- Protein was purified from E. coli as previously described in this
thesis. IR samples were prepared so that the final concentration of buffer was 10 mM
potassium phosphate at pH of 7.0 or 4.0. Glycerol was used in the IR samples as a
cryoprotectant at 50% (v/v). Protein solutions of buffer and glycerol were purged with
nitrogen gas to remove oxygen. Then the sample was reduced with 1M sodium dithionite to
yield a ferric sample by adding a trace of the dithionite to the oxygen free sample. The ferric
sample was then purged with CO gas to generate the bound CO ligand.
FTIR and Cryogenic Setup- A few microliters of the protein solution were placed
between two CaF2 or ZnSe windows separated by a 25 µm spacer. The windows were
Oxford R.5456.4 cold finger, equipped with a temperature sensor and digital temperature
controller. Data was collected using a Bio-Rad FS 3000x FTIR bench with Bio-Rad Win-Pro
IR version 2.97software at 2 cm-1 resolution. The bench was purged with dry air to remove
water vapor before and during data collection.
Data collection method- Once a sample was loaded into the cold finger and placed in
the bench, a few minutes were allowed for purging of the spectrometer with a dry air line to
remove water vapor. Several spectra were taken at room temperature before helium transfer
started. Once the helium transfer started temperature was monitored until it reached ~80 K
when the cold finger was evacuated by vacuum. Temperatures of 5K were reached and held
constant during the collection of data that represented the pre photolysis data set. The CO
ligand was then photolyzed by a Minilite, Yd-YAG, until the CO peak was no longer present
in the sample (5-15 minutes). The temperature was then allowed to warm slowly. The
temperature was held constant or allowed to vary only 1K during data collection at various
temperatures.
4.3 Results
Data were collected and initially analyzed using Bio-Rad’s Win-Pro IR v2.97. Once
all data were collected all spectra were ratioed to a background spectrum consisting of
windows without protein. The data that resulted was in absorbance. Next, the data were
baseline corrected in Win-Pro v2.97 and finally imported into Wavematrix Igor 5.0. The
following figures 4.1-4.15 are examples of the data collected in this experiment. From these
figures we were able to determine the stretching frequency for the CO or A states, and B
-30 -20 -10 0 Absorbance x10 -3 2020 2000 1980 1960 1940 1920 1900 Wavenumber 53 K 56 K 60 K 70 K 81 K 91 K 100 K 110 K 140 K 150 K
Figure 4.1 DHP-CO pH 7.0 νC-O or A states are located at 1966 1950, and 1942 cm-1.
Spectra graphed from blue to red where blue is the lowest temperature and red is the highest temperature. Notice the population shift form 1942 cm-1 to 1950 cm-1 as the temperature increases. -80 -60 -40 -20 0 Absorbance x10 -3 2000 1980 1960 1940 1920 1900 Wavenumber 120 K 115 K 104 K 96 K 86 K 74 K 62 K 53 K 33 K 25 K 16 K 9 K 6 K
Figure 4.2 DHP-CO with TBP pH 7.0 νC-O or A states are located at 1951 cm-1 and 1942 cm -1. Notice that the peak located at 1942 cm-1 is present at lower temperatures but disappears
6 4 2 0 Absorbane x10 -3 2160 2150 2140 2130 2120 2110 Wavenumber 6 K 9 K 16 K 25 K 33 K
Figure 4.3 DHP-CO with TBP pH 7.0 shows the B bands as 2120 cm-1,2128 cm-1 and 2135 cm-1. Notice the shift from 2120 cm-1 at lower temperatures to 2135 at higher temperatures with the near constant peak at 2128 cm-1.
-40 -30 -20 -10 0 10 Absorbance x10 -3 2020 2000 1980 1960 1940 1920 1900 Wavenumber 122 K 116 K 101 K 92 K 76 K 66 K 55 K 48 K 37 K 27 K 12 K 8 K
Figure 4.4 HHMb-CO pH 7.0 shows νC-O or A states are located at 1946 cm-1 and there is no