Skin Lesion Classification Using Hybrid
Spatial Features and Radial Basis network
P.Jayapal ,R.Manikandan , M.Ramanan , R.S. Shiyam Sundar
1, T.S. Udhaya Suriya
2U.G. Student, Department of Biomedical Engineering Adhiyamaan College Of Engineering, Hosur, Tamil Nadu, India1
Associatet Professor, Department of Biomedical Engineering Adhiyamaan College Of Engineering, Hosur, Tamil Nadu, India2
Abstract: In this paper we used hybrid spatial features representation and Radial basis type network classifier to
classify melanoma skin lesion. There are five different skin lesions commonly grouped as Actinic Keratosis, Basal Cell Carcinoma, Melanocytic Nevus / Mole, Squamous Cell Carcinoma, Seborrhoeic Keratosis. To classify the queried images automatically and to decide the stages of abnormality, the automatic classifier PNN with RBF will be used, this approach based on learning with some training samples of each stage. Here, the color features from HSV space and discriminate texture features such as gradient, contrast, kurtosis and skewness are extracted. The lesion diagnostic system involves two stages of process such as training and classification. An artificial neural network Radial basis types is used as classifier. The accuracy of the proposed neural scheme is high among five common classes of skin lesions .This will give the most extensive result on non-melanoma skin cancer classification from color images acquired by a standard camera (non-ceroscopy). Final experimental result shows that the texture descriptors and classifier yields the better classification accuracy in all skin lesion stages.
Keywords: Computer Aided Diagnosis , Texture Analysis , Skin Cancer , Neural Network , Segmentation
I. INTRODUCTION
II . LITERATURE SURVEY
There are several existing methods were there to classify the skin lesions or to detect abnormal streaks in skin. The existing method are following as Feature extraction, Classification of cancer. These method efforts to study, diagnose, and treat such type of melanoma skin lesions.
A. Principal Component Analysis
This is the first method proposed to classify and diagnose the melanoma skin lesions in order to reduce the computational complexities, while increasing the possibility of not being trapped in local minima of the back-propagation of the neural network [1] . This method uses Asymmetry, Border irregularity, colour and Diameter features from an input(cancer) image to classify and also Moments Fourier Feature: Irregularity Index colour variance Spherical colour Coordinates, Relative Chromaticity, Intensity-Hue-Saturation are the built in features of the input image are been taken. Extracted built-in features of the image are then processed by PCA. The purpose of PCA process is to reduce the number of features of' the images into orthogonal features that still have the whole information. Since longer computing time of the training process is one of the drawback in the back-propagation neural network, the reduced-number of the features by PCA will increase the computing speed without sacrificing tile information.Here the PCA(principal component analysis) is applied to the originally training patterns and it utilizes the cross entropy error function between the output and the target patterns. A multilayer perceptron (MLP) neural network with back propagation algorithm is used[1]. At each iteration, the error between the actual output and the desired output will be reduced, by changing the value of the connection weight. However, this algorithm has two drawbacks that are often pointed out, i.e.: the very slow computing speed and the possibility of being trapped in local minima. To that purpose, the PCA as the preprocessor of the neural network, arc used to reduce the complexity and computing time, while for increasing the probability of not being trapped in local minima, a cross entropy error function is used, instead of usual quadratic error functionWith the help of this method, more built-in features of the cancer image through its colour and the cancer shapescould be used as the input of the system leading to higheraccuracy of finding the differences between ma1ignantcancer from the benign one[1]. Using this approach, for reasonably balance of training/testing sets, above 91.8% of correct classification of malignant and benign cancer could be obtained. But in this method, High Computational load and poor discriminatory power are main drawbacks.
B.K-Nearest Neighbors based classification
III.METHODOLOGY
In this paper we are proposing an Computer Aided Diagnosis[4] system based on Hybrid spatial features involves color features and texture descriptors and New probabilistic neural network(Radial Basis Network type) classifier using a MATLAB software to Diagnose and classify the skin lesions in a feasible way.
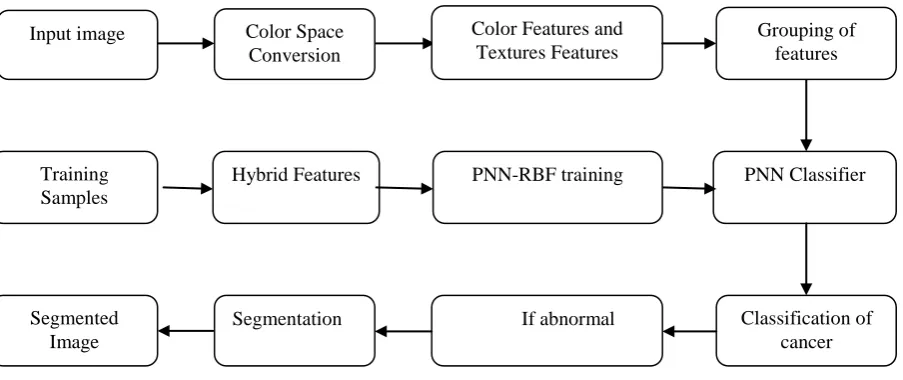
Figure 1 shows the block diagram of the proposed method. The proposed method consist of artificial neural network model probabilistic neural network is used here to act as a classifier with radial basis function for network activation function[4]. In this two different descriptors are utilized to extract the characteristics from various skin lesions and its fused features gives better classification with the help of probabilistic neural network. The probabilistic neural network is an final stage of classification but in order to classify the cancer the PNN needs the built in features of the test image is given as an input to the neural network and finally segmenting the classified cancer to determine the stages of abnormality[4]. The proposed method is having four stages implementation they areColor Space Conversion, Features Extraction, New PNN Training and Classification, Segmentation. Where the feature selection is embedded in the hierarchical framework that chooses the most relevant feature subsets at each node of the hierarchy[4].
From the figure 1 the input image is also called as test images where this image is used to determine the type of cancer. The test image is conveted from RGB to HSV color space and from the HSV the region the built features are extracted such as mean, covariance, energy, covariance, contrast, correlation coefficient, homogeneity for both Hue and Saturation region[4]. And grouping of all features in to an matrix format in a column wise. Similarly the same features are extracted from the training samples. The training samples contains five predefined images for each five type of cancer and also for normal. Finally the each training samples are grouped according to the category of type of cancer.In the PNN-radial basis function training the probability values are been set to each type of training samples. The probability values differs from the each type cancer images present in the training samples not for each image in the same type of cancer images. This training samples with probability values are given to the PNN classifier to classify the cancer.
Fig . 1 Basic Block Diagram
In PNN classifier it relates the each extracted feature values of an test image to the each training samples feature values, if the value of extracted feature values are equal to any one of the training samples it notes the probability of that training sample[3].Similarly the fourteen features in an test image is compared and it equals at any one of the training samples. Finally the higher probability value is taken from training samples which is mostly matched equal from the
Input image Color Space Conversion
Color Features and Textures Features
Grouping of features
Classification of cancer PNN Classifier Training
Samples
Segmentation If abnormal Hybrid Features PNN-RBF training
test images. From the probability value the type of cancer is determined and the resultant image will be segmented to determine the stages of abnormality. In the segmentation the fuzzy c-means algorithm is used.
A .Feature Extraction
From the detected region, the texture features will be extracted for supervised training. The features to be extracted are, Texture, Color features. The features extracted from both the test and training images are as mean, covariance, energy, covariance, contrast, correlation coefficient, homogeneity. These features are the built in features present in the converted HSV image[2].
1) Energy :
It is a measure the homogeneousness of the image and can be calculated from the normalized COM. It is a suitable measure for detection of disorder in texture image.
J=∑i=1 ∑j=1( p ( i , j ) )2 (1)
2)Entropy:
Entropy gives a measure of complexity of the image. Complex textures tend to have higher entropy
S = -∑i=1 ∑j=1 p ( i , j ) log ( p ( i , j ) ) (2)
Where,
p(i , j) is the co-occurrence matrix
3)Contrast:
Measures the local variations and texture of shadow depth in the gray level co-occurrence matrix.
Contrast I = ∑ ∑(x-y)2 p(x,y) (3)
4)Correlation Coefficient:
Measures the joint probability occurrence of the specified pixel pairs.
sum(sum((x- μx)(y-μy)p(x , y)/σxσy)) (4)
5)Homogeneity:
Measures the closeness of the distribution of elements in the GLCM to the GLCM diagonal.
Sum (sum(p(x , y)/(1 + [x-y]))) (5)
B .Neural Network Classifier
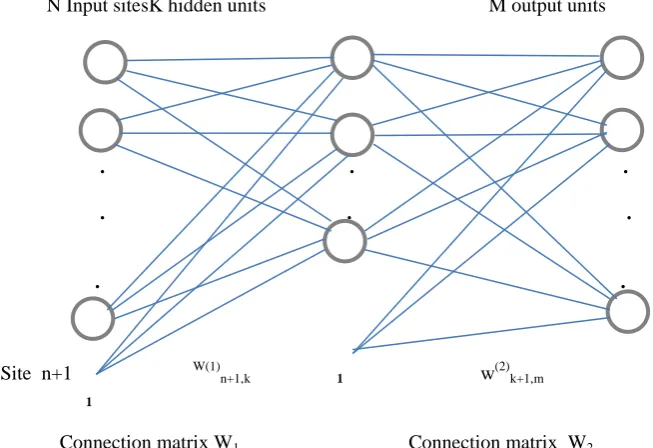
Here, Supervised learning with non-knowledge based classifier will be used for image classification. The neural network model PNN is used here to act as a classifier with radial basis function for network activation function. The output of the network is a linear combination of radial basis functions of input and neuron parameters. In radial basis network it will produces only one output at a time by giving an n input. The radial basis function network have three layers an input layer, a hidden layer and a linear output layer[5].The training samples features with assigned target vectors are fed into created PNN model for supervised training to get network parameters such as node biases and weighting factors. Finally, test image features are simulating with trained network to make decision of brain stages like normal or abnormality (benign and malignant).The network classifies input vector into a specific class because that class has the maximum probability to be correct. The PNN has three layers: the Input Layer, Radial Basis Layer and the Competitive layer. Radial Basis Layer evaluates vector distances between input vector and row weight vectors in weight matrix. These distances are scaled by Radial Basis Function nonlinearly[5]. Competitive Layer finds the shortest distance among them, and thus finds the training pattern closest to the input pattern based on their distance.
N Input sitesK hidden units M output units
. . .
. . .
. .
Site n+1 W(1)n+1,k 1 w(2)k+1,m
1
Connection matrix W1 Connection matrix W2
Fig. 2 Structure of the probabilistic neural network
C .Classification of cancer
In this proposed method there are five types of cancers are classified with the help of PNN Classifier. The five different types of cancer[6] which are classified are, Actinic Keratosis (AK), Basal Cell Carcinoma (BCC), Melanocytic Nevus / Mole (ML), Squamous Cell Carcinoma (SCC), Seborrhoeic Keratosis (SK)[5].
D. Segmentation
Themain aim of the segmentation in this project is to determine the stages of abnormality. Where the segmentation is the process of portioning an image into a set of non-overlapping regions whose union is original image. Thus the process of segmenting an image is equivalent to the process of grouping image samples with similar features into regions[3]. So that for segmentation an new method is introduced called fuzzy c-means algorithm(FCM), the FCM is also called as soft clustering. In this method it assigns each training vector a set of membership values, one for each cluster, rather than assigning each training vector to one and only one cluster. In fuzzy c-means clustering the classified image is converted to 256x256 pixels and providing a cluster value. The cluster value depends upon the objects present in classified image. Normally the clustering value is given as three, the classified image is clustered into three with zero matrix. The centroid is calculated for to find the distance matrix.
Centroid = Imax -I min (6)
No of clusters
Where,
Imax = maximum number of pixel values ( always Imax = 256)
Imin = minimum number of pixel values ( always Imin=0 )
The centroid is calculated for each clusters C0, C1, C2 separately with the help of the given formula
Where,
Cnis the centroid (n = 0, 1, 2)
From the found Cnthe distance matrix is calculated for each clusters D0, D1, D2 separately using the formula,
Dn= abs ( I (i, j ) – Cn) (8)
Where,
Dnis the distance matrix (n = 0, 1, 2)
I(i, j) distance between two centroids
After found the Dnvalue from that minimum Dnvalue is determined by,
Min (D0, D1, D2) (9)
Finally from the minimum value of Dnis taken and replacing it to the corresponding Cn value in a zero clustered matrix
(D0 = C0, D1 = C1, D2 = C2) and repeating this step for the three clusters provides an segmented image.
IV .RESULTS
The implementation of neural network to the test images and training images provide classification of the cancer, where uses the built in features extracted from an images is acts as an input. In the resultant image the region of cancer present is shown as an highlighted region with the help of segmentation and it provides the cancer type and the abnormality stage.
Fig 3. Melanocytic nevus type skin cancer
Fig 4.Seborrhoeic keratosis type skin cancer
A seborrheic keratosis is a noncancerous benign skin growth that originates in keratinocytes. It looks like liver spots, they are round or oval in shape. The highlighted region shows the presence of seborrhoeic keratosis
Fig 5. Squamous cell carcinoma type skin cancer
A squamous cell carcinoma occurs due to the uncontrolled multiplication of squamous cell it is kind of epithelial cell. It looks like an lining in the skin, the symptoms differ from the presenting body sites. The highlighted region shows the presence of squamous cell carcinoma.
V. CONCLUSION
REFERENCES
[1] Aldridge, R.B., Glodzik, D., Ballerini, L., Fisher, R.B., Rees, J.L.: The utility of non- rule-based visual matching as a strategy to allow novices to achieve skin lesion diagnosis. ActaDermato-Venereologica 91, 279{283 (2011)
[2] G. Argenziano, G. Fabbrocini, P. Carli, V. De Giorgi, E. Sammarco, and M. Delfino, ―Epiluminescence microscopy for the diagnosis of doubtful melanocytic skin lesions: Comparison of the ABCD rule of dermatoscopy and a new 7-point checklist based on pattern analysis,‖ Arch. Dermatol., vol. 134, no. 12, pp. 1563–1570, 1998.
[3] Haralick, R.M.—Shapiro, L.G.: Image Segmentation Techniques. Comput. Vision Graphics Image Process., Vol. 29, 1985, pp. 100–132 [4] H. Ganster, P. Pinz, R. Rohrer, E. Wildling, M. Binder, and H. Kittler, ―Automated melanoma recognition,‖ IEEE Trans. Med. Imag., vol. 20, no. 3, pp. 233–239, Mar. 2001.
[5] P. Mohanaiah and Dr. P. Sathyanarayana, ―Detection Of Tumour Using Grey Level Co-Occurrence Matrix And Lifting Based DWT With Radial Basis Function,‖ IJERT, Vol. 2, No. 6, pp. 1677-1684, 2013.
[6] R. P. Braun, H. S. Rabinovitz, M. Oliviero, A. W. Kopf, and J. H. Saurat, ―Dermoscopy of pigmented skin lesions,‖ J. Am. Acad. Dermatol., vol. 52, no. 1, pp. 109–121, 2005.