Division V
SEISMIC SOIL-STRUCTURE INTERACTION EFFECTS on DESIGN OF CURVED SLIDERS FOR BASE ISOLATION and RECENTERING CAPABILITY of RECTANGULAR
SHEARWALL STRUCTURES
Yalçın Bulut1, #, Felix Weber2, Ömer O. Erbay1, Luca Paroli3, Peter Huber3, Johan Distl4, Christian Braun5 and Dan Ghiocel6
1 Managing Partner, MATRiSeb Engineering & Consultancy, Ankara, Turkey 2 R&D Engineer, Maurer Switzerland GmbH, Zürich, Switzerland
3 Technical Sales Engineer, MAURER SE, Munich, Germany
4 Technical Director, Maurer Söhne Engineering GmbH & Co. KG, Munich, Germany 5 CEO, MAURER SE, Munich, Germany
6 President, Ghiocel Predictive Technologies, NY, USA # Corresponding Author, E-mail: [email protected]
ABSTRACT
Division IX
INTRODUCTION
The seismic base isolation technologies have been widely used in conventional structures and bridges. However only a few nuclear power plants are equipped with seismic base isolation systems. Application of seismic isolation systems was extended to nuclear power plant facilities in early 80s in Koeberg NPP in South Africa and Cruas NPP in France. The first new seismic isolation applications following Cruas and Koeberg NPPs are Jules Horowitz Research Reactor and International Thermonuclear Experimental Reactor, currently under construction in France [1]. Elastomeric bearings are used in these nuclear power plants. The limited number of existing seismically isolated nuclear plants is probably due to the fact that theoretical studies are still in progress and experimental results about the behaviour of large isolators under severe seismic conditions are insufficient. There are recent research efforts in order to develop a methodology to extend the base isolation technology to the NPP structures in Japan [2].
In this study, the seismic soil-structure-interaction (SSI) effects on design of curved surface sliders (CSS) for base isolation and re-centering capability of typical NPP structures are investigated. Typically, design of curved surface sliders follows a three-step process: First, the effective radius is selected to significantly increase the natural period of the isolated structure to values in the region of 3 s and higher whereby the structure is shifted out of the time period range of greatest excitation energy of most earthquakes. Second, the friction coefficient is selected to add maximum damping to the structure which further reduces the structural acceleration response. Finally, the design of the curved surface slider is double-checked for the re-centering condition given by the norm EN 15129. This three-step process and the required design parameters are commonly analysed without considering the effects of soil-structure-interaction. However, existence of non-vertically propagating and surface incident waves is a concern for the base isolated structures since the effect of the motion incoherency resulting from the spatial variation of the ground motion in the horizontal plane potentially introduces: (1) a global torsional excitation of the structure on isolators, and (2) an increased, local vertical forces on isolators due to small local differential ground motions especially coming from the vertical directions and due to rocking response of the structure.
This paper presents a parametric study to demonstrate how the incoherency of the seismic motion affects the forces acting on isolators and the calculated design parameters of the isolators. The paper is organized as follows: the next section presents the methodology used in the study and the following section provides information about the structure and CSS considered in the study. Seismic response calculation methods applied in the study are presented in the last two sections; namely simplified approach and soil-structure interaction analysis approach. A brief summary of the main outcomes of the study concludes the paper.
METHODOLOGY
TURBINE BUILDING
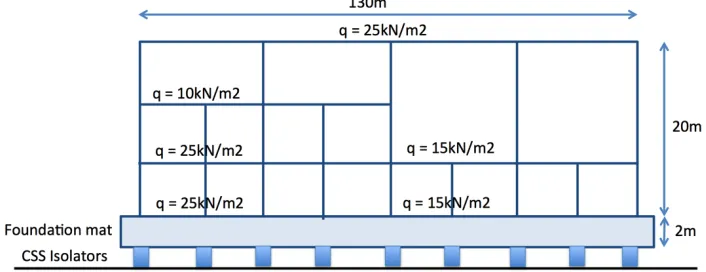
Section view of the Turbine Building considered for the study is depicted in Fig. 1. It is 20m high and 65mx130m in plan. Foundation mat is 2m thick and supported on 561 CSS. It has two floors and live load (q) considered for each floor is shown in Fig. 1. Outside wall thickness is 60cm and internal wall thickness is 30cm. 15cm roof slab is supported by 1m deep girder beams. Total weight (includes self weight and live load) of the upper structure is 756.6MN and weight of the foundation mat is 580.3MN.
Figure 1. Section view of the Turbine building (East-West)
Curved Surface Slider
The number of CSS used beneath foundation mat is calculated based on static vertical load analysis. Four CSS categories are defined in accordance with resultant vertical load acting on the isolators. The vertical load capacity of these four CSS categories are 4MN, 8MN, 12MN and 16MN. The layout of the isolation system under foundation mat sand the number of CSS in each category are demonstrated in Fig. 2.
Division IX
Dynamic Soil Properties
Low-strain soil layer properties beneath the foundation mat are presented in Table 1.
Table 1: Low strain soil properties
Depth (m) Vs (m/s) Vp (m/s) Poisson Ratio Unit Weight (kN/m3)
0.0 430 900 0.35 16.10
-5.5 500 1100 0.37 18.67
-8.5 650 1400 0.36 19.38
-17.0 700 1600 0.38 20.30
-20.5 773 1800 0.39 20.87
-62.0 773 1800 0.39 20.87
Seismic Hazard
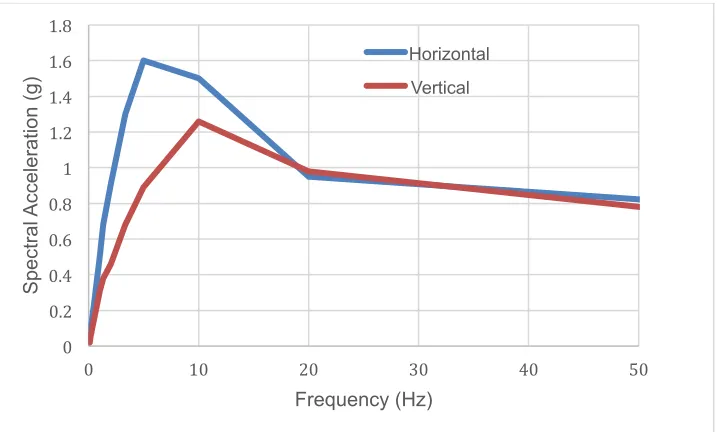
Mean ground response spectra obtained from probabilistic seismic hazard analysis is depicted in Fig. 3. The ground response spectra represent beyond design basis level earthquake which has 5000 years
recurrence interval with 1% annual exceedance probability in 50 years. Peak ground accelerations are
0.61g and 0.45g for horizontal and vertical directions, respectively.
Figure 3. Horizontal and vertical ground response spectra
As an input motion for dynamic time history analysis, five ground acceleration time histories are generated using spectra matching algorithms in ACS-SASSI Equake module [4]. Recorded seismic motions listed in Table 2 are used as seed motion and five acceleration time histories are obtained that matches with the ground spectra presented in Fig. 3.
0 0.2 0.4 0.6 0.8 1 1.2 1.4 1.6 1.8
0 10 20 30 40 50
Sp
ect
ra
l Acce
le
ra
tio
n
(g
)
Frequency (Hz)
Table 2: Seed motions that are used to generate spectra matching ground acceleration time history
Record
No Earthquake Name Year Station
Earthquake Magnitude
vs30 (m/s) 1 "Loma Prieta" 1989 "LGPC" 6.93 595 2 " Chi-Chi_Taiwan" 1999 " TCU071" 7.62 625 3 "Chuetsu-oki Japan" 2007 "Oguni Nagaoka" 6.80 562 4 "Iwate_Japan" 2008 "Kurihara City" 6.90 512 5 "Duzce_Turkey" 1999 "IRIGM 487" 7.14 690
SIMPLIFIED APPROACH
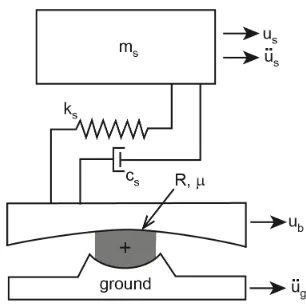
The turbine building has first lateral mode around 10 Hz and the CSS are designed with smaller lateral stiffness compared to the upper structure. Therefore, seismic response of the upper structure is expected to have a rigid behaviour and the dynamic model of the structure with mat foundation (including the mass of the upper bearing plate of the CSS) is simplified by a 2-degree-of-freedom system which is depicted in Fig. 4.
Figure 4. Simplified model: Two-degree-of-freedom system
In the Fig. 4 ms, ks and cs represents mass, horizontal stiffness and damping of the superstructure. The coupled equations of motion of the simplified model are given as follows
𝑚! 0
0 𝑚! 𝑢𝑢!! +
𝑐! −𝑐!
−𝑐! 𝑐! 𝑢!
𝑢! + −𝑘𝑘!! 𝑘!−𝑘+!𝑘! 𝑢!
𝑢! + 0
𝑓!"#$%#&' =− 𝑚0! 𝑚0!
𝑢!
𝑢! (1)
where the dots represent differentiation with respect to time, 𝑢! is the displacement of the structure
relative to ground, 𝑢! is the input ground acceleration, 𝑚! is the mass of the foundation mat including the mass of the upper bearing plate of the CSS and 𝑘! is the restoring stiffness of the CSS. The restoring stiffness 𝑘! of the CSS is determined by the effective radius 𝑅!"" of the CSS
𝑘! =!!"
!"" (2)
where Ws is vertical load on the CSS and 𝑅!"" is determined by the geometrical radius R of the sliding
surface and the radius of the calotte of the CSS (Fig. 4). 𝑅!"" is given by the targeted time period Tiso of
Division IX
𝑅!"" =𝑔(!!"# !!)
! (3)
where g denotes gravitational acceleration. In this study the undamped natural period of the isolated structure is chosen as 3.5 seconds. 𝑓!"#$%#&' represents the CSS nonlinear friction force
)
u
(
sign
W
f
friction=
µ
!
b (4)where
µ
denotes the friction coefficient. The Coulomb friction model of Eq. (4) is approximated by the tangens-hyperbolicus approach in order to avoid numerical problems of the sign-function. The nonlinear force-displacement curve of the CSS is depicted in Fig. 5 in which dbd is the seismic design displacement of the CSS.
Figure 5. Force-displacement curve of CSS due to kinematic excitation (schematic, left) and resulting from simulation togehter with structure and ground excitation (right)
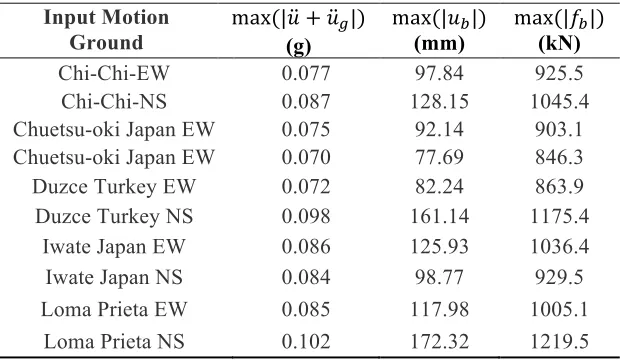
Using the spectra matching excitations based on the seed motions in Table 2, the seismic responses of the structure and the CSS are computed by nonlinear time history analysis (Eq. 1). The absolute maxima (peak) of the absolute structural acceleration max(|𝑢+𝑢!|), the peaks of the CSS horizontal displacement at basemat level max(|𝑢!|) and the peaks of the CSS horizontal force max(|𝑓!|) are given in Table 3.
Table 3: Simplified model seismic response results
Input Motion Ground
max(|𝑢+𝑢!|) (g)
max(|𝑢!|) (mm)
max(|𝑓!|)
(kN) Chi-Chi-EW 0.077 97.84 925.5 Chi-Chi-NS 0.087 128.15 1045.4 Chuetsu-oki Japan EW 0.075 92.14 903.1 Chuetsu-oki Japan EW 0.070 77.69 846.3 Duzce Turkey EW 0.072 82.24 863.9 Duzce Turkey NS 0.098 161.14 1175.4
Iwate Japan EW 0.086 125.93 1036.4 Iwate Japan NS 0.084 98.77 929.5 Loma Prieta EW 0.085 117.98 1005.1
3D SOIL STRUCTURE INTERACTION ANALYSIS
Three dimensional soil-structure interaction (SSI) analysis is performed in frequency domain using SASSI methodology [3] and ACS-SASSI software [4]. From soil and foundation interaction point of view SASSI methodology addresses the effects of wave propagation in unbounded soil media and strain-compatible soil properties and applies the input motion in the free field using deconvolution method. The basic methods of analysis adopted by the SASSI are called the flexible volume and subtraction methods. These methods are formulated in the frequency domain using the complex response method and the finite element technique. A detailed description of each method and associated equation of motion is presented in the theoretical manual of the ACS-SASSI [4]. For the purpose of the computations steps presented in this section, the basic equation for the flexible volume method is briefly presented. In the flexible volume method, the complete soil-structure system is partitioned into two substructures, namely, the foundation and the structure. In this partitioning, the structure consists of the superstructure plus the basement minus the excavated soil; i.e., the soil to be excavated is retained with the foundation. Interaction between the structure and the foundation occurs at all basement nodes. Using the concepts of sub-structuring, the equations of motion for the flexible volume method are developed by combining the equation of motion for the structure and the soil in the frequency domain, which leads to
𝐶𝐶!! ω 𝐶!" ω
!" ω (𝐶!! ω −𝐶!! ω +𝑋!! ω
𝑈! ω
𝑈!! ω =
0
𝑋!! ω 𝑈!! ω (5)
where the subscripts s, i, and f refer to degrees of freedom associated with the nodes on superstructure, basement, and excavated soil, respectively. 𝐶 is the complex frequency- dependent stiffness matrix
𝐶 ω =[𝐾]− ω![𝑀] (6)
where M and K are the total mass and complex stiffness matrices, respectively, and ω is the frequency of vibration; 𝑈 is the vector of complex nodal point displacements; 𝑋!! is frequency-dependent impedance function, which represents the dynamic stiffness of the foundation at the interaction nodes. According to the complex frequency domain formulation, the solution of the linearized SSI problem reduces to three main computational steps. For each frequency; (1) Solve the site response problem to determine the free field motion 𝑈!! within the embedded part of the structure. (2) Solve the impedance problem to determine the free-field impedance matrix 𝑋!!. (3) Solve the SSI problem by forming the entire SSI system complex
stiffness and load vectors and solving the Eq. 5 for the final SSI response displacements.
In the site response analysis step of the SSI problem two type of soil motions can be considered, namely; (1) Coherent motion. (2) Incoherent motion. For the coherent motion case, only vertically propagating S and P waves (1D) are considered and no other waves types included. Moreover, heterogeneity, random orientation and arrivals of the waves are ignored. Only response in a rigid body soil motion is calculated. For coherent motion, the equation of motion in frequency domain presented in Eq. 5 can be simplified in the following
𝑈 ω =𝐻! ω 𝐻!! ω 𝑈
! ω (7)
where 𝐻! ω is the structural transfer function given input at interaction nodes, 𝐻!!(ω) is the coherent
soil transfer function at interface nodes given input motion,𝑈! ω is the complex Fourier transform of
Division IX
Incoherent Motion
The incoherent motion represents real field records information, including implicitly motion field heterogeneity, random arrivals of different wave types under random incident angles. In this study, the seismic incoherent SSI analysis methodologies described in the US Electric Power Research Institute (EPRI) studies [3] that were implemented in the ACS SASSI code are used. These methodologies are based on the spectral factorization model proposed by EPRI [6]. Using the same notation used by EPRI [6], for the incoherent motion case, the equation of motion in frequency domain presented in Eq. 5 can be simplified in the following
𝑈 ω =𝐻! ω 𝑆! ω 𝐻!!(ω)𝑈! ω (8)
where 𝑆! ω is a stochastic wave field that represents complex Fourier transform of relative spatial variations of soil motion at interaction nodes that is calculated by
𝑆!! ω = 𝚽(𝛚) 𝛌(𝛚){𝛈𝛉} (9) which has two parts, namely deterministic and stochastic. The deterministic part represented by coherency kernel, namely 𝚽 and 𝛌. The stochastic part is represented by random phases, namely 𝛈𝛉. For
further information about the incoherence analysis for SSI effects refer to [7, 8].
SASSI Model
Three-dimensional finite element of the Turbine Building is developed using the ACS-SASSI software., Isometric view of the finite element of model is depicted in Fig. 6. The foundation mat is considered at the ground level (no embedment) and modelled with 2D shell elements. First horizontal mode of the fixed based model is observed in 10Hz in both directions and the CSS are modelled as non-linear spring elements at the interface of soil and foundation mat nodes. The SSI analysis performed for both coherent and incoherent motion cases. For the coherent motion case the analyses are performed using five input ground motion data described in the Seismic Hazard section. For the incoherency motion Abrahamson model [5] that is developed for soil sites and surface foundations is used. Secondary wave passage effects of the incoherent motion are ignored. The input ground (control) motion is applied at -62m depth. The stochastic incoherence motion analysis is performed for only Chi-Chi Taiwan input ground motion and for 30 random phase angles.
a) b)
High Strain Soil Properties
The low-strain soil properties are given in Table 1. Based on the seismic hazard level taken into consideration dynamic properties of the soil are expected to reach high strain level. In order to provide wave passing cut-off frequency at 50Hz, soil sub-layering is considered and 30 sub-layers are defined. High strain properties are calculated using ACS-SASSI Soil Module for 5 ground motions given in the Seismic Hazard section. Mean value of these five analysis results are used as the high strain soil properties in the SASSI model, which are presented in Fig. 7.
Figure 7. High-strain soil properties
SASSI Analysis Results
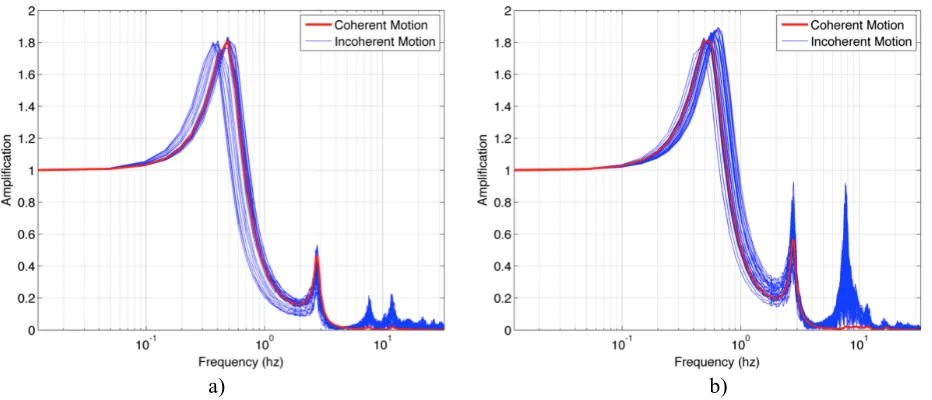
Transfer functions of the centre node of the basemat slab for coherent and incoherent motion cases are presented in Fig. 8.
a) b)
Division IX
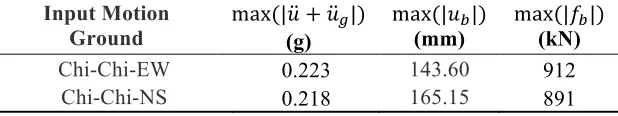
Maximum seismic displacement and acceleration response at the basemat level obtained from SASSI coherent and incoherent motion analysis are listed in Table 4 and Table 5 respectively. Incoherent motion case results are presented as mean of the response calculated for 30 random phase angles.
Table 4: Coherent motion SASSI analysis results
Table 5: Incoherent motion SASSI analysis results
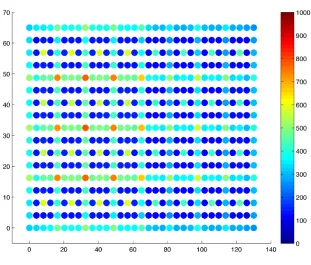
CSS maximum horizontal forces obtained from coherent and incoherent motion SASSI analysis are presented in Fig. 9 and Fig. 10 respectively.
Input Motion
Ground max(|𝑢(g) +𝑢!|) max(|𝑢 (mm) !|)
max(|𝑓!|) (kN) Chi-Chi-EW 0.163 81.60 590.8 Chi-Chi-NS 0.158 60.30 543.5 Chuetsu-oki Japan EW 0.101 96.50 624.2 Chuetsu-oki Japan EW 0.086 103.70 612.2 Duzce Turkey EW 0.093 92.30 615.5 Duzce Turkey NS 0.092 153.10 738.6 Iwate Japan EW 0.113 106.00 648.7 Iwate Japan NS 0.092 111.80 614.3 Loma Prieta EW 0.108 135.70 711.3 Loma Prieta NS 0.103 171.20 787.4
Input Motion
Ground max(|(g) 𝑢+𝑢!|) max((mm) |𝑢!|)
max(|𝑓!|) (kN) Chi-Chi-EW 0.223 143.60 912
Figure 8. CSS maximum horizontal forces for coherent motion case (units in kN)
Division IX
CONCLUSIONS
This paper presents a parametric study to demonstrate how the incoherency of the seismic motion affects the forces acting on the isolators and the calculated design parameters of the isolators. In the study a 3D soil-structure-interaction model of a typical nuclear shear-wall structure is developed in the ACS SASSI software that uses an efficient hybrid time/frequency domain approach for nonlinear analysis. The CSS isolators are idealized by nonlinear hysteretic springs distributed uniformly on the mat foundation. The nonlinear response of the CSS is modelled using an iterative equivalent-linearization algorithm. The properties of the springs are iteratively changed to determine the equivalent stiffness and damping level in the CSS. The case study analysis results show that incoherent ground motion increases horizontal displacement and horizontal forces of the CSS compared to coherent motion. It’s also demonstrated that the simplified approach where the structure with CSS modelled as 2-degree-of-freedom system without SSI effects provides an initial estimate for the seismic response of the isolated structure. However it’s prudent to perform a final analysis considering SSI effects since the simplified approach can underestimate the displacement demand on the isolators. It is concluded that careful SSI modelling of base isolated structure, which takes into consideration incoherency effects in spatial variation of the ground motion and consequently non-vertically propagating waves, is necessary.
REFERENCES
[1] Forni, M., Poggianti, A. and Dusi, A., (2012). Seismic Isolation of Nuclear Power Plants, Proc. of the 15WCEE, Lisbon, 24-28 September.
[2 ]Kubo, T., Yamamoto, T., Sato, K., Jimbo, M., Imaoka, T., Umeki, Y. (2014), “A Seismic Design of Nuclear Reactor Building Structures Applying Seismic Isolation System In a High Seismicity Region – A
Feasiblity Case Study in Japan” Nuclear Engineering and Technology, Volume 46, Issue 5, Pages 581-594, October 2014
[3] Lysmer, J., M. Tabatabaie, F. Tajirian, S. Vahdani and F. Ostadan (1981), “SASSI – A System for Analysis of Soil-Structure Interaction,” Report No. UCB/GT/81-02, Geotechnical Engineering, Department of Civil Engineering, University of California, Berkeley.
[4] Ghiocel Predictive Technologies, Inc. (2015). “ACS SASSI - An Advanced Computational Software for 3D Dynamic Analyses Including SSI Effects”, ACS SASSI Version 3.0 Manuals, March 31.
[5] Short, S.A., G.S. Hardy, K.L. Merz, and J.J. Johnson (2007). “Validation of CLASSI and SASSI to Treat Seismic Wave Incoherence in SSI Analysis of Nuclear Power Plant Structures”, Electric Power Research Institute, Palo Alto, CA and US Department of Energy, Germantown, MD, Report No. TR-1015111, November 30.
[6] Tseng and Lilhanand (1997). ”Soil-Structure Interaction Analysis Incorporating Spatial Incoherence of Ground Motions”, Electric Power Research Institute, Palo Alto, CA and US Department of Energy, Germantown, MD, Report No. TR-102631, November.
[7] Abrahamson, N. (2007). “Hard Rock Coherency Functions Based on the Pinyon Flat Data”, Electric Power Research Institute, Palo Alto, CA, and US Department of Energy, Germantown, MD, Report 1015110, December.