INVESTIGATION OF THE EFFECT OF
RLC LOAD ON POWER FACTOR OF
MICROCONTROLLER BASED POWER
SYSTEM
Abhinav Sharma
1, Jyoti Lalotra
2, Saleem khan
3, Parveen Lehana
4 M.tech Student, Dept. of EEE, Arni University, Kathgarh, H.P, India1M.tech Student, Dept. of EEE, Arni University, Kathgarh, H.P, India2
PhD Scholar, Dept. of Physics and Electronics, University of Jammu, J&K, India3
Associate Professor, Dept. of Physics and Electronics, University of Jammu, J&K, India4
Abstract: The research work is carried out to study and analyze the effect of impedance with varying inductance on the power factor of designed system. Eight different combination of load are taken inductance ranging from approximate value of 1232.0mH to 269.1mH keeping resistance 124 Ω and capacitance 15µF. Load voltage and current waveforms were recorded for all combinations by using Gold wave software having duration of 1s with sampling rate of 16,000. From the investigations it is observed that the amplitude of the current in the load is inversely proportional to the inductance and also the power factor is inversely proportional to it.
Keywords: Power factor, impedance, active power, load effect, power system.
I. INTRODUCTION
Power factor may be defined as the ratio of „real or active power‟ used in the circuit measured in watts or kilowatt to the „total or apparent power‟ measured in volt-amperes or kilo volt-amperes. There is generally a phase difference between voltage and current waveformis called the power factor [1-3]. Power factors above 95% are considered good and power factor below 90% are considered poor [4]. It is a measure of how effectively the current is being converted into useful work output and a good indicator of the effect of the load current on the efficiency of the supply system [5]. Low power factor increases the apparent current from the source; the amount of useful power that can be drawn from the circuit is lowered due to thermal limitation. Low PF also increases not only the apparent line current but also the additional current capacity cost money [6]. Below are other disadvantages of low power factor [6-8]:
KVA rating of the electrical equipments increases due to low power factor as power factor is inversely proportional to the KVA rating of the equipment. This increases the size and cost of the equipment.
Conductor size increases due to transmit the same amount of power at low power factor at constant voltage needs to carry high current. So to keep the current density constant conductor area increases.
II. CONDITIONS OF POWER FACTOR
There are the different conditions of the power factor in different circuits [9-11].
A. Unity power factor
A circuit with a unit power factor will have equal actual and apparent power, so that the current remains in phase with the voltage and hence some useful work done. The vector diagram of unity power factor is shown in Fig.1 (a).
B. Leading power factor
A circuit will have leading power factor if the current leads voltage by an angle of
electrical and the true power will be less than apparent power. The vector diagram of leading power factor is shown in Fig.1 (b).V
I
I
V
I
V
I
V
(a) (b) (c) (d)
Fig. 1(a-d) Different condition of power factor [9].
C. Lagging power factor
A circuit the true power is also less than the apparent power and the current lag behind the voltage by an angle of
electrical. The vector diagram of lagging power factor is shown in Fig.1(c).D. Zero power factor
When there is a phase difference of 900 between the current and voltage, the circuit will have zero power factor and no useful work can be done. The vector diagram of zero power factor as shown in Fig.1 (d).
III.METHODOLOGY
Series combination of load RLC
Load voltage level shifting
C.T
Sound card Vin
Signal system & processing unit Microcontroller
based Power stabilization With Voltage & Current
sensing circuit
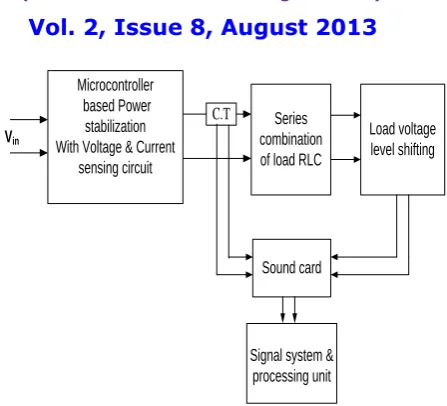
Fig. 2 Block diagram of the system.
Load current and voltage for different combinations is measured using current transformer (CT) and load voltage level shifting block. Further these signals are stored and processed in PC through sound card. Since the value of output load voltage is in tens of volts, thus cannot be directly applied to the sound card, a circuit is developed to bring down the amplitude of the out voltage from volts to milli volt. These signals are recorded in the PC using Gold wave software. The sampling rate and duration of measurement are kept at value of 16000 and 1s respectively. If the inductor are varying then loads obtained the output pulses of pure sinusoidal sine wave are display in computer through sound card and calculate the load phase angle, L between the fundamental components of the load voltage and current (V and IL respectively.)
TABLE I DIFFERENT COMBINATIONS OF LOAD RLC
S. No. Resistor
(Ω)
Inductor (mH)
Capacitor (µf)
1 124 1232.0 15
2 124 1073.0 15
3 124 873.0 15
4 124 729.0 15
5 124 590.6 15
6 124 470.2 15
7 124 363.0 15
8 124 269.1 15
IV.RESULT AND DISCUSSION
TABLE II CALCULATION OF POWER FACTOR
S. No. Impedance
Z(Ω)
P.F. Theoretical
P.F. Practical
Error
1 214.3 0.579 0.469 1.234
2 176.0 0.705 0.587 1.201
3 138.7 0.894 0.656 1.362
4 125.2 0.991 0.829 1.195
5 126.8 0.977 0.997 0.979
6 139.8 0.886 0.965 0.918
7 158.2 0.783 0.933 0.839
8 178.0 0.696 0.809 0.860
Load voltage and current through it are segmented for 0.25s for eight combinations of impedance are shown in Fig. 3(a) to Fig. 3(h). From these plots it can be analysed that inductance shows a prominent effect on the amplitude of the current but as far as voltage is concerned its amplitude remains constant for all the combinations of the load. Current amplitude is inversely proportional to the magnitude of the inductor. Theoretical values of the power factor were calculated using following formula given below with all the values of the inductor, capacitor and resistor taken in the experiment [16]:
1
tan XL XC
R
P.F= cos
The practical values of the power factor were obtained from the output waveforms of current and voltage. Both theoretical and practical calculated values of power factor are shown in Table 2. Also the error calculated by dividing theoretical and practical calculated values is shown. The calculated theoretical and practical values are plotted in Fig. 4 with different impedance values. As the values of the impedance is decreased i.e. variation in the value of inductance from Henry (H) to mH, the power factor value rises giving minimum and maximum values of 0.469 and 0.997 respectively. As the values of the impedance is increased, the power factor value falling maximum and minimum values of 0.997 and 0.809 respectively. There is also some difference in theoretical and practical calculated values are seen in the plot for certain combinations which may arise due to leakage of the inductive or capacitive components.
(c). Z=138.7,
= 26.6 (d). Z=125.2,
=7.8
(e). Z=126.8,
=-
12.1 (f). Z=139.8,
=-
27.5
(g). Z=158.2,
=-
38.4 (h). Z=178.0,
=-
45.8Fig. 4 Theoretical and practical calculated value of power factor for different combinations of impedance (Z).
V. CONCLUSION
The research work is carried out to study the effect of the variation in the load on power factor. Eight different combinations of the load are taken with different values of inductance keeping resistance and capacitance constant. Load voltage and current are recorded for all combinations in the PC using Gold wave software. The sampling rate and duration of measurement are kept at value of 16000 and 1s respectively. From the analysis it is observed that the current through the load is inversely proportional to the values of inductance and similar is the case for power factor. The Practical values for power factor are rises from minimum and maximum value of 0.469 and 0.997 respectively.
REFERENCES
[1] Ramasamy Natarajan, “Power system Capacitors”, CRC Press, Taylor & Francis Group, LLC, 2005.
[2] S. Rao, “EHV-AC, HVDC Transmission & Distribution Engineering”, Khanna Publishers, 2011, pp. 1157-1205. [3] Marty Brown, “Power Sources and Supplies: World Class Designs”, Linacre House, Jordan Hill, Elsevier Inc., 2008.
[4] Steven W. Blume, “Electric Power System Basics for the Nonelectrical Professional”, John Wiley & sons, Inc., Hoboken, New Jersey, 2007. [5] V. k. Jain and Amitabh Bajaj, “A Textbook of Design of Electrical Installations”, Laxmi publications ltd., pp.308-316, 2004.
[6] F. Cupertino, M. Marinellim, P. Zanchetta and M. Sumner, “Modelling and design of shunt active power filter using genetic algorithm,” Power Electronics and Applications, Dresden, pp. 5-9, 2005.
[7] V.K. Mehta and Rohit Mehta, “Principle of Electrical Machines”, S. Chand and company ltd., pp. 313-377, 2005.
[8] John Frederic Whitfield, “Electrical Craft Principles”, 4th edition, Published by The Institution of Electrical Engineers, London, United Kingdom, vol. 2, 2001.
[9] P.S. Dhogal, “Basic Electrical Engineering”,vol. 1, Tata McGraw-Hill Publishing Company Limited, 2006. [10] P.P. Deo, “Power System Analysis”, 1st edition Technical publication, Pune, January 2007.
[11] Jerry C. Whitaker, “AC Power Systems Handbook”, 3rd Edition, CRC press, Taylor & Francis Group, 2007.
[12] Cathleen Shamieh and Gordon Mc Comb, “Electronics for Dummies”, 2nd edition, Wiley publishing, Inc., pp.91-105, 2009. [13] U.A. Bakshi and A. V. Bakshi, “Electric Circuit Analysis”,1st edition, Technical publications pune, chapter 3, pp.1-74, 2008. [14] V.U. Bakshi and U.A. Bakshi, “Basic Electrical Engineering”, 2nd revised edition, Technical Publications, Pune, 2007. [15] Stephen L. Herman, “Delmar's Standard Textbook of Electricity”, 5th edition, Cengage Learning, 2010.
[16] Dr. Arthur Kramer and Arthur D. Kramer, “Mathematics for Electricity and Electronics”, 4th edition, Cengage Learning, 2011.
BIOGRAPHY
Er. Jyoti Lalotra received her Bachelor degree in Electrical Engineering from M.B.S.C.E.T, affiliated to University of Jammu (J&K) and also received the Master of Business Administration from Lovely Professional University Jalandhar (Punjab). She received her Advance Diploma in industrial Automation & System Design from C-DAC, Mohali, Punjab and also received Advance Certificate in Power Distribution Management from Indira Gandhi National Open University, New Delhi, India. She is currently pursuing the M.Tech. in EEE from Arni University, kathgarh, Himachal Pradesh, India.
Saleem khan received his M. Phil degree from University of Jammu. He is currently doing the PhD degree in physics and electronics department from University of Jammu.
Dr. P.K Lehana (Associate Professor) received his Master‟s degree in Electronics from Kurushetra University in 1992.
![Fig. 1(a-d) Different condition of power factor [9].](https://thumb-us.123doks.com/thumbv2/123dok_us/1704596.1216361/2.595.68.534.309.421/fig-d-different-condition-power-factor.webp)