ABSTRACT
LOSSING, JENNIFER AIMEE. Quantification of Chondrocyte Death and Proteoglycan Content in Mechanically Impacted Articular Cartilage. (Under the direction of Peter L. Mente)
QUANTIFICATION OF CHONDROCYTE DEATH AND PROTEOGLYCAN CONTENT IN
MECHANICALLY IMPACTED ARTICULAR CARTILAGE
By
JENNIFER AIMEE LOSSING A thesis submitted to the Graduate Faculty of
North Carolina State University in partial fulfillment of the requirements for the Degree of
Master of Science
BIOLOGICAL AND AGRICULTURAL ENGINEERING
Raleigh 2004
APPROVED BY:
___________________________ ___________________________ C. FRANK ABRAMS, Jr. SIMON C. ROE
Committee Member Committee Member
Biography
Jennifer A. Lossing was born on July 25, 1977 in Mississauga, Ontario, Canada. She
moved to North Carolina in 1997 and attended The University of North Carolina at
Charlotte where she received a Bachelor of Science degree in Biology, with a minor in
Anthropology in 2000. A year later, she was accepted into the Graduate School at North
Carolina State University where she earned a Master of Science degree in Biological
Engineering with a graduate minor in Industrial Engineering in 2004. She is currently a
Acknowledgements
Many thanks to the Tissue Mechanics Lab staff in the Department of Biomedical
Engineering for their collaboration and assistance in all experimental procedures. Thank
you also to Dr. Peter Mente for his advice and support throughout my academic
endeavors. This research was funded by a Whitaker Foundation Biomedical Engineering
TABLE OF CONTENTS Page LIST OF TABLES………vi LIST OF FIGURES……….vii 1. Introduction………..1
2. Cartilage ……….………...2
3. Articular Cartilage………...2
3.1 Joint Tissue Structure and Composition………3
3.2 Matrix Components………...4
3.3 Proteoglycans………...5
3.4 Type II Collagen………7
3.5 Chondrocytes………...9
4. Osteoarthritis………..11
4.1 Proteoglycan Content and Osteoarthritis………..12
4.2 Chondrocyte Death and Osteoarthritis……….12
4.3 Apoptosis and Necrosis………...13
5. Models of Cartilage Degeneration………...15
5.1 Techniques for Experimental Loading of Cartilage……….15
5.2 In vitro Impact Models of Articular Cartilage: Literature Review………...16
6. Purpose of Study………22
6.1 Hypotheses………23
7. Methods………..24
7.1 Randomization of Specimens………...24
7.2 Porcine Patella Removal………...26
7.3 In vitro Impactions………28
7.4 Organ Culture………...32
7.5 Tissue Analysis………...33
7.6 Data Collection………...35
7.7 Measurement of Safranin-O Staining Intensity: Proteoglycan Content…………...39
7.8 Quantification of Chondrocyte Viability………..40
7.9 Statistical Analysis………...41
8. Results………42
8.1 Chondrocyte Viability………..42
8.2 Proteoglycan Content………...47
9. Discussion………..52
10.Recommendation for Future Research………...59
10.1 Stain for General Cell Death, Apoptotic Cell Death and Cell Proliferation…...59
10.2 Damaged Type II Collagen Analysis………59
10.3 Assessment of Tissue Fibrillation and Subchondral Bone Damage…………...60
10.4 Effect of Axial Load on Chondrocyte Shape and Volume………...60
APPENDICES
A. Porcine Patella Removal………...68
B. In vitro Articular Cartilage Impaction………...69
C. Patella Incubation: In vitro Organ Culture………70
D. Histology………...71
D.1 Cell Viability Stain………....71
D.2 Tissue Freezing……….73
E. Cell Viability Data……….75
LIST OF TABLES
Table 1. Randomization of Specimens……….25
Table 2. Impaction Groupings………..25
Table 3. Schedule of Experiment Dates and Associated Specimens………26
Table 4. Distances From Impaction Center………..36
Table 5. Data: Percentage of Dead Cells by Tissue Depth………..75
Table 6. Data: Percentage of Dead Cells by Radial Position………...78
Table 7. Data: Normalized Intensity by Tissue Depth……….81
LIST OF FIGURES
Figure 1. The Knee Joint……….2
Figure 2. A Porcine Patella……….3
Figure 3. The Zones of Articular Cartilage……….4
Figure 4. A Proteoglycan Molecule………6
Figure 5. Synthesis, Secretion and Assembly of a Collagen Fiber……….8
Figure 6. An Articular Cartilage Chondron………..10
Figure 7. Osteoarthritic Cartilage……….11
Figure 8. Articular Cartilage Chondrocytes………..14
Figure 9. Patella in PMMA Mold……….28
Figure 10. Piezoelectric Load Cell………29
Figure 11. The MTS Mini Bionix Hydraulic Load Frame……….30
Figure 12. Location of Tissue Dye Marks……….31
Figure 13. Impaction Apparatus………31
Figure 14. Patella in Impaction Apparatus………32
Figure 15. Patella Incubation……….33
Figure 16. Tissue Preparation and Freezing………..35
Figure 17. Impact Geometry………..37
Figure 18. A Collective Montage (MTT stained)………..38
Figure 19. Tissue Column (10 regions)……….39
Figure 20. A Collective Montage (Safranin-O stained)……….40
Figure 22. Percentage of Dead Cells by Tissue Depth………..45
Figure 23. Percentage of Dead Cells by Radial Position………...46
Figure 24. Mean Normalized Intensity by Tissue Depth………...48
Figure 25. Normalized Intensity by Tissue Depth……….50
Figure 26. Normalized Intensity by Radial Position………..51
Figure 27. Live and Dead Chondrocytes………...56
Figure 28. Cell Clusters……….57
1 Introduction
The overall goal of this research was to examine the response of articular cartilage following a mechanical impact injury, as a model for the development of osteoarthritis. An in-vitro model of cartilage degeneration was developed to examine the timing of early degenerative changes; and to correlate applied mechanical stress with the biochemical pathways that lead to matrix degradation. The focus of this part of the study was to determine the timing of chondrocyte death and proteoglycan loss over the first two weeks following an impact injury.
Osteoarthritis is a severely debilitating disease that affects the cartilage layer and bone of joints, causing them to degrade over time. It is a slowly progressing and chronic disease whose exact process is unknown. During normal everyday activities, mechanical loads are transmitted between articular cartilage surfaces, such as the patella-femoral joint. However excessive mechanical loading of diarthrodial joints, as occurs with injury or trauma, may often be an initiating factor for cartilage degeneration and can lead to severe conditions such as osteoarthritis.14,17,18,31,44,56,59 Although it is thought that age, sex, racial characteristics and genetics establish the foundation for cartilage properties, many other biomechanical factors can influence the degradation of articular cartilage. These biomechanical factors include occupation, obesity, overuse, degree of joint loading and injury.4
in response to a stimulus known to be a predisposing factor for such diseases, traumatic injury.
2 Cartilage
There are three types of cartilage: fibrocartilage, which is the transitional cartilage found at margins of some joint cavities and insertions of ligaments and tendons to bone (i.e. menisci and annulus fibrosis), elastic cartilage (found in the external ear, epiglottis and larynx) and articular cartilage.40 Articular cartilage (Figure 1) is the type of cartilage found in joints that lines the ends of bones and completes the rib cage.7
Figure 1. The Knee Joint (and associated articular cartilage).38
3 Articular Cartilage
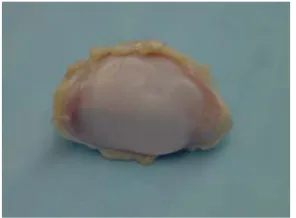
shown in Figure 2, articular cartilage in its young, normal and healthy state it appears glassy, smooth, glistening and bluish white to the naked eye. 40,46
Figure 2. A Porcine Patella (showing a healthy articular cartilage surface).
Unlike bone, cartilage has very little capacity for regeneration in adults. Adult human articular cartilage is avascular, therefore there is no external cell supply to compensate for cell loss caused by apoptosis, necrosis or other cellular mechanisms.1 The little healing that
does take place is due to the ability of the surviving chondrocytes to secrete more extracellular matrix.7
3.1 Joint Tissue Structure and Composition
Each zone in the cartilage is distinguished by the shape of the chondrocytes, the content of proteoglycans and the arrangement of the type II collagen fibers (Figure 3), which will be covered in the subsequent sections.
Figure 3. The Zones of Articular Cartilage (and the distribution of type II collagen fibers).40
The shape and composition of these cartilage components depend on the type of load that the tissue experiences. The intrinsic mechanical properties of articular cartilage vary with depth. For example, the superficial zone of articular cartilage is softer and less permeable than the regions below,52 in adaptation to the shear stress from motion.
3.2 Matrix Components
II collagen accounts for approximately 75% dry tissue weight and proteoglycans are approximately 20%-25% of the dry tissue weight.32 Both proteoglycan and collagen together make up about 25% of the wet weight of cartilage, with water accounting for the remainder.48 In general the interaction of water, proteoglycans, collagen and chondrocytes within the matrix depend on the type of cartilage (i.e. articular or fibrous) and the loads and deformations that the tissue experiences.46
3.3 Proteoglycans
Cartilage PG’s are inhomogeneously distributed throughout the matrix, with their concentration generally being lowest in the superficial and deep zones and highest in the middle zone.40 The distribution of this macromolecule reflects the ability of articular cartilage to resist compression.
The basic structural unit of the proteoglycan macromolecule is aggrecan. In the matrix the predominant monomer, aggrecan, noncovalently binds to hyaluronan and a link protein stabilizes this interaction between the binding region to form the PG macromolecule (Figure 4).40 Aggrecan consists of a central protein core with many covalently attached, negatively charged glycosaminoglycans (GAGS), for example, SO3- and COO-. GAGS are
Figure 4. A Proteoglycan Molecule10
The negative electrical charges of chondroitin and keratin sulphates cause them to repel each other. The highly sulphated GAG content of proteoglycan attracts water molecules and hence allows the tissue to swell and resist compressive forces. This is known as the Donnan osmotic swelling pressure.40
depends on the cartilage permeability, which is primarily influenced by the PGs.4 However if loads are applied so quickly that there is insufficient opportunity for fluid redistribution to the compressed region, the high stresses produced in the collagen-PG matrix may induce damage.40 An example of this is an injury that occurs due to an impact load.
3.4 Type II Collagen
A variety of different collagen (types V, VI, IX, XI) can be found in quantitatively small amounts in articular cartilage, however type II collagen is the most abundant.40 The collagen are tough fibers which are laid down in a crisscross pattern to create a framework that contains the proteoglycans. In the superficial tangential zone, the collagen fibers are oriented parallel to the articular surface. For example, if the surface of articular cartilage is pierced by a pin, and then withdrawn, a longitudinal “split line” appears. The pattern of split-lines shows the predominant direction of the collagen fibers in the cartilage.20 Collagen fibers in the middle zone are less densely packed and more randomly oriented (as opposed to the same direction). In the deep zone, the fibers are perpendicular to the articular surface, crossing the tidemark (or boundary between the calcified and noncalcified tissue) and anchoring the tissue to the bone (Figure 3).46
Figure 5. Synthesis, Secretion and Assembly of a Collagen Fiber 49
The most important mechanical properties of collagen fibers are providing tensile and shear strength to the cartilage.4,40 Collagen offers little resistance to compression. Because of their large ratio of length to thickness, collagen fibers can easily buckle under compressive loads.40 Since articular cartilage is anisotropic, meaning that its material properties differ with the direction of load, it is thought that the variations in collagen-proteoglycan interactions help create the cartilage tensile anisotropy.40 For example, osmotic pressure exerted by SO3- and COO- charge groups along the GAGs permits the PG in the collagen
3.5 Chondrocytes
The articular cartilage extracellular matrix is synthesized by the resident cells, the chondrocytes. These cells are responsible for synthesizing and maintaining the proteoglycan and collagen of the solid matrix.26 They can also produce several mediators that have the potential to induce chondrocyte death through apoptotic or necrotic pathways. Among these mediators are cytokines (e.g. IL-1), tumor necrosis factor (TNF), oxygen radicals, enzymes and nitric oxide.23.24 Although the important roles of a chondrocyte include the synthesis and maintenance of the matrix, the turnover rate is very slow.
In normal cartilage, chondrocytes are sparsely distributed throughout the extracellular matrix.53 In the superficial tangential zone, chondrocytes are oblong in shape with their long axes parallel to the articular surface. In the middle zone they are round in shape and randomly distributed and in the deep zone, they are arranged in a vertical columnar fashion.40
Figure 6. An Articular Cartilage Chondron
Little is known about the exact functional significance of the chondron. However, since the pericellular matrix completely surrounds the chondrocyte, it is possible that biochemical or biophysical signals that the chondrocyte receives are influenced by this region. One approach in determining the role of these signals is to assess the mechanical environment of the chondrocyte under physiological loading.21 For example, a study by Clark et al., using feline cartilage attached to its subchondral bone, applied a uniform static loads of 9 and 15 MPa (corresponding to a peak patellofemoral contact force of 170 N which occurs during normal gait).11 They discovered significant changes to chondrocyte shape and volume. Other studies have observed reductions in nucleus volume and height, a reduction in aggrecan synthesis and an enlarged chondron area in osteoarthritic cartilage, thus demonstrating that chondrocytes respond to changes in their physical environment within the ECM as injury progresses. This is an important factor in the survival and function of the cells and ultimately their associated cartilage and joint.11,21
pericellular matrix
lacuna
4 Osteoarthritis
Osteoarthritis (OA), a degenerative joint disease, occurs when there is disruption of normal cartilage structure and homeostasis (Figure 7). It is the leading cause of arthritis in the United States and affects an estimated 21 million Americans.3 Unlike rheumatoid arthritis, which usually affects the respective joint symmetrically (i.e. both knees, both hands etc.), OA often occurs in one joint with different pathology in its symmetrical equivalent. It is characterized by the degradation of cartilage protecting the ends of articulating bone joints, erosive cartilage lesions and subchondral bone sclerosis and cysts.12,26,46
Figure 7. Osteoarthritic Cartilage (at the distal end of the femur), indicated by the circle.
secondary or post-traumatic OA, degenerative changes may involve the entire articular cartilage. Matrix changes are detectable within days or weeks following joint injury such as damage to the meniscus or surrounding ligaments.43 In both cases, the central feature is loss of articular cartilage, a reduced capacity for repair, joint dysfunction,23,48 and damage to the surrounding bone tissue.43 Changes associated with OA ultimately have an impact on the patient through a decreased ability to use the joint and/or the production of pain due to increased articular surface friction during motion, causing increase heat production and tissue inflammation.26
4.1 Proteoglycan Content and Osteoarthritis
Decreases in PG concentration, collagen network disorganization, and softening of the tissue are the early signs of cartilage injury and OA. Proteoglycan depletion is probably not sufficient to initiate cartilage destruction, thus injury of the collagen network in the cartilage surface is necessary.4 Prior studies have noted that injury and excessive impact loading can produce structural damage and osteoarthritic-like changes including tissue swelling, increased collagen denaturation and reduced proteoglycan synthesis in cartilage explants.9,29 Since swelling is a result of electrostatic repulsion of charged proteoglycans, and opposed by the collagen network, swelling of the tissue after injury is thought to indicate damage to the collagen network.29 Therefore proteoglycan loss and perturbation of the collagen network provide an ideal environment for the disturbance of chondrocyte anchorage to the extracellular matrix, interfering with proper cellular growth, function and survival.1
4.2 Chondrocyte Death and Osteoarthritis
process of destruction and failure of the extracellular matrix which serves as the functional component of connective tissues. Since chondrocytes are the only source of matrix component (i.e. collagen and proteoglycans) synthesis, it has been suggested that the failure of the cartilage matrix can implicate a failure of the involved cells.1,14 On the other hand, studies have also found that disturbance of the cartilage matrix may expose the chondrocytes to mechanical stress, leading eventually to cell death.34
In tissues other than cartilage, mononuclear phagocytes are responsible for ingesting and disposing of dead cells. However, the absence of these phagocytes in cartilage implies that the remnants of dead cells remain in the matrix and potentially affect matrix structure and the function of viable chondrocytes.35 Furthermore, since chondrocytes are anchored in the extracellular matrix and are surrounded by a pericellular matrix, there is no apparent mechanism for the clearance of damaged or dead cells.23,24 Many studies have shown that there is a very low proliferative activity (also known as cell cloning) in OA chondrocytes resulting in cell clusters typical of OA cartilage.2,54 However it is doubtful that this is a mode of tissue repair since they do not appear to add to matrix anabolism.1
4.3 Apoptosis and Necrosis
cytoplasmic membrane and absence of the pericellular matrix (i.e. retracting from the surrounding matrix).23,24,41 Necrosis encompasses all forms of programmed and non-programmed cell death, however the term is commonly used for non-non-programmed or pathological cell death. Necrosis usually occurs in a localized area and typically results from exposure to cytotoxic chemicals or cell trauma, as occurs in an impact injury. It is characterized by a leaky or ruptured cell membrane (with a general lack of membrane integrity) and amorphous granular debris throughout the lacunae and matrix border.1,9,37,41
Figure 8. Articular Cartilage Chondrocytes. A. a viable cell B. a cell with characteristics of necrosis, and C. a cell with characteristics of apoptosis.
Excessive mechanical loading has been identified as an important factor responsible for the reduced chondrocyte viability.9,25,34,36,50 After performing cyclic indentation impacts on articular cartilage, Chen et al.9, found that in cartilage that had been loaded for 2 hours, 32% of the chondrocytes demonstrated the leaky cell membranes (characteristic of necrosis) in the middle to superficial zones. After 4 hours, less than 1% the cells were positive for apoptosis. The apoptotic cells increased to 73% after 2 days in culture. It was concluded that the first mode of cell death in the cartilage after repeated impacts was most likely
A
B
necrosis (even though some evidence apoptosis occurred).9 However the mode of cell death in injured and diseased cartilage may be a mixture of necrosis and apoptosis.
A study conducted by S.Hashimoto et al.23, examined the occurrence of apoptosis in human OA cartilage to determine its relationship to cartilage degradation. After examining normal and OA human cartilage, they found that apoptotic cells were surrounded by a matrix that showed proteoglycan depletion. In contrast, areas that had no apoptotic cells showed normal proteoglycan content.23 Another study by Quinn et al.45, observed general cell death and decreased matrix proteoglycan deposition near the articular surface for both low and high strain rates of loading.
5 Models of Cartilage Degeneration
Injury or mechanical loading of articular cartilage has been shown to be a major predecessor to degenerative changes associated with osteoarthritis.4,8,9,14,18,22,23,24,29,34,42,50,58 Although loads and forces applied to joints during daily activity have important influence on cartilage metabolism and structure, the stresses due to trauma, joint overuse and obesity may lead to cartilage degeneration.4,44 Many studies have attempted to simulate such loads in order to understand the pathways leading from joint injury to OA. However the progression to the disease is still not well understood.
5.1 Techniques for Experimental Loading of Cartilage
Several investigators have studied the outcome of damaged cartilage using either in vivo animal models of joint trauma,15,56,58 or by monitoring the changes after in vitro mechanically induced tissue trauma.6,31,25,28,4259 Although in vivo models provide a more realistic
models provide better control over the loading, are simpler and allow for a greater number of samples to be run. A disadvantage to this technique is the risk of additional damage to the explant as it is removed from the joint. In addition, the removal of the cartilage tissue from the bone has been shown to significantly affect the mechanical behavior of the tissue.25
Techniques for in vitro mechanically induced cartilage degeneration have included cyclic, compressive and impact loading.6,44 Cyclic or repetitive loading may simulate abnormal loads applied during locomotion. Compressive or sub-impact loading imitates weight-bearing in misaligned joints as in obesity or some sports activities. Single impact loads may simulate acute joint trauma that occurs in automobile accidents or sport injuries. These blunt impact injuries occur at a much more rapid rate than that of compressive loads (which evolve over seconds or more).44 Although in vitro model systems of mechanical loading do not accurately reflect what happens in human articular cartilage in everyday life, they provide an excellent means for explanation for the increased risk of OA posed by joint overloading.1
5.2 In vitro Impact Models of Articular Cartilage: Literature Review
loaded with the 500 g mass from 20cm. Cell viability was unaffected by moderate impacts but decreased linearly with increasing impact energy for all samples. The extent of damage through the depth of the tissue was much more severe for chondral samples than for samples left attached to the underlying bone during impact. The findings suggest that cartilage is very resistant to impact loads provided the bone-cartilage interface is intact, showing the underlying bone to have a strong protective effect.
A similar protocol was used in a study conducted by Krueger et al.,28 that subjected both chondral and osteochondral explants to a 30 MPa load at either a high rate of loading (600 MPa/s) or a low rate of loading (30 MPa/s), with the intent of determining whether the presence of underlying bone affects the degree of dead cell distribution. After 24 hours in culture, the results revealed that more matrix damage and a higher amount of cell death in all zones was seen in chondral explants than osteochondral explants at the low loading rate. At the high rate of loading, the percentage of cell death was lower in the intermediate and deep zones of the osteochondral explant. Therefore the presence of underlying bone had an affect on thecell death distribution and limited the degree of cell death and matrix damage through the thickness of the explant.
at either a high rate (~900 MPa/s) or a low rate (40 MPa/s) of loading to a peak load of 1247N (40 MPa) and cultured for 4 days post-loading. Gross observations indicated surface fissures only in the top surface for all loaded explants with cell death appearing to be adjacent to fissures for specimens subjected to the high load rate. Results revealed that the number of dead cells and percentage of dead versus live cells were significantly higher and distributed more diffusely in explants subjected to the low rate of loading. After two days, the amount of GAG released to the media from explants subjected to the high rate of loading was significantly greater than that released from specimens exposed to the low rate of loading, indicating a possible increase in matrix damage. These results imply that the higher cell death in the low loading rate group may have caused a cell-mediated degradation of proteoglycans, however it was unclear if the GAG loss represented cell-mediated degradation or a direct loss due to matrix damage. There were no significant differences after three days post-culture. The study concluded that in unconfined compression experiments on cartilage explants, the rate of loading can significantly affect the degree of matrix damage, the distribution of dead cells and the amount of cell death.
Another study, which was also performed by Ewers et al.,17 examined affects of the
an increase in surface fissures and a 29%, 60% and 44% increase in thickness under the lateral, central and medial sites respectively, compared to the low rate of loading. This experiment concluded that the rate of impact loading may be a highly important factor in determining the mechanisms of chronic retropatellar cartilage injury.
A flat impactor was also used in a study by Lewis et al.,31 to examine cell death after impact, as a function of spatial location and time. The articular surface of whole, intact, mature bovine patellae, were impacted at 6000 N/s to a target peak load of 1500 N (53 MPa in 250 ms). Cartilage sections were removed from the bone and placed in culture groups of 18 hours and 5 days post-impact and the cartilage was divided into four zones of equal depth through the cartilage layer. The greatest loss of cell viability was in the surface zone, but the statistically significant difference was found in zones 1 and 2 and there was no statistical difference between the 18 hour and 5 day values in any zone due to impact. At 5 days, cell death increased in the surface layer in both the control and impacted tissue. There was no difference in cell viability in impacted regions away from visible cracks compared to non-impacted controls. A decrease in viable cell density was seen to be localized only in specimens with macroscopic matrix cracks. Therefore cell death after impaction of cartilage on intact patellae occurred around impact induced cracks and not in impacted areas without cracks.
Unlike the previously described study, many investigators prefer to use curved or contoured impactors to perform direct impacts to the articular cartilage surface. An experiment was performed by Zhang et al.,59 to evaluate the extent of gross and histological
three groups and exposed to in vitro impacts of uniform stresses from a drop tower height of 40 cm: four knees had a 350 g mass dropped onto a contoured impactor, four knees had a 1050 g mass dropped onto a contoured impactor and four knees had a 1050 g mass dropped onto a flat impactor. Gross examination indicated that contoured impactors produced superficial fibrillation (and progressed deeper as impact stress increased) while flat impactors produced deep cracks in the tissue. Histologically, the severity of damage correlated with the magnitude of the impact force, where impact forces above 500 N created more damage than impact forces below 500 N. None of the specimens showed any injury or damage to the subchondral bone. It was concluded that flat impacters are best used to study localized impact damage while contoured impactors are ideal if the goal is to study diffuse cartilage damage or stress effects.
of injury (i.e. impact versus sub-impact) will be evident among non-physiological joint loading histories.
Similarly, other studies have also observed cell death and proteoglycan depletion mainly in the superficial zone of cartilage. A study using both osteoarthritic and healthy human articular cartilage was conducted by Hashimoto et al.23 Immediately after removing cartilage samples from the femoral condyles, the number of apoptotic chondrocytes was analyzed using flow cytometry. It was found that the high frequency of apoptotic cells in the superficial layer correlated with the most severe loss of proteoglycan in this area. Similarly, Lafeber et al.,30 also compared osteoarthritic and healthy human knee cartilage. After 4 days in culture, a lower rate of proteglycan synthesis was seen in OA cartilage compared to normal cartilage in the superficial cartilage layer. Also, chondrocytes in the superficial zone of osteoarthritic cartilage (compared to normal cartilage) were mainly joined in cell clusters and proliferating. It was suggested that the proliferative activity may have caused the inability of the chondrocytes to contribute to proteoglycan synthesis.
and cell cluster formations were observed. Control patellar specimens were free from histopathological changes. Similar results were seen in Tew et al’s study,54 where initial cell death was seen at the lesion edge of a cartilage wound created by a trephine. By day 5 post-injury, a proliferative cell response was seen subsequent to the cell death. These findings suggest that the impaction of articular cartilage was the initiating factor for progressive osteoarthritic-like changes, but the damage progression or repair mechanisms require further investigation.
6 Purpose of Study
cellular changes that herald the beginning of osteoarthritis and how these critical changes may lead to articular cartilage degradation and advanced osteoarthritis are yet to be conducted. The goal of this research is to study the changes in chondrocyte viability and proteoglycan concentration relative to the magnitude of an impact injury, time following the injury, and relative location within the cartilage layer. If the occurrence of these degenerative events can be identified temporally, it may represent a window of opportunity for intervention. Therefore such studies will not only contribute to existing knowledge but will also help create new and improved treatments and intervention therapies for conditions such as osteoarthritis.
6.1 Hypotheses
Subjecting articular cartilage to injurious mechanical loads (similar to an injury) will result in chondrocyte death and proteoglycan depletion. The cellular matrix changes will be dependent on the magnitude of load, days in culture and the position in the tissue related to the center of impaction.
Mechanical injury of normal porcine articular cartilage will result in a higher incidence of cell death compared to non-impacted controls. Cell death will occur initially at the superficial zone for medium loaded cartilage, and at both superficial and deep zones for high loads. Cell death will occur initially in the center of impaction and will continue outward toward the adjacent radial positions over time.
7 Methods
In this study, paired porcine knee joints from adult pigs were obtained fresh from a local slaughterhouse. The cartilage of the patellae were injured with a single impaction of high load (2000 Newtons) or medium (1000 Newtons) load level to the articular surface. Degenerative changes were followed after entire patellae were placed, intact, into culture for a time period of 0, 3, 7, or 14 days. Two different analyses using light microscopy were performed through the depth of the articular cartilage tissue on the impacted sites for: (1) measurement chondrocyte death, and (2) measurement proteoglycan distribution.
7.1 Randomization of Specimens
Table 1. Randomization of Specimens Right Leg Left Leg Randomization M3 H0 C7 H0 M0 C0 C3 M7 H7 H3 C3 C14 H3 C0 M0 M3 H7 M14 M14 H3 C14 H14 M3 C7 C7 M14 H0 H7 C14 C0 H14 C3 M7 M7 H14 M0 0.012737 0.06598 0.075959 0.196122 0.205526 0.213661 0.254995 0.298631 0.326353 0.328928 0.521827 0.572349 0.612532 0.622903 0.681366 0.855188 0.885797 0.906083
Table 2. Impaction Groupings – paired left and right patella from the same animal. No Load
Right Left
Medium Load Right Left
High Load Right Left 0 3
0 7 0 14 3 7 3 14 7 14
0 3 0 7 0 14 3 7 3 14 7 14
0 3 0 7 0 14 3 7 3 14 7 14
(C, M or H), time in culture (0, 3, 7, or14), knee (R or L), facet (M or L) and type of load (i.e. axial) (Table 3).
Table3. Schedule of Experiment Dates and Associated Specimens TEST
DATE ORDER LOAD CULTURE TIME LEG SPECIMEN NAME
06/13/03 1 2 3 4 Medium Medium High High 7 14 7 0 Right Left Right Left M7RMax M14LMax H7RMax H0LMax 07/01/03 5
6 7 8 9 10 11 12 High High Control Control Control Control High High 3 7 3 14 14 0 3 14 Right Left Right Left Right Left Right Left H3RMax(a) H7LMax C3RMax C14LMax C14RMax C0LMax H3RMax(b) H14LMax 07/29/03 13
14 15 16 17 18 Control Control Medium Medium Medium Medium 0 3 0 7 3 7 Right Left Right Left Right Left C0RMax C3LMax M0RMax M7LMax M3RMax M7LMax 08/12/03 19
20 21 22 High High Medium Medium 7 14 14 0 Right Left Right Left H7RMax H14LMax M14RMax M0LMax 09/12/03 23
24 25 26 Medium Medium High High 3 14 0 3 Right Left Right Left M3RMax M14LMax H0RMax H3LMax 10/03/03 27
28 29 30 31 32 Control Control High High Medium Medium 7 14 0 14 0 3 Right Left Right Left Right Left C7RMax C14LMax H0RMax H14LMax M0RMax M3LMax 10/10/03 33
34 35 36 Control Control Control Control 0 7 3 7 Right Left Right Left C0RMax C7LMax(a) C3RMax C7LMax(b)
7.2 Porcine Patella Removal
Prior to extracting the patellae from the knee joints, all utensils and objects coming in contact
with the specimens were steam sterilized in an autoclave at 121°C for 55min gravity cycle
Figure 9. Patella in PMMA Mold
Fresh sterile sheets were placed on the counter in preparation for patella extraction from the corresponding left knee. The above steps were repeated for a left knee. Immediately after patella extraction, PMMA mixtures were prepared (to create individual molds for each patella) using 80g sterile PMMA powder and 40cc sterile PMMA (Osteobond Copolymer Bone Cement, Zimmer, Inc., USA #1101-08) liquid at room temperature. The bony non-articular surface was pressed into the partially set PMMA in the spherically bottomed mold to create an imprint. The patella was immediately removed to prevent any heat related damage. When the PMMA was completely set, the patella was placed in the cement (Figure 9).
7.3 In vitro Patella Impactions
of each facet could be aligned perpendicular to the impactor. The stainless steel, non-porous, cylindrical impactor was 10 mm in diameter and 7.7 mm wide. The impactor, in series with a three degree of freedom piezoelectric load cell, created a uniform plane strain loading along the 7.7mm length of the impactor (Figure 10). The piezoelectric load cell measured force in three directions: radial shear, longitudinal shear and axial force.
Figure 10. Piezoelectric Load Cell. Measurement of force in three directions in series with the contoured impactor.
Radial Shear Axial Force
Figure 11. The MTS Mini Bionix Hydraulic Load Frame
Figure 12. Location of Tissue Dye Marks (on one facet).
Controlled mechanical injuries were produced on each facet at a displacement rate of 25 mm/sec using the MTS load frame, to pre-selected force levels of 1000 N (moderate) and 2000 N (high). These force levels were chosen to obtain certain levels of gross tissue damage and they are similar to those previously found to be associated with cell death and matrix changes associated with impact loading.44,59 Non-impacted patellae were used for controls. Control patellae (which were also marked with tissue dye in the same general area as the impacted specimens) allowed for comparison of changes with those resulting from the impact injury.
Figure 13. Impaction Apparatus A. Impactor and three-degree of freedom piezo electric load cell B. Holder for potted patellae.
A B
Figure 14. Patella in Impaction Apparatus. A. Patella secured or impaction B. Impactor near patella surface.
Using the MTS machine (Figures 11, 13 and 14), patellae were impacted twice, once on the middle of each facet, which provided two sites for analysis. Cartilage from medial facets was used for cell viability and proteoglycan analysis in this study. Cartilage from lateral facets is intended for future research involving biochemical analyses.
7.4 Patella Organ Culture
was changed daily under a laminar flow hood using a 5 ml sterile pipet and an aspirator to remove the old media. Fresh media at room temperature was then poured in the glass dish, careful not to let the media bottle come in contact with the glass. Specimens were then maintained at 37˚C in a CO2 water-jacketed humidified incubator (Fischer Scientific) with
5% CO2.
A
B
Figure15. Patella Incubation, A. Patella in media, cradled in stainless steel wire holder B. Patella in incubator.
Culture dishes were kept on a rocking platform in the incubator to constantly stir the media, ensuring that its contents were evenly distributed. Patellae remained in culture for 0, 3, 7 or 14 days to allow the subsequent degenerative changes to be followed. All specimens were extracted, impacted and put in culture within 3-4 hrs of animal sacrifice.
7.5 Tissue Analysis
A
B
Figure 16. Tissue Preparation and Freezing, A. Medial facet, stained with MTT and the impact center re-marked with tissue dye. B. Cartilage sections cut through impact center and mounted in OCT gel.
Specimens were frozen in the gel using dry ice pellets in 100% Ethanol. Frozen tissue
samples were labeled and stored in a freezer at -80°C until ready to be cryocut and counter-stained with Safranin-O. Safranin-O is a cationic dye that binds stoichiometrically to the fixed negative charge content of GAGS (i.e. chondroitin-6-sulphate) in the articular cartilage matrix.27,51 Cryosections of 6 µm thickness were cut using a Leitz cryostat. Sections
intended for cell viability quantification were counter-stained with 0.01% Safranin-O aqueous solution for 10 seconds, resulting in a light pink colored extracellular matrix. Sections intended for proteoglycan distribution analyses were stained with 0.1% Safranin-O aqueous solution for 1 minute, resulting in a dark pink or red colored matrix. Sections were then put on microscope slides that were precoated with a mounting medium of glycerin jelly for lightly stained Safranin-O sections and Permount (Fisher Scientific) for darkly stained Safranin-O sections.
7.6 Data Collection
Preliminary tests using ultra low load Fuji film on separate test patella were used to calculate the contact radius of the impaction. Half of the total width of the contact area was used as the impact radius. Calculations determined that a value of 1640 (or 1.64 mm from the center
. .
magnification. An average value of 1790 or (1.70mm from the center of impaction) corresponded to the radius (r) of a high impaction. Therefore these values were used to
determine the metric distance of ±2r, ±r and ±r/2 from the impact radius, “0” (Table 4 and Figure 17). For example, radial position 2r was approximately twice the contact radius ( r ) and position r/2 was half the contact radius, and so on. Since the radii for moderate impactions were smaller, these were used to analyze control patellae.
Table 4. Distances From Impaction Center (in millimeters),
calculated from the position of the contact radius at 40X magnification.
-2r -r -r/2 0 +r/2 +r +2r
Controls, Mediums
(mm)
-3.28 -1.64 -0.82 0 0.82 1.64 3.28
Highs
(mm) -3.58 -1.79 -0.89 0 0.89 1.79 3.58
Figure17. Impact Geometry, A. The contact radius (r). B. Location where the histology measurements were made.
Image analysis was performed using Metamorph imaging software with a 40X microscope objective. Starting at the center of impaction, pictures were taken at vertical displacements
of 173 µm from the superficial zone to the deep zone. A journal was prepared in Metamorph
to allow the microscope stage to move from the surface zone to the deep zone at the vertical increments of 173 µm in length. Each picture at these increments was 220 µm in width.
When all pictures were taken from the center of impaction, a montage was created that stacked the individual pictures as a single column. The process was repeated at each radial distance to create one column each, creating 7 columns: -2r, -r, -r/2, 0 (i.e. center of impaction), r/2, r, and 2r (Figure 18). The number of images per column ranged from 5 to 8, depending on the thickness of the tissue cross-section.
r A Impact Geometry
Cartilage
Bone
B Measurement Regions (Cryosections)
r 2r
3r _r
2
Impact center
Surface Zone Mid Zone Deep Zone }
Figure 18. A Collective Montage. Seven montages (one for each radial position) for an MTT-stained specimen.
Each column was divided into 10 equal rectangular regions (Figure 19). The distribution of cell viability and proteoglycan concentration was examined through the thickness (i.e. depth) of each cartilage layer: 1-10. The area of the rectangles was influenced by the thickness of the cartilage. All slides were analyzed in random order with respect to force level, days in culture and date of impaction.
-2r -r -r/2 0 r/2 r
Figure19. Tissue Column (divided into 10 regions for analysis).
7.7 Measurement of Safranin-O Staining Intensity: Proteoglycan Distribution
Safranin-O staining was measured in each of the 10 regions. Stain intensity was quantified by measuring the pixel intensity of the stain in each region, with the intent to obtain an unbiased quantitative measurement of the proteoglycan distribution in a specific area. The pixel intensities, valued between 0-255, were used as a measure of proteoglycan distribution in each of the 10 regions. A value of 0 was most intense (i.e. black) and a value of 255 was least intense (i.e. white).
1
2
3
4
5
6
7
8
9
Figure 20. A Collective Montage. Seven columns (one for each radial position) for a control/normal specimen stained with Safranin-O.
To eliminate the intra-tissue variability, the average intensity at each region was then divided by the average intensity of the deep (region 10) at the center of impaction, in order to obtain a normalized intensity. These normalized values were used for the actual quantification of proteoglycan intensity. Measured intensity values ranged from 0-2, with 0 being darker and 2 being lighter than the intensity at depth 10 at the center of impaction. Regions of tissue with excessive tears, folding or abnormal coloration were excluded from the data set in order to avoid tainting the overall intensity calculations.
7.8 Quantification of Chondrocyte Viability
The number of live and dead chondrocytes was counted in each of the 10 regions. All cells containing any traces of indigo-colored MTT stain were designated as live. All
-2r -r
-r/2
unstained cells were assumed to be dead. Cells were counted manually by labeling the live cells yellow and the dead cells green using Metamorph software. Cells at the borders of each region were counted only if they were more than halfway within the image region. The number of live and dead cells in each region was recorded manually into an Excel spreadsheet, along with the total number of cells in each region and total number of cells in the entire column (i.e. regions 1-10). Regions with 0 total cells or incomplete tissue sections were excluded from the data set. The regions with 0 total cells would have created a problem in determining the % dead cells because it would have been calculated in the spreadsheet as “0% dead cells” (i.e. 100% live cells), which was not the case in these regions. Abnormal cell death was classified as cells that may have died near the tissue edge, adjacent to the cut made with the band saw, when separating the 2 facets. The tissue sections near radial position ±2r were mostly affected by abnormal cell death.
Incomplete tissue sections were those that could not fill the 220 µm width at the edge of
the histological section (i.e. 2r), therefore were not a complete section. Examples of these were specimens that were not cut wide enough to capture the entire array of radial positions.
7.9 Statistical Analysis
The above collected data was logged into text files and exported to Microsoft Excel spreadsheets. Based on the balanced incomplete block design, an ANOVA was performed
using SAS software to analyze the data using significance level of α=0.05. Changes in
Safranin-O staining intensity and the percent of dead cells were analyzed with the independent variables being impact level (control, medium, high), time in culture (0, 3, 7, 14
Further analyses of specific comparisons within load-culture, load-depth, load-radial and radial depth interactions, were assessed using the pairwise Bonferroni criteria.
8 Results
A total of 36 patellae (18 left and right pairs) were used in this study. Twelve patellae were impacted at the medium load level (with a target load of 1000 N), twelve for the high level (with a target load of 2000 N) and twelve were used for control. The actual loads obtained from the medium impactions were 1047 ± 122 N normal, 132 ± 77 N
radial shear and 48 ± 29 N longitudinal shear. The actual loads obtained from the high
impactions were 2239 ± 178 N normal, 233 ± 164 N radial shear and 81 ± 61 N
longitudinal shear. Three patellae were used for each culture time for each of the three load cases. Two sets of analyses were performed to study the effect of impact stress on chondrocyte viability and proteoglycan content at 0, 3, 7 and 14 days after impaction.
8.1 Chondrocyte Viability
The number of dead cells, live cells and total cells was counted and the percent of dead cells was assessed at each radial position and through the depth of the tissue. Overall analysis showed a significant load effect (p=0.002), culture time effect (p= 0.005), radial effect (p= 0.025), and depth effect (p<0.0001). There were significant load-culture and load-depth interactions but not significant load-radial, depth-radial or culture-radial interactions. The average percent of dead cells in the tissues for each load at all culture times were 6.4 ± 12.7 % for the controls, 19.5 ± 21.2 % for the medium and 21.1 ± 24.8
The medium and high impacted specimens both showed a significant increase in cell death after 3 and 7 days in culture compared to the unloaded controls (p<0.0001). However the difference between the medium and high impactions were only significant
after 14 days in culture (p=0.0006), where the mean % cell death was 15.59 ± 17.69 %
for the medium load and 22.01 ± 22.92 % for the high load. This indicated an overall
higher percentage of cell death in the high impacted specimens than in the medium impacted specimens only after 14 days post-culture (Figure 21). For all loads and all culture times, there was an overall increase in the average cell death (p<0.0001) from 3.13 ± 6.97 % (depth=2) to 26.27 ± 25.82 % (depth=10). The top layer, depth 1, had
significantly higher cell death (10.5 ± 16.6 %) than depth 2 just beneath it (p=0.005).
0 5 10 15 20 25 30
0 3 7 14
Days in Culture
%
De
a
d
Ce
ll
s
Controls
Mediums
Highs
Figure 21. Mean Percentage of Dead Cells
At depth 7, the percent of dead cells in the high impact group at 0 days post-impact, was significantly higher (38.96 ± 28.99%) compared to the controls (11.99 ±
15.63 %) and mediums (17.91 ± 24.75 %), where p=0.043. For the high impactions after
dead cells in the high impacted specimens, compared to controls and mediums, was seen after 7 days in culture, increasing from 7.4 ± 14.6 % at time zero to 29.1 ± 29.1 % at
seven days. At 0 days post impact there was also significantly more cell death for the medium impactions compared to controls within depths 1-2 (p=0.012) and 9-10. (p<0.0001). After 3 and 7 days in culture, there was generally a significant increase in cell death within depths 4-10 (p=0.003 to 0.016 respectively) for the medium impacted specimens compared to controls. Therefore the percent of dead cells immediately after impaction (0 culture days) was greater in surface and in deep layers for the medium impactions and in the middle layers for the high impactions. Additionally, the cell death appeared only at the middle to deep layer for medium impacts after 3 days and at the surface layers and deep layer for high impacts after 3 days. In high impacted specimens at 14 culture days, the cell death then decreased to 32.9% and 32.2% at depths 9 and 10 respectively. The overall percentage of cell death after 7 and 14 days in culture was lower than the cell death at 3 days in culture (p< 0.0001). There were also a significantly greater number of total cells (p<0.0001) and live cells (p<0.0001) after 7 and 14 days in culture than at 0 and 3 days.
Figure 22. Percentage of Dead Cells by Tissue Depth - for all loads (control, medium, high) and culture times (0, 3, 7 and 14 days).
0 Days in Culture
0 10 20 30 40 50 60 70
1 2 3 4 5 6 7 8 9 10
Tissue Depth % Dead C el ls Control Medium High
3 Days in Culture
0 10 20 30 40 50 60 70
1 2 3 4 5 6 7 8 9 10
Tissue Depth % D ead C e lls
7 Days in Culture
0 10 20 30 40 50 60 70
1 2 3 4 5 6 7 8 9 10
Tissue Depth % D ea d C ells
14 Days in Culture
0 10 20 30 40 50 60 70
1 2 3 4 5 6 7 8 9 10
Figure 23. Percentage of Dead Cells by Radial Position - for all loads (control, medium, high) and culture times (0, 3, 7 and 14 days).
7 Days in Culture
0 10 20 30 40 50 60 70
Neg2R NegR NegR/2 Center R/2 R 2R
Radial Position % De ad Ce lls
0 Days in Culture
0 10 20 30 40 50 60 70
Neg2R NegR NegR/2 Center R/2 R 2R
Radial Position % Dea d Ce lls Control Medium High
3 Days in Culture
0 10 20 30 40 50 60 70
Neg2R NegR NegR/2 Center R/2 R 2R
Radial Position % D ead Ce lls
14 Days in Culture
0 10 20 30 40 50 60 70
Neg2R NegR NegR/2 Center R/2 R 2R
8.2 Proteoglycan Content
The proteoglycan content was assessed according to the color intensity and the normalized intensity (relative to the center position at depth 10), at each radial position and through the depth of the tissue. Overall analysis showed a significant load effect (p=0.002), culture time effect (p<0.001), radial effect (p<0.001) and depth effect (p<0.001). Interactions were significant for load-culture, load-depth and load-radial effects. The depth-radial interactions were not significant. For all depths 1-10, the
normalized average intensities in the tissues were 1.003 ± 0.2 for the control, 1.04 ± 0.2
for the medium and 0.97 ± 0.3 for the high impactions (p<0.0001). This represented a
trend of darker proteoglycan staining for the controls (relative to center position at depth 10) compared to the medium loads and darker staining for the high loads than controls. The normalized intensity values were significantly greater (p<0.0001) in the surface layers (depths 1-2) and deep layers (depth10) than in the middle layers (3-9) for all specimens at all loads and culture times. For example, values were 1.28 ± 0.2 , 0.95 ±
0.2, 1.01 ± 0.1 for depths 1, 5 and 10 respectively. Similarly, all controls had lighter staining at the top and deep layers than in the middle layers (p<0.0001), where values
ranged from 1.33 ± 0.23, 0.922 ± 0.91, and 1.03 ± 0.13 for depths 1, 5 and 10
medium loaded specimens was significantly lighter than depth 10 at the center of impaction (Figure 24).
0 0.2 0.4 0.6 0.8 1 1.2 1.4
1 2 3 4 5 6 7 8 9 10
Tissue Depth
N
o
rm
al
iz
ed
In
te
n
si
ty
Controls Mediums Highs
Figure 24. Mean Normalized Intensity by Tissue Depth - for each load level.
At 0 culture days, the normalized intensity values were 0.90 ± 0.2, 1.01 ± 0.2, and
1.17 ± 0.3 for the control, medium and high load levels respectively (p<0.0001). An opposite effect was seen after 7 and 14 days as the PG concentration became higher for
the medium impact specimens (1.16 ± 0.22 and 1.03 ± 0.15), than the high impacted
specimens (0.92 ± 0.14 and 0.88 ± 0.23). For each load level and corresponding culture
time, the only significant change in PG concentration was seen at depth 1 for the medium impacted specimens after 14 days (p=0.002).
Figure 25. Normalized Intensity by Tissue Depth - for all loads (control, medium, high) and culture times (0, 3, 7 and 14 days).
0 Days in Culture
0 0.5 1 1.5 2
1 2 3 4 5 6 7 8 9 10
Tissue Depth N o rm aliz ed In te n sit y Control Medium High
3 Days in Culture
0 0.5 1 1.5 2
1 2 3 4 5 6 7 8 9 10
Tissue Depth N o rm aliz ed In te n sit y
7 Days in Culture
0 0.5 1 1.5 2
1 2 3 4 5 6 7 8 9 10
Tissue Depth N o rm aliz ed In te n sit y
14 Days in Culture
0 0.5 1 1.5 2
1 2 3 4 5 6 7 8 9 10
Figure 26. Normalized Intensity by Radial Position - for all loads (control, medium, high) and culture
3 Days in Culture
0 0.5 1 1.5 2
Neg2R NegR NegR/2 Center R/2 R 2R
Radial Position N o rm a liz e d In te ns it y
3 Days in Culture
0 0.5 1 1.5 2
Neg2R NegR NegR/2 Center R/2 R 2R
Radial Position N o rm a liz e d Int e ns it y
7 Days in Culture
0 0.5 1 1.5 2
Neg2R NegR NegR/2 Center R/2 R 2R
Radial Position N o rm al iz ed In te n s it y
14 Days in Culture
0 0.5 1 1.5 2
Neg2R NegR NegR/2 Center R/2 R 2R
9 Discussion
The main objective of this study was to evaluate articular cartilage cell viability and changes in proteoglycan content caused by impacts of different force levels at various culture times after the impact. Several studies have shown that impact injuries on articular cartilage can lead to cell and matrix changes similar to those seen in the degenerative process that leads to osteoarthritis.5,9,13,17,25,28,31,45,55,56,59 However there are conflicting results and it is still unclear if matrix changes are cell-mediated or caused by direct damage. No known studies have examined both the time and location-specific effects of impact loads on intact (patella) specimens for up to two weeks in culture. The outcome of such test criteria in this study is one step in understanding the early degenerative changes that can lead to osteoarthritis.
Therefore significant comparisons could only be made within tissues (and not between impacted tissues or between impacted and un-impacted tissues). Comparisons made between impacted tissues or between impacted and un-impacted specimens were only trends, and not necessarily significant. One way to reduce this problem would be to calculate normalized intensity for each depth in relation to the corresponding depth in the tissue column at the center of impaction. For example, use depth 1 at the center to calculate the normalzed intensity for depth 1 at radial position 2r, and so on. However this method is very complex and may promote further confusion. Therefore another way would be to develop standards for proteoglycan concentration that could be used to compare staining obtained from experiments. If the ±2r sections were not problematic, these sections would have been better to use for normalized calculations since the tissue at these positions were expected to be normal.
In agreement with the first statement in the hypotheses, it was found that the cellular and PG changes depended on the magnitude of impact load and time in culture. Findings indicated that the average percent of dead cells (regardless of culture time) increased with increasing impact load. Regardless of the time in culture, the normalized PG concentration overall was lower in cartilage exposed to medium impactions than in high impacted specimens. The depth-dependent changes in cell viability and proteoglycan content however, depended on both impact magnitude and the length of time that the tissue was in culture.
concentration (immediately after the high impaction), PG content steadily increased from the surface and deep layers to the middle layers as culture time increased. Again, it should be noted that these values were compared to normalized intensities in control tissue, and are not necessarily statistically significant. Nonetheless, studies have reported similar results where proteoglycan biosynthesis decreased (and water content increased) with increasing impact stress within the first 24 hours.5,13,55 Another study by Ewers et al.,18 found that after initial GAG loss from cartilage subjected to high loading rates after 1 day, the GAG loss decreased after 2-4 days. The current study shows evidence of a relative increase in PG content in areas that contain significant cell death. However the mechanism for the trend of higher levels of PG content in the high impacted specimens compared to the mediums still needs further investigation. The difficulty in comparing control PG levels with impacted specimens is, again, attributed to the method of calculating normalized intensity. Once a valid method of normalized intensity calculations is established however, it would be interesting to investigate the effect of impact loads on the collagen matrix and to measure water content in association with PG content and cell viability, since the collagen fibrils are responsible for anchoring the proteoglycans and preventing them from expanding.
decreased. Similarly, a study that used identical load magnitudes suggested that this result may have been caused by the cell death in areas of low PG content, resulting in a cell-mediated degradation of proteoglycans.18 This result may have also been due to a cellular response due to matrix injury including increased rates of matrix turnover and remodeling. On the other hand, it may have reflected an increased passive loss of proteoglycan due to mechanical disruption of the matrix.44 In the current study, since the PG content increased and finally decreased again (significantly in the top layer), compared to depth 10 at the impact center for medium impactions throughout the time in culture, this may have been due to intrinsic remodeling of the cartilage matrix which can also occur without any external signs of degeneration. Investigators have reported that if the damage is minimal, complete surface repair may result.56 Therefore in the case of the higher proteoglycan content in the high impacted cartilage in the current study, it is unlikely that this increase is due to repair and should probably be attributed to alternate mechanisms. Further study is necessary to identify and investigate these mechanisms.
chondrocytes from 6 hours to 7 days post-injury. Another study by Triantafillopoulos et.al.,56 found a combination of necrotic and apoptotic-like cell morphology after an impact injury. At 8 days after injury most chondrocytes had a well-organized nucleus but the cytoplasm and cytoplasmic membrane were completely disorganized. At 15 days post-injury, there was a total disorganisation of the nucleus, aggregation of lacunae in the cytoplasm some traces of the cytoplasmic membrane. Since the cell viability assay used in the current study did not stain the dead cells, the unstained cells displaying the above mentioned characteristics, especially after 7 days post-impaction, may have been difficult to see even at 40X magnification and were therefore not counted (Figure 27). If these unstained cells were not counted due to apoptotic-like morphology, it is possible that some of the cell death occurring after 7 and 14 days after impaction died via the apoptotic pathway. If this was the case, most of the dead cells at 0 and 14 days may be result of necrosis.
Figure 27. Live (MTT stained) and Dead Chondrocytes. Arrows indicate dead cells.
In a study that performed cyclic impacts on cartilage explants, Chen et.al.,9 found that 32% of dead cells after the first 2 hours post-impaction were characteristic of
necrosis. After 2 days the proportion of cells positive for apoptosis was 73%, concluding that necrosis occurred before apoptosis in repeated cartilage impacts. However future analysis involving apoptosis and necrosis specific cell assays using single impact protocols are necessary to support this theory.
The overall increase in total cells with increasing culture time may have been a result of cellular proliferation. Many studies have shown that there is evidence of proliferative activity in OA chondrocytes resulting in chondrocyte clusters typical of OA cartilage.2,30,54,56 In experimentally wounded cartilage explants, Tew et.al.,54 observed proliferation in the surface region at 5 days post-injury, although it declined to nonsignificant levels by day 10. This proliferative effect may have also been partly responsible for the decrease in percentage of cell death after 7 days post-impaction in the current study.
Figure 28. Cell Clusters. Observed in the surface zone (indicated by circles) of a high impacted specimen, ‘H14LMax_8.12.03’.
As shown in Figure 28, evidence of cell clusters (groups of 2 to 6 closely-associated cells) was observed in both 7 and 14 day specimens but were not accounted for in the
data set. The chances of proliferation contributing to tissue repair are low however, since the cell clusters do not necessarily contribute to matrix anabolism.1
Generally speaking, articular cartilage subjected to medium (1000 N) impact forces produce cell death initially at the surface and deep layers, proceeding to the middle layers with increasing time in culture. The overall lower proteoglycan content for medium (1000 N) impactions may be a result of cell-mediated matrix degradation. Articular cartilage subjected to high (2000 N) impact forces had cell death initially at the middle layers, proceeding to the surface and deep layers with increasing culture time. The overall higher proteoglycan content for high impactions may be the cause of cell death due to matrix injury. However further study is needed to examine these load dependent cellular and matrix interactions. Improvement is also needed on the method of normalized intensity calculations, in order to make comparisons between tissues and not just within tissues. The non-significant differences in radial position for both the cell and PG data may have been due to the size and shape of the impactor. An impactor with a smaller surface area (i.e. pointier) would have created a more concentrated load, thus creating the potential for more significant load effects.
10 Recommendation for Future Research
10.1 Stain for General Cell Death, Apoptotic Cell Death and Cell Proliferation
One challenge of this research was determining whether the decrease in dead cells after 7 to14 days post-impact was due to some (unstained) dead cells being less visible against the matrix and may not have been counted. If this problem could be eliminated, the true number of dead cells could be quantified and the outcome of the experiment may change. Most stains for general cell death are immunofluorescent probes and require fluorescent microscopy to be seen. For the continuation of this study it would be ideal to administer a stain that is specific for cell death and to use this stain together with the viable cell assay, MTT, in order to see all cells using light microscopy.
It is also possible that some cells that were counted as alive were in the process of dying via apoptosis. In order to determine if these cells are dying by this process, it is necessary to use the TUNEL stain to label the apoptotic cells. Other cells that were counted as live may have been a product of proliferation. An in vitro label, such as 3 H-thymidine can detect cell proliferation.54 Also, the “nearest neighbor” method can be used to measure the distance between cells over time (in addition to counting individual cell clusters).
10.2 Damaged Type II Collagen Analysis
In order to determine the role of type II collagen in cartilage matrix degradation, an antibody that recognizes epitopes available for binding denatured, but not native type II collagen such as COL2-3/4m can be used.54 The detection of the damaged type II