CONTINUOUS SELECTION FOR EGG PRODUCTION IN POULTRY
EVERETT R. DEMPSTER, I. MICHAEL LERNER AND DOROTHY C. LOWRY
University of California, Berkeley
Received March 31, 1952
HE genetic bases underlying the changes in populations under artificial
T
selection have been extensively explored both from the theoretical and the experimental approaches. The simplest situation in which selection is directed towards single traits, whose phenotypic variance may be regarded as the sum of the additively genetic and residual, or environmental, variances, does not appear to offer any serious problems a t the outset of a selection program (vide the expositions in the texts of LUSH 1945 ; MATHER 1949 ; LERNER 1950).However, even though the genetic situation might be adequately represented in this simple way at the start of a selection program, serious complexities may arise as the program is continued over many generations. One possi- bility, demonstrated to have occurred in a selection experiment for shank length in chickens (LERNER and DEMPSTER 1951) is that natural selection may come to exercise a strong effect countering that of artificial selection. Other disturbing influences may be anticipated on theoretical grounds, such a s the development of a negative correlation between component Characters, alter- ations in the phenotypic effects of given gene substitutions in response to altered genetic backgrounds, increases in the relative importance of overdomi- nance and other forms of nonadditive gene interactions, the emergence of seri- ously detrimental characteristics, such as infertility, as concomitants of the characters subjected to conscious selection, and possibly a decreased environ- mental variance of the superior genotypes.
694 EVERETT R. DEMPSTER E T AL.
correlation between viability and egg number, two components of the produc- tion index, (2) an analysis of the relationship between egg production and the reproductive fitness of the birds selected as parents of each generation, and (3) the changes in the heritability of the production index and its components over the period of selection.
Detailed information on the history of the population, the methods of selec- tion and management used, and on other relevant data have been previously given by
LERNER
(1950) and will not be repeated here. Suffice it to say that the population studied consisted of a flock of Single Comb White Leghorns varying in number between about 400 and 700 pullets per year (with one exception when the number dropped to 260 birds) in which the primary cri-230
220
2 10
200
190
180
1 70
160
150
140
130
120
1933 34 35 36 3 1 38 39 40 41 42 43 44 45 46 47 48
YEAR OF HATCH
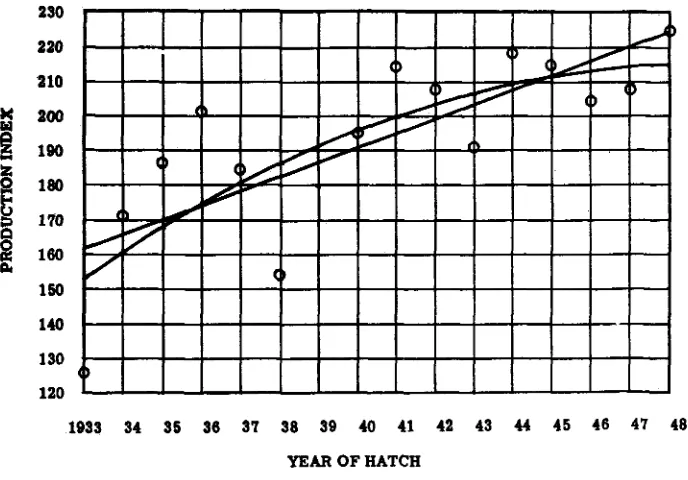
FIGURE 1.-The annual production index.
terion of selection was the production index of the birds themselves, their full- sister families, and, when available, their offspring. Starting with the level of approximately 120 eggs per year, the flock average rose in a somewhat irregu- lar fashion, as shown by the circles in figure 1, to a level fluctuating about values of 200-210 with a high point of 225 eggs.
SELECTION IN POULTRY
695
clude a definite conclusion as to whether the apparent decrease in rate of gain is a real one.T H E CORRELATION BETWEEN EGG NUMBER AND VIABILITY
The problem dealt with in this section refers to the question whether an
attenuation of genetic progress in this flock could be accounted for by the induction of a negative cortelation between the two components of the produc- tion index, egg number and viability, as suggested by LERNER (1950).
The material used for the study of this point consisted of six generations of the flock with some elimination of the small families. Three of the genera- tions studied were selected from the early years of the experiment, and three from the later years when the apparent gains were much reduced.l The pro- duction indexes of the total population for three generations were :
1933 125.6
1935 186.5
1934 171.8 194 1942 1 213.5 208.7
1943 190.9
Each generation consisted of birds surviving for.the whole of the first laying year (through September 30 of the second year of life), which had complete production records, and of birds which died between housing (approximately five months of age) and the completion of the first laying year. The measures adopted as estimates of production and viability were respectively average daily production rate (APR) and age at death (AD).
The first of these for surviving birds simply represented the number of eggs laid from beginning of production through September 30 of the second year of life divided by the number of days from hatch to the above date. For birds dying in the course of their first laying year, the numerator of the ratio de- scribed above was an estimate of the number of eggs the bird would have laid had she survived the full year. The estimating equation ( a different one for each month of death) was derived from the cumulative egg production records for different months of the laying year, previously reported by LERNER and CRUDEN ( 1948).
I t may be assumed since heritability of first laying year viability is low (LUSH, LAMOREUX and
HAZEL
1948; ROBERTSON and LERNER 1949), that ina great proportion of cases death is mediated by some nongenetic disposing cause, the genotype for viability being concerned, in part, with resistance to such variations 9r accidents of environment.2 It is thus logical to attempt an
estimate of the first year’s production that a dying bird would have had if it had been subjected to an environment more favorable from the standpoint
1 A limited number of computations reported here are based on the data tabulated by DR. H. M. EL-IBIARY.
6% EVERETT R. DEMPSTER ET AL.
of survival. However, many nongenetic influences tending to hasten death may be expected to affect rate of lay before death occurs. Ideally the impact of such effects on correlation between rate of lay and age at death would be separated by analysis of covariance between and within families. However, it is desirable from the standpoint of sampling error, and because some of the assumptions on which such separation rests may be only approximately true, to minimize as far as possible the influence of nongenetic variations simultaneously affect- ing egg number and age of death on the estimated production. Towards this end (and since the predisposing nongenetic causes of death are likely to pro- duce their maximum effects on egg number in the lastlweeks of life), the esti- mating equations were applied to the number of eggs laid by nonsurvivors up to one month prior to their death.
The two measures then respectively represent (1) the real or estimated average daily production for the year of laying ( A P R ) , and ( 2 ) the age in months of the survivors on September 30 of their second year of life and of the nonsurvivors at the time of death.
Phenotypic and genetic correlations between A P R and AD were computed far each of the generations and pooled estimates for the first three (1933-35) and the last three ( 1 9 4 1 4 3 ) were derived. The phenotypic correlation for the first period (representing 1639 pullets) was found to be 0.19. The correspond- ing estimate for the second period (1466 pullets) was 0.09. The respective genetic correlations were 0.20 and 0.49.
If we take these figures at their face value, we would have to conclude that the genetic correlation is not only positive but has undergone a marked in- crease. The decrease in phenotypic correlation would probably indicate, in view of the increased genetic correlation, a still greater decrease in correlation due to nongenetic influences acting on rate of lay prior to one month before death. However, the sampling errors of the genetic correlations are considera- bly greater than those of the phenotypic correlations as is evident from the following table showing the values of the correlation coefficients for each generation separately.
Generation Phenotypic Genetic
1933 0.15 0.28
1934 0.21
-
0.261935 0.20 0.73
1941 0.12 0.67
1942 0.05 0.98
1943 0.10 0.21
SELECTION IN POULTRY 697 The magnitude of sampling variations therefore preclude reliable conclusions regarding the apparent increase in the genetic correlations although the value for the second period, at least, is very likely positive.
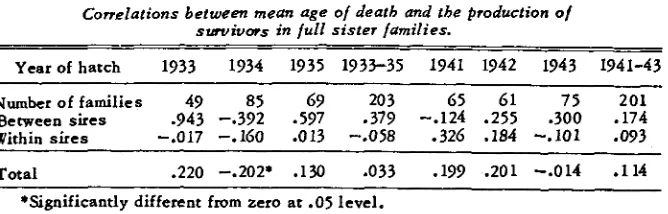
An attempt has been made to obtain information on the point of issue in a somewhat different way, namely on the basis of correlation estimates of the mean age of death in full sister families and mean production of the survivors in these families. The inter-sire Component of this correlation, if significant, should give a reliable indication of the sign of the genetic correlation between AD and APR. The actual value might be somewhat attenuated ; thus if there were a positive genetic correlation, a low mean genotype for survival in a sire family would tend to remove borderline birds from the class of survivors, increasing somewhat the mean level of the remainder. It can be shown that this tendency, in the event of normal distributions, could not reverse the sign of the correlation obtained. The intra-sire component of the computed correla- tion would be affected by maternal effects if these exist in any important degree.
The estimates of the components are shown in table 1. Neither the trends nor the differences from zero of the mean components, nor the totals are sta-
TABLE 5
Correlations between mean age o/ death and the production o/
survivors in lull sister lamilies.
Yearof hatch 1933 1934 1935 1733-35 1741 1942 1743 1941-43
Numberof f a d i e s 49 85 69 203 65 61 75 201
Between sues .743 -.392 -577 a379 -.124 -255 .300 .174 Within sires -.017 -.160 -013 -.058 -326 .I84 --.IO1 e073
Total .220 -.202* . I 3 0 .033 .179 .201 -.014 .I14 *Significantly different from zero at .05 level.
tistically significant. The results, while adding but little evidence to those previously obtained, are in agreement with them to the extent that both of the between-sires components are positive in sign.
Some additional information on the point a t issue may be obtained by com- paring the within-sires regression of surviving daughters on dams with that of the mean actual production of all daughters on dams. The dams themselves are necessarily first laying year survivors, since no pullets were used as parents in the material studied. Hence twice the regression of surviving daughters should give an estimate of heritability of survivors' production. This estimatc is expected to be negatively biased because of the use of family averages in selection, so that the latter is partly genotypic.
The heritability estimates thus obtained (see a later section of this article). are for 1933-1940, .418; and for 1941-1948,
-
.160.698 EVERETT R. DEMPSTER E T AL.
z
E
fi
2 :
U 2
2 % 9 2
2 4
s a
E O
4 2
3 30 3
Q " Q &
N - 3
;
2s
m a 9c
2;
H U.k
a * Q
3s
U 8
-2-
4 %
E &
E B
3 -
z 6
* -
a > E *
-2 P
38
- r r l n ;tt
I * .a
e *
* -
8;
U +
l a w
a b
!ii
i?z
t,
c
M
c n
M
c
n
"
c
P
w
s"
2 c
M
c
:
w U"
r c
N d w 0
SELECTION I N POULTRY 699 on dams has increased as shown by the comparisons of the values for 1933- 1940, .368; and for 1941-1948, .688.
The latter regression involves the genetic correlation between the produc- tion of survivors and viability, while the regression of surviving daughters on dams does not. Hence, the difference in the trends of these two regressions suggest, not only a positive genetic correlation in the later years, but a con- siderable change in the plus direction between the early and later years. How- ever, possible alternative explanations should be considered. An increase in the regression of all daughters on dams could result from an increase in the genetic correlation between production of survivors and production of nonsur- vivors. Since there has been a great increase in the number of eggs laid by non- survivors, an increase in this correlation is not unlikely although it is difficult to explain more than a part of the relative trends of the two kinds of regres- sions on this basis. Such a correlation would tend to increase rather than decrease the effectiveness of selection. Another, and more likely, explanation is sampling error.
I n any case, all of the three methods considered in this section suggest an absence of a negative, if not necessarily the presence and increase of a positive, genetic correlation between genotype for survival and genotype for production of birds if they survive. I t therefore seems apparent that the induction of a negative correlation between the components of the production index sug- gested by LERNER (1950) cannot be invoked in explanation of the attenuation of gains observed in this flock,
EGG PRODUCTION AND HATCHABILITY
I n the previously cited report (LERNER and DEMPSTER 1951) on the analy- sis of reproductive behavior of the females selected to be parents of each succeeding generation of the flock under study, no indication of a negative relation between egg number and reproductive fitness was found. This never- theless does not preclude the possibility that individual components of fitness may be adversely affected by high egg production. Accordingly an analysis of correlation between egg number in the first laying year, the number of fertile eggs produced in the course of a standard four-week hatching season in the spring of the birds’ second year of life, and the number of chicks pro- duced was undertaken.
Only two-year-old dams previously unmated were included in this analysis, and the correlations and regressions were computed on the intra-sire basis. The complete analysis appears in table 2, the last three lines summarizing the information with respect to the first part of the selection period, the second part, and the whole. The figures appearing in the table make it abundantly clear that no important differences in hatchability or number of chicks pro- duced exist between the periods of high and low genetic gain.
The absence of correlation between egg number and hatchability in this case is contrary to many earlier studies, in particular that of LERNER and GUNNS
700 EVERETT R. DEMPSTER E T AL.
latter case the whole range of egg production records was represented, while in the present table
2
a sample of only the extreme right hand tail of the distribution is included.It seems significant that contrary to the results obtained by LERNER and DEMPSTER (1951) in their shank-length selected population no decrease in reproductive fitness has occurred in this population in the course of selection. I n other words, here improvement in the production index was obtained at no cost in fitness of the population. The general notions of genetic homeostasis developed by us previously do not thus appear to explain the attenuation of gains, a fact already brought out earlier (LERNER and DEMPSTER 1951), and further confirmed by the current analysis.
TRENDS I N IIERITABILITY
The next source of gain attenuation which% worthy of examination lies in the possible changes in total heritability or in its additive component. It is not impossible that effective genetic variance has decreased in the course of selec- tion, both because of the selection itself and because of increased homozygosity from inbreeding occasioned by the small population size. Neither of these two causes is likely to be great in effect. The former (selection) in a multi-genic situation over a period of only a few generations cannot be expected to de- crease variance to any great extent unless some of the alleles subject to the discriminatory action of selection have quite large differential effects ; under certain circumstances selection may actually contribute to an increase in genetic variance. The latter (inbreeding) has proceeded at the rate of approxi- mately one percent per year as computed from increases in the inbreeding coefficients. The real increase may have been less if heterozygotes were favored by either natural or artificial selection.
A third possible cause, however, must not be overlooked, namely the effect of a different average genetic background (as evidenced by increases in the production index) on given gene substitutions. The direction of the effect pro- duced by this factor cannot be known a priori: on the one hand a decrease in the variance could be expected due to a possible approach of the average pro- duction to whatever physiological limits may exist; on the other, an increase may obtain because the heritability of the production of survivors is relatively high and the proportion of survivors in the flock increased. I n addition to quantitative changes in heritability, changes in specific gene frequencies and in over-all genetic background might alter the proportion of the variance that is additive.
SELECTION IN POULTRY 701 TABLE 3
Estimates of heritability of survivors’ production
Heritability e s t i m a t e s Intra-sin daughterdam
Year Number regre ss i o n
of of
hatch pullets From dam From s i r e
components components Joint Number of dams Regression
1733 215 1.152 .176 .664
....
....
1735 277 -385 -440 -413 30 .406
1737 286 ,185 .163 174 47 347
1738 241 .333 a356 .345 34 .453
1941 256
.
I68 .166 -167 46-
.3471734 356 .061 .284 * 172 43 130
1736 217 -a027 .823 .377 35 -153
1737 234 147 .177 172 33 027
1740 161 -.093- e38 1 .144 23
-
.0481942 240 .605 .208 .406 28 ,114
1744 171
-
.046 .222 .088 30 -1671743 477 .177 .lo2 -137 72
-.
1171945 281 -.290 -.025 -.158 47 188
1746 371 * 177 .lo3 .141 53 -.I57
1947 3i2 .276 .110 .I73 44 ,113
1748 436 .373 .372 .382 56 -.216
tables 3 and 4 respectively, while table 5 gives pooled values for the early and late periods of selection as well as for the total. The discrepancy between the numbers of birds used in the analysis and those in the previous report of LERNER and DEMPSTER (1951) is accounted for by the elimination of small families. Furthermore, in the computation of intra-sire daughter-dam regres- sions only two-year-old dams were used. Thus in each generation all the dams
TABLE 4
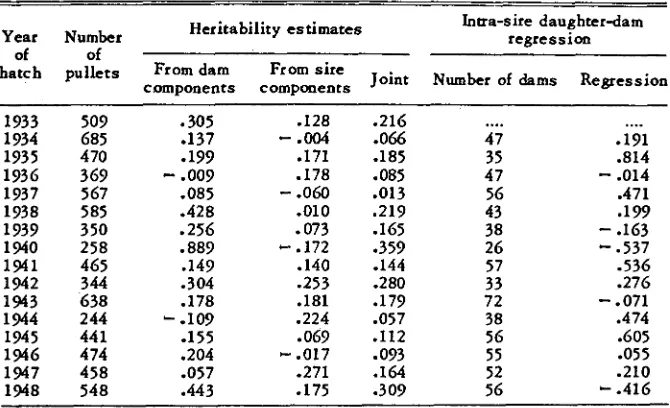
Estimates of heritability of the production index.
Intra-sire daughter-dam Heritability e s t i m a t e s
Year Number regression
hatc., of pullets of From dam From s i r e
Joint Number of dams Regression components components
1733 1734 1735 1736 1737 1738 1737 1740 1341 1742 1%3 1744 1345 1346 1347 1348 507 685 4 70 3 67 567 585 350 258 465 344 638 2 44 44 1 474 458 548
* 305
.I77
.137
-
.007 .085 .428 .256 .887 ,147 .304 .178-
.lo7-155 .204 .057 .443
,128
-
.004 ,171 .178-
.060.010 .073
+ .172 .140 -253 .181 .224 .067
-
.a17 .271 .175 .216 .066 .185 ,085 .013 .217 .165 .357 .144 .280 .177 .057 .112-
073 .164 -309....
47 35 47 56 43 38 26 57 33 72 38 56 55 52 56....
.171 .814-
.014 ,471 ,177-
.163-
.537-536
.276
-
.071 .474 .605-055
.210
702 EVERETT R. DEMPSTER ET AL.
were contemporary with each other. In tables 3 and 4 the actual regressions are given. In table
5
these have been converted into heritability estimates.O n the assumption that there is a linear relationship between heritability and year and that the deviations from the regression of one on the other are random and normally distributed, estimates of heritability trends were made for the survivors’ production and the production index. The regressions and estimates of heritability from them, made for the first year, last year, and the center of the regression line are given in table 6.
The estimates of heritability of survivors’ production from the dam and the sire components are very similar both for the early and late years. This is to be expected if the genetic variance is additive. Nonadditive genetic variance would usually tend to increase the dam-component estimates relative to those from the sire components. The regression coefficient of the joint estimate on year is negative and almost significant at the five percent level. The coefficients
‘TABLE 5
Pooled e s f i m t e s of heritability
Production index Survivors’ production
1933-1940
Degrees of freedom 3785
Pullets per dam 6.74
Pullets per sire 46.83
Heritability estimates :
From sire component .252 From dam component .04G
J oinr .149
From pullet-dam
regression* .368
Phenotypic variance 7464
1941-1948
3604 5.97 43.00
.198
.177
.688 -155
7369
~ ~~ ~~
1933-1948 1933-1940 1941-1948 1933-1948
7389 1983 2558 4541 6.34 4.29 4 $57 4.50 44.88 25.53 30.55 28.13
.225 .259 .201 .213
.OW .335 ,160 .217 .162 -297 .181 .215
S 6 8 .418 c.160 .092 7418 2163 3305 2806
- ~- ~ ~~
*These figures are subject to a much greater sampling error than the others (the degrees of freedom listed do not apply to them).
for the separate components, although not themselves significantly different from zero, are both negative and similar in magnitude to that of the joint estimate.
The joint estimate at the center period (assuming linear regression) is
24 2 .04, a moderately high value very significantly different from zero. The indications then are of a decrease from a heritability around .38 at the begin- ning of the period to .10 at the end, although little reliance can be placed on the estimated extent of the decrease.
704 EVERETT R. DEMPSTER ET AL.
If the indicated trends are real the heritability of the production index, the character most emphasized in selection, has changed little in magnitude but starting with a large nonadditive fraction has become more, and perhaps largely, additive a s selection progressed. By contrast, the heritability of sur- vivors’ production appears to be largely additive throughout and to be gradu- ally diminished as a result of inbreeding and selection. These relationships are not established with any high degree of significance but are the most likely conclusions to be drawn from the data. While little reliance can be placed on the heritability estimates based on within-sires dam-daughter regressions (table 5 ) , the relative trends (i.e., a decrease for the heritability of survivors’ production and an increase for that of the production index) agree with those based on variance components.
The heritability of viability in this flock has been investigated by
ROBERT-
SON and LERNER (1949). The joint pooled estimate (based on dam and sire components for the first twelve years of the selection program) is .OS9. Two standard errors were computed, one based on within years’ analyses, and the other on the variation of the estimates from year to year. The two estimated errors are .28 and .24 respectively. I n the present case, it is of particular inter- est to know whether the heritability has changed over the period of selection. A priori, a decrease might be expected, particularly in view of the decreased mortality and consequent greater departure of the dichotomy from the 50% point. Taking the estimates for the individual years, and assuming linear regression, the following results are obtained :
Regression ha estimates
b = ,011 f .007 t = 1.6 p m d.f. = -14
Beginning of period Center of period End of period
,026 f .062
.OM f ,023
.142 f .062 The assumption of regression and equality of weighting for the different years accounts for the slight differences in the central estimate and its standard error as compared with the pooled estimate and error cited above. The data suggest that the heritability of survival has actually increased during the period of selection, although the probability that the observed regression could have occurred by chance is no lower than .14. If this increase is genuine it would contribute toward the apparent increase in the heritability of the pro- duction index, in the face of a decrease in that of the production of survivors. One result of selection has been a decrease in mortality. The average pro- portions of birds dying for the two three-year periods mentioned previously are .35 and 22, the decrease being highly significant ( t = 4.77; d.f. = 4, P
<
.01).SELECTION I N POULTRY 705 heritability of the production index because the heritability of mortality is lower than that of the production of survivors.
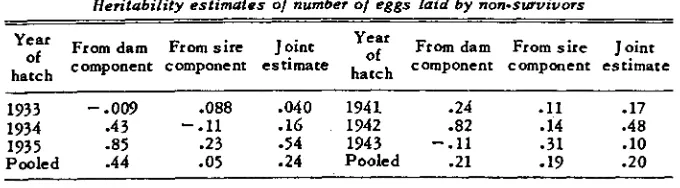
The heritability of the number of eggs laid by nonsurvivors, mentioned above, may appear to be something of a misnomer inasmuch as the dead birds cannot leave offspring. However the proportion of variance of this character attributable to genetic causes has a direct bearing on gains achieved by family selection. I t is possible to compute this heritability by variance analysis, just as heritability has been computed for the survivors’ production. I n either case the heritability would depend in part on the values of genetic and nongenetic correlations between rate of lay and survival. Thus a high nongenetic correla- tion between these two variables and a low genetic correlation could decrease the nongenetic variance in number of eggs laid within each of the two classes (survivors and nonsurvivors) without decreasing the genetic variance ; this would result in higher estimates of heritability. If the mortality were around
50 percent in the early years, such a positive bias in heritability estimates within the two classes would be relatively small ; as mortality decreased over the years the bias would be gradually lost in the increasing class of survivors
TABLE 7
Heritabifity estimates o/ number o/ eggs laid by non-survivors
Year From dam F r o m s i r e J o i n t
y:y
From dam F r o m s i r e J o i n t hatch of component component e s t i m a t e hatch component component e s t i m a t e-~ ~
1933
-.Om
.088 -040 1941 .24 .ll .I7.4 3 -.I1 . I 6 1942 .82 .I4 .48
-85 e23 -54 1943 -.I1 a 3 1 .10
1934
P o o l e d 1935 -44 -05 .24 P o o l e d .21
-
19 .20 but csnsiderably augmented in the decreasing class of nonsurvivors. Changes of this nature due to the shifting of individuals from one class to another would presumably have no direct effect on gains from selection, although the indirect effects previously discussed might be large.Estimates of the heritabilities of nonsurvivors are shown in table 7. I n view of the magnitude of their variation, none of the changes can be considered significant, although the difference from zero of the mean joint estimate (.22) is significant ( P = .035). The joint estimates for the two periods are nearly the same, but the estimate from the sire component has increased and that from the dam component has decreased. This would suggest a rise in the pro- portion of genetic variance that is additive, which is in line with the apparent trend of the heritability of the production index.
DISCUSSION A N D CONCLUSIONS
706 EVERETT R. DEMPSTER ET AL.
It has been previously shown that the reductions in both family and indi- vidual selection differentials have been very moderate amounting to about 17 percent for the former and 9 percent for the latter in the last half, as compared to the first half, of the selection prograin (LERNER and DEMPSTER 1951).
One obstacle to improvement, which might be expected on theoretical grounds, would be the development of a negative genetic correlation between two important components of the production ihdex, namely ability to survive the first year’s production and rate of lay. Three tests made of this point indi- cate that the genetic correlation between these components is probably p s i - tive. Two of them also suggest that the genetic correlation may have actually increased. These results cannot be considered conclusive, but at least no evi- dence was uncovered for a decreasing or negative genetic correlation between the variables involved.
An analysis of the relationship between reproductive fitness and first year production, extending one previously made (LERNER and DEMPSTER 1951), confirms the earlier conclusion that natural selection is not operating counter to artificial selection, and that there is no evidence indicating any change in the action of natural selection during the period covered.
The trend of heritability of the production index as estimated from the com- bined variance components due to sires and dams shows a small increase. This increase is due to the changes in the estimates from the sire component, the dam component showing a negligible decrease. Taken a t face value, these fig- ures would indicate not only that the heritability has not decreased (and m y
in fact have risen), but that it has become more additive, since nonadditive genetic variance is expected to produce a much larger maternal than paternal variance component. None of these trends, however, is statistically significant so they can be accepted only as contributory evidence.
The heritability of survivors’ production appears to have decreased mark- edly. The significance level of the regression coefficient, however, is only .%. The estimates both of heritability levels and of trends, based on sire and dam components separately, are very similar. This suggests that the genetic vari- ance of survivors’ production is largely additive in nature. If so, then the non- additive component of the genetic variance of the production index must be related to the contributions from mortality and, possibly, from the variance of the production of birds dying during the first year of production.
SELECTION I N POULTRY 707 itself, as discussed above, should greatly reduce the contribution of mortality to total variance, as well as the contribution of variation in egg number among nonsurvivors, and thus tend to equalize the heritabilities of the production index and of survivors, in accordance with the olkerved trends.
Little can be concluded concerning the trend of estimated heritabilities of nonsurvivors, except that the apparent increase in additivity is also consonant with the trends of production-index and survivors’-production heritabilities. The same can be said concerning the indications of a positive and perhaps increasing genetic correlation between rate of lay and age at death.
It thus seems that although the rate of gain may appear to have decreased, the evidence from the trend of the production indexes for successive years is rather slight and receives little corroboration from the detailed analyses. The only supporting subsidiary evidence is the probable decrease in the herita- bility of survivors’ production. This decrease, however, seems to be compatible with an increase in the heritability of the production index itself. Evidence against any marked decrease in rate of progress includes the lack of any marked reduction in selection differential, the absence of an adverse effect of natural selection, an apparently positive if not increasing genetic correlation between survival and rate of lay, an apparent increase and greater additivity of the heritability of the production index, a possible increase in the herita- bility of mortality, and a decrease in mortality together tvith a higher average heritability of survivors’ production as compared to that of viability. Although none of these lines of evidence are decisive when considered alone, taken to- gether they point to the improbability of any close approach to actual cessation of gains and suggest that response to selection may not be very different at the present stage of the breeding program than during the first few years of im- provement. Any tentative conclusion to this effect should be viewed in terms of the following conditions of this experiment : selection for a character that constitutes an important component of reproductive fitness, fairly strong selec- tion intensities (averaging more than one standard deviation for both family and individual selection), a relatively low heritability (averaging approxi- mately .10 for the production index, as indicated by half sister. correlations which should approximate the additive rather than the total heritability value), somewhat more than eight average generations of selection, and a computed average increase of homozygosity, based on inbreeding coefficients, of about 15 percent. LUSH (CRAFT et al. 1951) asks whether the dilemma of decreasing gains from selection in the presence of nearly the same amounts of genetic variability and the same type of selection pressures at the beginning as a t later stages of a breeding program really exists. As far as the present data are con- cerned, a negative answer to this question appears not improbable.
ADDENDUM
708 E V E R E T T
p.
D E M P S T E R ET AL.which the flock has not hitherto been exposed. The consequent drop in produc- tion was so severe as to preclude effective selection for egg number in these generations. The 1951 generation, completing its production year on September 30, 1952, however, bears out the favorable prognosis for further gains, which could be made on basis of this analysis. The production index of the part of the flock under management identical with the one described here, consisting of 324 birds, reached 231.3 eggs, a value exceeding the previous high point in figure 1.
S U M M A R Y
1. The production index (average number of eggs laid by all birds, sur- vivors and non-survivors, during the first year of lay) in the University of California production flock appears on the surface to have improved a t a decreasing rate during sixteen years of selection. However, the second degree regression coefficient is not statistically significant.
2. No adverse effect of natural selection on the gains realized is in evidence. 3. There is no indication of the development of a negative genetic correla- tion between rate of lay and ability to survive the first year of egg laying.
4.
The heritability of the production index seems to have increased and become more additive, although this cannot be established with statistical significance.5.
Although the heritability of the production of birds surviving the first laying year has probably decreased, the evidence on other components of the production index and their inter-relationships is consistent with a possible increase in the heritability of the latter.6. I t appears improbable that response to selection has ceased and possible that gains in relation to selection intensity may still be obtained a t approxi- mately the rate characteristic of the early years of the improvement program.
LITERATURE CITED
CRAFT, W. A., et el., 1951
LERNER, I. M., 1950 Population genetics and animal improvement. 342 pp. Cambridge LERNER, I. M. and D. M. CRUDEN, 1948 The heritability of accumulative monthly and LERNER, I. M. and E. R. DEMPSTER, 1951 Attenuation of genetic progress under con- LERNER, I. M. and C. A. GUNNS, 1952 Egg size and reproductive fitness. Poultry LUSH, J. L., 1945 Animal breeding plans. 443 pp., Collegiate Press, Ames, Iowa. LUSH, J. L., 'LV. F. LAMOREUX and L. N. HAZEL, 1948 The heritability of resistance MATHER, K., 1949
ROBERTSON, A. and I. M. LERNER, 1949 The heritability of all-or-none traits: viability of poultry. Genetics 54: 395-411.
TAYLOR, L. W., I. M. LERNER and K. B. DEOME, 1944 An effect of ration on mortality of laying hens. Poultry Sci. 23: 181-188.
Effectiveness of selection. J. Animal Sci. 10: 3-21. University Press, Cambridge, England.
annual egg production. Poultry Sci. 27: 67-78. tinued selection in poultry. Heredity 5: 75-94. Sci. 31: 537-544.
to death in the fowl. Poultry Sci. 27: 375-388.