ISSN: 2319-8753
I
nternational
J
ournal of
I
nnovative
R
esearch in
S
cience,
E
ngineering and
T
echnology
(An ISO 3297: 2007 Certified Organization)
Vol. 3, Issue 12, December 2014
Short Term Variability of the Thermal
Diffusivity and Thermal Conductivity for a
Porous Media
Carles M. Rubio
PhD Researcher, Dpt. Nanotechnology, Materials & Processes, Advanced Technology Centre Ascamm, Cerdanyola del
Valles. Spain
Dpt. Engineering Processing and Biotechnology, Polytechnic University of Catalonia, Castelldefels. Spain
ABSTRACT: Soil thermal property data, especially as a function of water content, are currently not readily available. Demand for these data is, however, on the increase because of improvements in wider applications of soil heat and water transport models, as well as, of the vegetal growth studies. Most of these investigations were focused in sandy soils, clayed soils or peat horticultural substrates, due to the different properties and applications of each ones. Otherwise, in order to partly fill the thermal soil properties studies into other types of soils, we focused this work in the relation between thermal and hydraulic soil properties of a silty soil under laboratory conditions. Samples were obtained from Can Solé Road located in the Llobregat delta plain (NE of Spain), where frequently Cynara scolymus is cultivated. Small dual-needle sensors, employing the heat pulse methodology were used to measure the soil thermal diffusivity, specific heat capacity and thermal conductivity. One soil column with a specific design was used. The column was monitorized to determine the volumetric water content and matric potential, as well as, the thermal properties. To obtain these kinds of data a frequency domain probe and micro-tensiometer were used. Preliminar results obtained up to now allow a rather complete understanding of the relation between thermal and hydraulic properties at laboratory scale of the silty soils. Preliminary distributed water content and thermal data allowed investigating the variability of these properties and its relations between them for this type of soils.
KEYWORDS:Thermal properties, water content, polynomial function, colum device.
I. INTRODUCTION
Quantity and mostly quality of soil physical data are required in many field and laboratory experiments. These dataset are used for developing, testing and applying soil thermal properties (thermal conductivity and diffusivity and volumetric specific heat capacity) and water transport models. Soil thermal properties are influenced, among other variables, mostly for particle size distribution, water content and bulk density. The particle size and its distribution have an effect on the manner in which the moisture is held [1]. Soil water content plays an important role in determining soil thermal properties, due the conduction through the soil is largely electrolytic [2], thus when the soil moisture increase, then the thermal conductivity rise, because water (thermal conductivity equal to 0.57 W·m-1·K-1) is a good conductor [3]. Frequently, the statement is made that thermal properties of soils at the same moisture content for different textural class is highest in sand, intermediate in loam and lowest in clay. In the assumption that the water has a thermal conductivity 30 times as large as that the air to be refilling the pore space, therefore the thickness and the geometric arrangement of the water layer around the particles that conducts the heat from one soil grain to the other will have a high influence upon the heat conductivity of the system.
ISSN: 2319-8753
I
nternational
J
ournal of
I
nnovative
R
esearch in
S
cience,
E
ngineering and
T
echnology
(An ISO 3297: 2007 Certified Organization)
Vol. 3, Issue 12, December 2014
In order to obtain accuracy and reliable in modelling results, a complete soil thermal properties dataset is needed. But sometimes, these dataset are incomplete. Looking for in the literature, can find that the most soil thermal properties experiences were performed using sand and clay textural class, also organic substrates (e.g. [5] [6] [7] [8]). Thus, the aim of our work is divided in two operative objectives; (i) to evaluate a new soil column design to allow analyze the soil thermal properties and (ii) to relate the soil thermal properties for a silt loam textural class with a water content gradient under experimental control conditions.
II. MATERIALSANDMETHODS
Sampling plot was located in Can Solé Road, sited in the Llobregat delta plain (Northeast of Spain), where frequently there are Cynara scolymus crops. The samples were obtained between top surface to 30 cm depth.
To characterize the soil of Can Solé Road the physical variables, particle size distribution (Psd), bulk density (BD), total organic carbon content (TOC), calcium carbonate content (CCC) and hygroscopic water content (Hw) were measured. Particle-size distribution was determined using the wetting sieve method for 2000 to 500 m, and a device by dispersion laser beams (Malvern Mastersizer/E) for particles smaller than 500 m. Bulk density and total porosity were determined from undisturbed sample volume. Total carbon content was analyzed by loss on ignition at 900ºC, and inorganic carbon content by loss on ignition at 200ºC, both using a Shimadzu SSM-5000A and solid sample module. These results we allowed calculate both contents TOC and CCC. Hygroscopic water content was determined by lost on weight after drying the samples at 105ºC during 24h.
Measurements of thermal-hydrodynamic properties were made on one soil column, constructed specifically for this experiment. Figure 1 shows the column one, which was developed in methacrylate component, with a inner slope of 3º allowing an enough drainage and to avoid the ponding processes in the device, and also a correct wetting process from the bottom of the column, which is connected to a separatory funnel (water deposit), that through the communicating vessel principle will allow both processes (drying and wetting) The lower levels of the column were refilled with gravel (40 to 80 mm diameter) and sand particle size (250 to 1000 m), both layers would allow to reach a necessary water level into the column and the homogeneity moisture of the sample, respectively. A separatory funnel provided a moderate matric potential gradient into the soil column, when was necessary to apply a suction gradient. Several sensors were placed for two different levels (a and b), allowing a control of two different moisture scenarios.
To determine the thermal properties one small dual-needle sensor (Decagon Devices Inc.) was employed. These kinds of sensors use the heat pulse methodology and yield reliable soil thermal diffusivity (D) and thermal conductivity (k) estimations, obtained by a non-linear least squares procedure during both processes (heating –eq. 1; and cooling –eq. 2), following the equations:
1 2
0
4
4
Dt
t
t
r
Ei
k
q
T
(1)
11 2 2
4
4
4
D
t
t
t
t
r
Ei
Dt
r
Ei
k
q
T
(2)Where, q is the rate of heat dissipation, k is the thermal conductivity, Ei is the exponential integral, r is the radius of the needle, D is the thermal diffusivity and t is time. Thermal properties were determined by fitting the time series temperature data during the heating and cooling processes of the dual needle.
ISSN: 2319-8753
I
nternational
J
ournal of
I
nnovative
R
esearch in
S
cience,
E
ngineering and
T
echnology
(An ISO 3297: 2007 Certified Organization)
Vol. 3, Issue 12, December 2014
for two different levels (a and b). A Campbell Scientific CR-850 and Decagon Devices EM-50 data-loggers were required to collect the data. The observed [()] data were fitted using van Genuchten equation [9].
Fig. 1. Side view and top view of the soil column scheme used to determine the soil thermal properties as a function of water content.
III.RESULTSANDDISCUSSION
The studied soil from Can Solé Road was classified as silt loam textural class according to USDA, with a particle size distribution for silt content always higher than 60%, mean sand content about 34%, and mean clay content about 4%. Mean bulk density is 1.47 g·cm-3 and total porosity 45%. Mean total organic carbon content was about 3.1%, mean calcium carbonate content was 40.3%.
Soil water retention curve (Figure 2) was obtained fitting the observed data to the Van Genuchten model. For these, the RETC code [10] was performed, thus obtaining the hydraulic parameters of the model (s, and N). For r parameter the mean HW value (in cm3·cm-3) was used. Water retention curve showed a volumetric water content close to saturation about 0.46 cm3·cm-3. The values of water content at field capacity and at permanent wilting point were 0.25 and 0.06 cm3·cm-3 respectively. The van Genuchten model fitted acceptably the estimated water retention data to observed data with r 0.98 and p≤ 0.01. Estimated water content values are in the range of the found in the literature
for these types of soils [11] [12] [13].
Fig. 2. Estimate soil water characteristic curve for the studied silty loam soil.
Fig. 3. Soil wetting process and temperature cicle for the studied soil.
drainage
h
WC probe EC-5a
Sample
Sand level
Gravel level
WC probe EC-5b WP T5b
WP T5a Thermal sensor
WP gauging
α= 60Ί 24 mm
SH-1
WC pr
obe
Tensiom eter 30 m
m
Side Top
drainage
h
WC probe EC-5a
Sample
Sand level
Gravel level
WC probe EC-5b WP T5b
WP T5a Thermal sensor
WP gauging
α= 60Ί 24 mm
SH-1
WC pr
obe
Tensiom eter 30 m
m
α= 60Ί 24 mm
SH-1
WC pr
obe
Tensiom eter 30 m
m Side Top 0 5 10 15 20 25 T e m p e ra tu re ( ºC ) 0 0.1 0.2 0.3 0.4 0.5 ( m 3·m -3)
0 40 80 120 160 200 240 280 320 360 400 440 Time (hours)
Moisture and Temperature Curves
EC5a EC5b Temperature 0 0.1 0.2 0.3 0.4 0.5 ( m 3·m -3)
200 400 600 800 1000 1200 1400 1600
ISSN: 2319-8753
I
nternational
J
ournal of
I
nnovative
R
esearch in
S
cience,
E
ngineering and
T
echnology
(An ISO 3297: 2007 Certified Organization)
Vol. 3, Issue 12, December 2014
Soil wetting curves are presented in Figure 3. The two curves showed a well-defined wetting process that was determined by the two EC-5 probes. The capillarity rise between the a and b points (12 cm long) were spent 40 hours, with differences in the water content between a and b levels, when the probe a (upper level) started to increase the moisture values (from 0 initial) about 35%. These differences decreased to 20% when the probe b (lower level) reached at saturation, and then reaching both levels the near steady-state conditions. In this point, the observed matric potential data was -1.41 kPa for level a, and close to 0 kPa for level b.
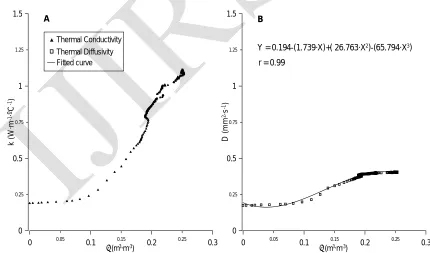
Figure 4, shows the influence of water content in the thermal properties for a silty loam soil. Thermal conductivity (Fig. 3A) and thermal diffusivity (Fig. 3B) have been plotted versus volumetric water content, just that these two porperties were directly observed data. Whereas, thermal resistivity was calculated as a inverse of thermal conductivity and volumetric specific heat as a function of k and D. For this reason its have not been showed here.
In Figure 4A, can observe that for a silt loam soil the k showed a gradual increase insofar water content increased [14], presenting a strong reaction when soil moisture was over 20% vol·vol-1, therefore, the greatest increase in k occurs in the wetting range. Similar results were showed by Al Nakshabandi and Kohnke [1] with the same type of soil textural class. Another interesting fact was that, both thermal properties (k and D) showed a nearby steady-state scenario when the volumetric water content was close to 25% vol·vol-1.
Figure 4B, shows the thermal diffusivity and its relation with soil water content. Thermal diffusivity showed a similar behaviour than thermal conductivity, both due to severe vapour transfer before to react with high soil moisture, i.e. the fast increase of the D values between 10% and 20% vol·vol-1 of water content.
The D property as a direct observe data, presented an excellent relationship with volumetric water content. To fit the curve, to the observed data, a third degree polynomial was used. Estimated data fitted very acceptably to observed data, with r 0.99 for p≤ 0.01. Thus, the thermal diffusivity could be an optimum water content predictor based on a fast, economic and accurate thermal property measurement as is the thermal diffusivity.
Fig. 4. A: Relation between soil thermal conductivity (k) and volumetric water content. B: Relation between soil thermal diffusivity (D) and volumetric water content, and fitted curve.
r = 0.99
B A
0 0.5 1 1.5
0.25 0.75 1.25
D
(
m
m
2·s -1)
0 0.5 1 1.5
0.25 0.75 1.25
k
(
W
·m
-1·º
C
-1)
0 0.05 0.1 0.15 0.2 0.25 0.3
(m3·m-3)
0 0.05 0.1 0.15 0.2 0.25 0.3
(m3·m-3)
Y = 0.194-(1.739·X)+( 26.763·X2)-(65.794·X3)
ISSN: 2319-8753
I
nternational
J
ournal of
I
nnovative
R
esearch in
S
cience,
E
ngineering and
T
echnology
(An ISO 3297: 2007 Certified Organization)
Vol. 3, Issue 12, December 2014
IV.CONCLUSIONS
As a summary of theses preliminary results, silty loam soil presented a well-defined wetting process, yielding a well gauge for the thermal and hydrodynamic data collected. A slow capillary rise in the porous media favoured a not collapse of the porosity by the air-entry, and therefore a direct contact between the thermal sensors and soil. Thermal properties showed a well realtionship with water content, being directly proportional the increase of water content values with the increase of the measured thermal conductivity and diffusivity. Thermal diffusivity data fitted well to a third degree polynomial curve, and therefore could be a good predictor for the soil moisture, eventhough still need a further research.
REFERENCES
[1] Singh, D.N., Devid, K., “Generalized relationships for estimating soil thermal resistivity”. Experimental Thermal and Fluid Sci., 22: 133-143, 2000.
[2] Van Rooyen, M., Winterkorn, H.F., “Theoretical and practical aspects of the thermal conductivity of soils and similar granular systems”. US Highway research Board, Bulletin 159: 58-135, 1957.
[3] DeVries, D.A., “Thermal properties of soils”. In: W.R. van Wijk (Editor), Physics of plant environment. North-Holland Publishing Co., Amsterdam, pp. 210-235, 1963.
[4] Al Nakshabandi, G., Kohnke, H., “Termal conductivity and diffusivity of soils as related to moisture tension and other physical properties”. Agricultural Meteorology, 2: 271-279, 1965.
[5] Hadas, A., “Evaluation of the block method for determining the thermal properties of the top soil”. Agricultural Meteorology, 11: 269-276, 1973.
[6] Felipo Oriol, M.T., De Boodt, M., Verdonck, O., Cappaert, I., “Thermal properties of two organic (peat, pine bark) and two inorganic (perlite, clay) horticultural substrates”. Catena, 5: 389-394. 1978.
[7] Bristow, K.L., Kluitenberg, G.J., Goding C.J., Fitzgerald, T.S., “A small multi-needle probe for measuring soil thermal properties, water content and electrical conductivity”. Computers and Electronics in Agriculture, 31: 265-280, 2001.
[8] Abu-Hamdeh, N.H., “Thermal properties of soils as affected by density and water content”. Biosystems Engineering, 86(1):97-102, 2003. [9] Van Genuchten, M.Th., “A closed-form equation for predicting the hydraulic conductivity of unsaturated soils”. Soil Science Society of
America J. 44: 892-898, 1980.
[10] Van Genuchten, M.Th., Leij, F.J., Yates, S.R., “The RETC code for quantifying the hydraulic functions of unsaturated soils”. EPA/600/2-91/065. U.S. Environmental Protection Agency. Ada. OK. USA, pp. 85, 1991.
[11] Cameron, D.R., “Variability of soil water retention curves and predicted hydraulic conductivities on a small plot”. Soil Science, Vol 126, 6: 364-371, 1978.
[12] Gupta, S.C., Larson, W.E., “Estimating soil water characteristic from particle size distribution, organic matter percent, and bulk density”. Water Resour. Res., 15: 1633-1635, 1979.