ABSTRACT
ELLINGTON, JAMES KEMP. Systematic Sources of Variance in Supervisory Job Performance Ratings: A Multilevel Analysis of Between-Rater and Between-Context Variance. (Under the direction of Mark A. Wilson.)
thorough investigation of the relationships of interest here. Results suggested that the rating context accounted for significant variance in both task and citizenship performance ratings. Furthermore, the rater tendency for leniency explained significant between-rater variation in both criteria. The rater tendency for halo was also significant, however this finding did not recur when analyzing a replication sample of data. At the context-level, the norm for leniency consistently predicted variance in citizenship performance, but was only a
SYSTEMATIC SOURCES OF VARIANCE IN SUPERVISORY JOB PERFORMANCE RATINGS: A MULTILEVEL ANALYSIS OF
BETWEEN-RATER AND BETWEEN-CONTEXT VARIANCE
by
JAMES KEMP ELLINGTON
A dissertation submitted to the Graduate Faculty of North Carolina State University
in partial fulfillment of the requirements for the Degree of
Doctor of Philosophy
PSYCHOLOGY
Raleigh, North Carolina 2006
APPROVED BY:
Donald W. Drewes Adam W. Meade
Lori Foster Thompson Mark A. Wilson
BIOGRAPHY
ACKNOWLEDGMENTS
I would like to acknowledge the following people who have contributed to the completion of this project. First and foremost I would like to thank my parents, James and Elizabeth Ellington. Through the course of graduate school they were always encouraging, motivating me to continue despite various instances of frustration. Thank you both for all of your love and support, I could not have done this without you.
I would also like to thank my advisor, Dr. Mark A. Wilson for all of his support and advice. Thanks for your willingness to meet and discuss various issues with my dissertation, often on very short notice, and thanks for having such a good sense of humor. I would also like to thank the other members of my doctoral committee for all of their guidance and encouragement: Dr. Donald W. Drewes, Dr. Adam W. Meade, and Dr. Lori Foster Thompson. Furthermore, I would like to thank Dr. Shevaun D. Neupert for her excellent advice regarding my statistical analyses.
I would like to thank several members of the law enforcement agency involved in this study, for allowing this research to be undertaken. All of the sworn and civilian personnel I worked with were extremely cooperative and encouraging with respect to this research. I would like to specifically thank Dr. Deanna Putney, Major Walter J. Wilson, Jr., and Captain Wellington R. Scott for all of their advice, cooperation, understanding, and friendship.
Finally, I would like to thank several of my fellow graduate students, for their
TABLE OF CONTENTS
LIST OF TABLES... vi
LIST OF FIGURES ... vii
INTRODUCTION ... 1
Performance Appraisal Models... 3
Multidimensional Performance Domain... 6
Proposed Conceptual Models ... 7
Between-Rater Model... 9
Between-Context Model... 11
Research Questions and Hypotheses ... 16
METHOD ... 18
Participants... 18
Operationalization of Study Variables... 19
Job performance... 19
Tendency for leniency... 20
Tendency for halo... 21
Opportunity to observe performance... 22
Nature of work/activity... 22
Procedure ... 23
Analyses... 24
Exploratory factor analyses... 25
Multilevel modeling... 26
RESULTS ... 30
Exploratory factor analyses... 30
Principal component analyses.... 33
Multilevel modeling... 33
DISCUSSION ... 38
Main Findings ... 38
Limitations ... 41
Implications... 44
Future Research ... 45
Summary ... 46
REFERENCES ... 48
APPENDICES ... 63
Appendix A... 64
LIST OF TABLES
Table 1. Dimensions of job performance for the rank of Trooper... 54
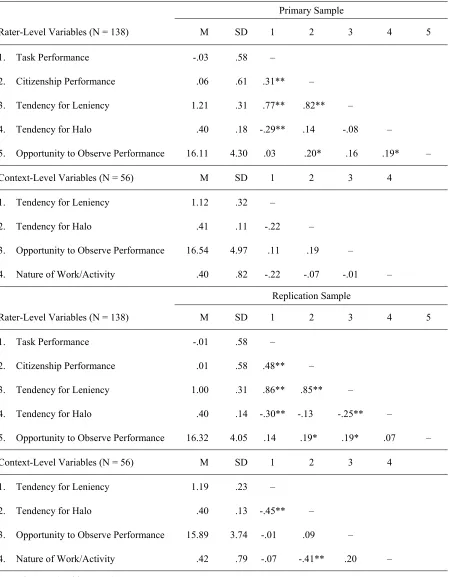
Table 2. Descriptive statistics and zero-order correlations for all variables... 55
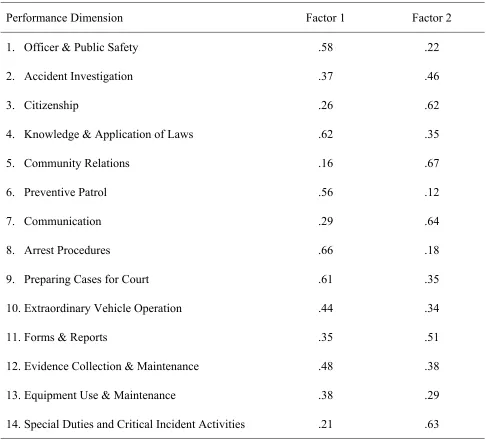
Table 3. Rotated factor pattern for exploratory factor analysis of the primary sample... 56
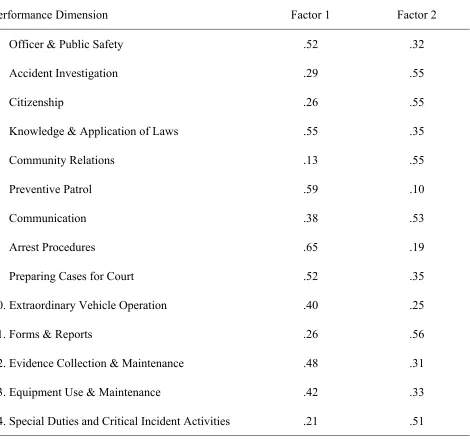
Table 4. Rotated factor pattern for exploratory factor analysis of the replication sample... 57
Table 5. Random-coefficient regression model results for task/citizenship performance... 58
LIST OF FIGURES
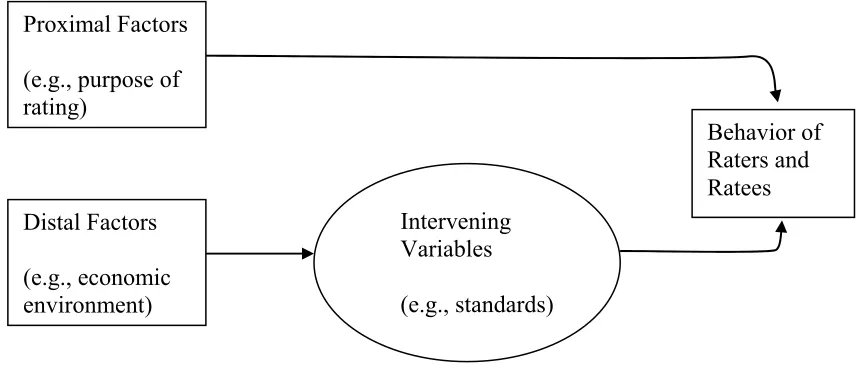
Figure 1. Murphy and Cleveland’s (1995) effects of proximal versus distal context factors 60
Figure 2. Proposed conceptual model of between-rater variance... 61
INTRODUCTION
Systematic Sources of Variance in Supervisory Job Performance Ratings: A Multilevel Analysis of Between-Rater and Between-Context Variance Job performance has been referred to as, “Perhaps the most important dependent variable in industrial and organizational psychology” (Borman, 2004, p. 238). The appraisal of performance plays an integral role in both organizational research and the practice of human resource management. Practitioners appraise performance in order to inform administrative decisions, evaluate selection and training programs, and develop employees by providing valuable job-related feedback. Researchers are continually attempting to predict job performance, and often include it as a key construct in numerous theories describing various organizational phenomena. Given the importance of appraising
performance for so many critical functions, special attention must be paid to the method by which it is measured. “Although job performance has been measured in many ways (e.g., volume of sales, quantity or quality of items produced, absences, number of promotions), the most frequently used measure is a supervisory performance rating” (Scullen et al., 2000, p. 956). Unfortunately, the subjective nature of ratings renders this form of measurement especially vulnerable to various systematic influences, other than the actual performance of the ratee. Therefore, in order to better understand and improve performance ratings, it is necessary to recognize the factors which impact rater behaviors.
quite large. Scullen et al. (2000) examined the latent structure of performance ratings, using two large samples of multisource ratings collected for developmental purposes. The variance in each sample was partitioned into five components: the variance associated with the ratee’s general level of performance, performance on a specific dimension, the rater’s idiosyncratic rating tendencies, the rater’s perspective, and random measurement error (Scullen et al., 2000). Results indicated that, “idiosyncratic variance was the largest component of variance for all combinations of rater perspective and performance dimension” (Scullen et al., 2000, p. 966). With regard to supervisor ratings specifically, 51% of the variance was idiosyncratic to the rater in one sample, and 43% in the second (Scullen et al., 2000). While these results are very informative with regard to the amount of variance in ratings associated with the rater, additional research is needed in order to provide insight into the nature of these idiosyncratic effects.
Consequently, the purpose of this research was to contribute to our understanding of supervisory ratings by decomposing the variance due to specific sources, but also by
recommended based on previous theory and research, to provide a more thorough examination of sources of variance in ratings. Conceptual models are presented, and a multilevel analytical approach is recommended for testing the relationships in the models. Finally, research questions and hypotheses are presented for investigation in a sample of performance ratings collected in a large law enforcement agency.
Performance Appraisal Models
Prior to 1980, the majority of performance appraisal research focused on the psychometric properties of various types of rating scales, in addition to rater training for reducing errors and improving observation (Ilgen, Barnes-Farrell, & McKellin, 1993). However, several models published in the late 1970s and early 1980s shifted the focus to the cognitive processes involved in evaluating performance (DeCotiis & Petit, 1978; Landy & Farr, 1980; Wherry & Bartlett, 1982). Although these models were all unique in their own way, the primary concern in each was the processing of information by raters. For example, Wherry and Bartlett (1982) suggested that accurate ratings are a function of three major factors: performance of the ratee, observation of that performance by the rater, and recall of those observations by the rater. Rater biases were purported to influence both the
observation and recall of performance, and to consist of a true component, an “areal” bias component (i.e., associated with particular dimensions of performance), and an overall bias component (i.e., general impression). Moreover, 46 theorems and their corresponding corollaries were proposed, aimed at maximizing the true performance component and
While the initial growth of cognitive research in performance appraisal has been credited to these previous models, much of the later research in this area was stimulated as a result of theories proposed by Ilgen and Feldman (1983) and DeNisi et al. (1984). These authors emphasized the importance of the rater’s capacity to evaluate, and focused
subsequent research on four major processes, summarized by Murphy and Cleveland (1995) as: information acquisition, encoding and mental representation, storage and retrieval of information, and the integration of different pieces or types of information. Ilgen et al. (1993) reviewed the empirical research conducted on the appraisal process during the 1980s, and noted several major contributions of this approach, such as a greater appreciation for the importance of observation in appraisals, and the correction of the commonly held assumption that rater errors were evidence of rating inaccuracy. However, these authors also noted the limited amount of variance accounted for by cognitive processes, suggesting that “this body of research has reached a point of diminishing returns” (Ilgen et al., 1993, p. 362).
Furthermore, Ilgen et al. (1993) went on to recommend a shift in focus toward work group and organizational factors, the design of appraisal systems, and “content” rather than process variables.
the performance judgment, the performance rating, and the evaluation of the appraisal system (Murphy & Cleveland, 1995). Murphy and Cleveland (1995) referred to context as “a
complex set of variables that exist in the immediate and distal environment” (p. 407). Contextual variables suggested to be of influence in appraisal were therefore categorized as either proximal or distal variables. Proximal variables were defined as those that “directly impinge upon or influence the rater,” and distal variables as the “intra- and
extraorganizational characteristics that influence judgments, ratings, and assessments
indirectly” (Murphy & Cleveland, 1995, p. 20). Examples of proximal variables include the rating purpose, interaction between the supervisor and employee, and the nature of the rated task. Distal variables include characteristics such as the organizational structure, climate, and values, and were proposed to impact rater behaviors indirectly through intervening variables such as performance standards, performance dimensions, and the consequences of high versus low ratings (Murphy & Cleveland, 1995). Figure 1 presents a reproduction of Murphy and Cleveland’s (1995) model depicting the effects of proximal versus distal context factors.
Mero, Motowidlo, & Anna, 2003), appraisal reactions (Keeping & Levy, 2000), feedback culture (London & Smither, 2002), appraisal purpose (e.g., Jawahar & Williams, 1997), rater training (e.g., Noonan & Sulsky, 2001), and numerous other topics. Nonetheless, the extent to which the rating environment influences rater behaviors is unclear. In other words, of the large percentage of variance that seems to be idiosyncratic to raters (Scullen et al., 2000), what proportion is due to contextual influences? Furthermore, what contextual
characteristics explain this between-context variation?
Multidimensional Performance Domain
Job performance is regarded by many researchers as being multidimensional and complex (e.g., Austin & Villanova, 1992; Borman & Motowidlo, 1993; Campbell, 1992). Borman and Motowidlo (1993) suggested that the domain of organizational behavior includes not only task activities, but also contextual or citizenship activities such as
volunteering, helping, and endorsing organizational objectives. Citizenship performance is defined as, “behaviors that are not directly related to the main task activities but are
important because they support the organizational, social, and psychological context that serves as the critical catalyst for tasks to be accomplished” (Borman, 2004, p. 238).
Furthermore, the rating context may have a greater influence on ratings of one of these types of performance over the other. Borman (2004) noted that, “Task activities are typically different for different jobs, whereas citizenship activities are similar across jobs” (p. 238). Therefore, it could also be that the importance (i.e., significance for successful job
performance) of task behaviors varies across even similar work contexts, but perhaps citizenship performance behaviors are more equally important from context to context. If this were the case one might expect to see greater between-context variance in task
performance than citizenship performance. Therefore, in order to better understand appraisal ratings, research investigating sources of variance should examine both types of
performance.
Proposed Conceptual Models
supervisor who produced it, and the context in which it was produced. Analytic approaches that assume observations are independent (e.g., ordinary least squares regression) can lead to erroneous conclusions if there are indeed dependencies in the data. Multilevel models, or hierarchical linear models (HLM), address these issues by explicitly and simultaneously modeling both within and between-group variance (Bryk & Raudenbush, 1992; Hofmann, 1997).
Consequently, this research incorporates a multilevel approach in order to decompose the variance in supervisory task and citizenship performance ratings into two portions: between-rater (within context) and between-context variance. For the purposes of this study, the focus is not on examining between-ratee variance (i.e., ratings were averaged for each supervisor), but rather investigating the relative amounts of variance between raters (level-1) and contexts (level-2), along with the characteristics that explain this variation. The
following sections describe proposed conceptual models at each of these two levels of interest. More specifically, a level-1 model presents a set of predictors that are proposed to explain between-rater variance in performance ratings, and a level-2 model suggests
predictors of the between-context variance. The variables of interest here are derived from empirical research in addition to the previously reviewed models of performance appraisal, but are not meant to represent all of the possible influential rater and contextual
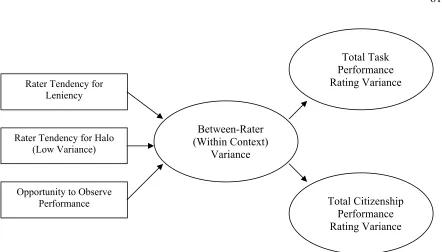
Between-Rater Model. Figure 2 presents a graphical depiction of the proposed
between-rater model. Several rater-level characteristics are likely to explain variation in performance ratings across raters. First of all, the idiosyncratic tendencies of the individual raters such as leniency and halo are likely sources of variance (Scullen et al., 2000).
Leniency refers to “the tendency to give all employees good ratings,” and halo refers to “the failure to discriminate the performance of one individual employee across the different performance dimensions” (Hauenstein, 1998, p. 415). With regard to leniency, Scullen noted that “raters may exhibit a different degree of leniency” (2000, p. 957), thereby introducing an element of variability in “nested” designs. Moreover, raters may also exhibit different degrees of halo. Previous research has indicated that as raters become more familiar with ratees, halo tends to increase (Jacobs & Kozlowski, 1985). Therefore, to the extent that raters vary in familiarity with their respective ratees, raters may correspondingly vary in their tendency for halo. Measures of both leniency and halo have been criticized for their use as criteria indicative of rating accuracy (Balzer & Sulsky, 1992; Murphy & Balzer, 1989),
operationalized) will account for differing amounts of between-rater variance in ratings on these two types of criteria.
Another rater-level predictor of interest for the research proposed here concerns the rater’s opportunity to observe job performance. The importance of the opportunity to observe pertinent incidents of job behavior has been cited in all of the previously discussed models (DeCotiis & Petit, 1978; DeNisi et al., 1984; Ilgen & Feldman, 1983; Landy & Farr, 1980; Murphy & Cleveland, 1995; Wherry & Bartlett, 1982). Murphy and Cleveland (1995) review several barriers to observation which can inhibit opportunities to observe. For
example, demands on supervisors’ time, proximity to subordinates, knowledge of the results of behaviors, and relevance of observations can all vary across supervisors within an
organization, and therefore create differential opportunities to observe performance. Wherry and Bartlett (1982) proposed that, “ Raters will vary in the accuracy of ratings given in direct proportion to the number of previous relevant contacts with the ratee” (p. 532). With regard to empirical evidence, Ilgen et al. (1993) cited two studies indicating positive relationships between measures of rating accuracy and both the amount of time spent observing (Favero & Ilgen, 1989) and the amount of performance observed (Heneman & Wexley, 1983).
observed (Bernardin & Beatty, 1984; Bernardin & Buckley, 1981; Guion, 1965; Hauenstein, 1998; Wherry & Bartlett, 1982). Raters maintaining behavioral diaries or incident files, as they are often called, have been demonstrated to exhibit lower leniency and halo in ratings, and higher interrater agreement as compared to raters who were not documenting
observations (Bernardin & Walter, 1977). Furthermore, raters using structured diary keeping (along with structured recall) have been shown to be better able to discriminate between and within ratees (DeNisi & Peters, 1996). However, it is unclear whether the amount of
observations documented influences a rater’s behavior. In an organization in which such documentation is a formal aspect of the performance management system, it is reasonable to expect that the number of observations documented reflects the opportunity to observe performance. In other words, raters with greater opportunity, should record a higher number of behavioral observations. If this is the case, one would expect that the average number of behaviors documented for each rater will explain rating variation across raters, for both task and citizenship performance.
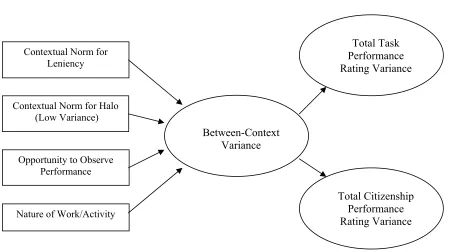
Between-Context Model. Figure 3 presents a graphical depiction of the proposed
between-context model. When referring to the “context of appraisal” several units of analysis may be of influence (Murphy & Cleveland, 1995). Both inter- and
branch versus main bank offices on job satisfaction, organizational commitment, and job involvement (Clinebell & Shadwick, 2005). In addition, with respect to performance ratings, other research has indicated a strong relationship between unit (i.e., class) climate and
student ratings of instructor performance (Murphy et al., 2003). The performance ratings in this study were collected in a large statewide law enforcement organization, broken up into numerous “districts.” Each district, or context, has its own office and is geographically or functionally distinct from the others. Therefore, in this research, the focus is the proportion of variance in supervisor ratings associated with the context in which they work, along with specific characteristics of those contexts.
In addition to the importance of rater tendencies for leniency and halo, these same concepts may be influential at the context level as well. In this case, both leniency and halo may represent norms or standards for evaluating performance in each context. In other words, despite rater training, different norms or standards for “acceptable” performance may develop, creating between-context variation. DeCotiis and Petit (1978) and Murphy and Cleveland (1995) cite the importance of performance standards in evaluation, with the latter referring to standards as intervening variables between distal factors in the environment and rater behaviors (refer again to Figure 1). Even when dealing with a single organization, if units or districts are distinct as is the case here, it is likely that norms determining what behaviors constitute poor, average, or excellent performance will impact the ratings provided by the supervisors working in those contexts. Murphy and Cleveland (1995) review research on norms suggesting that four mechanisms are likely to influence the development of
experience, and extension of values, attitudes, and beliefs from other domains. Given the geographical or functional distinction of contexts within a large organization, each of these four may serve to create diverse standards across contexts. With respect to leniency, a greater distance between the average rating and scale midpoint for a given context versus another may be indicative of a different standard. Furthermore, halo (i.e., low variance in ratings) at the context level may represent a norm for letting general impressions guide ratings, and thereby failing to discriminate between dimensions of performance. For example, if leadership in a particular district implicitly or explicitly suggests that “hard workers” get all high ratings, or conversely that “lazy people” get all poor or average ratings (regardless of actual variation in performance across dimensions), a norm of low variance may then develop among supervisors in such a context. Both leniency and halo at the context level could also differentially impact task versus citizenship performance ratings. For example, if standards for one type of performance versus another vary across contexts, then the contextual norm for leniency may vary in its impact on ratings across the two criteria. In addition, the norm for failing to discriminate among more specific dimensions of performance may show a stronger relationship for task or citizenship performance.
they may be forced to rely more on the consequences of behaviors (i.e., knowledge of
results), or second-hand information. Furthermore, within a large organization, contexts such as offices or units could be expected to differ in the proximity of raters to ratees. In some cases, supervisors work directly with their subordinates, and in others there may be much less direct interaction. Wherry and Bartlett (1982) proposed that supervisors working in close proximity with their employees would provide more accurate ratings. Therefore, as intra-organizational contexts vary in these barriers, they would correspondingly vary in the opportunities for the raters in those contexts to observe their respective ratees performance. In districts with less opportunity, one could expect a fewer number of behavioral
observations documented by the supervisors in that district. Consequently, the average number of observations documented within contexts, should predict between-context variance in task and citizenship performance ratings.
The final predictor of interest at the context level concerns the nature of the work or activity itself across contexts. Even in a single organization, with individuals holding the same basic job title, the importance of the various behaviors required to perform one’s job is likely to vary from one context to the next. Both environmental factors along with the
vary across these contexts due to these environmental factors. Furthermore, the significance of various behaviors would also be different in a unit whose function is training, versus a unit in special operations. The nature of work across contexts may also differentially impact task and citizenship performance. As mentioned previously, task activities are expected to differ across jobs, while citizenship behaviors should be more similar (Borman, 2004). However, even when individuals hold the same basic job, contextual variation in the requirement for certain behaviors should also lead to differences in task performance across contexts, whereas citizenship performance should be more constant. In the organization of interest here, three contextual variables in particular were expected to differ across districts: number of accidents investigated, number of cases made (i.e., the number of cases brought to court), and the number of calls for service. These three contextual variables reflect not only the population density and presence of a major interstate (or lack thereof), but also the function of each district. Therefore, it is expected that within context variation in these three variables will predict between-context variation in ratings.
Wexley, 1983) have stressed the importance of the opportunity to observe performance, but the degree to which rater observation opportunities explain between-rater differences in ratings is unknown. Recent models (Murphy & Cleveland, 1995) and calls for research (Levy & Williams, 2004) have appealed for a more explicit incorporation of appraisal context in research, nevertheless the extent to which context is impacting idiosyncratic rater variance also remains to be investigated. Partitioning this variance due to context then allows for an analysis of contextual characteristics likely to explain between-context
differences in ratings. Given the importance of performance standards or norms (DeCotiis & Petit, 1978; Murphy & Cleveland, 1995), it would be informative to examine context-level leniency and halo in their prediction of variance across work contexts. In addition, it would also be useful to know the extent to which opportunities to observe performance and the nature of work explain rating differences from context to context. Finally, all the
aforementioned relationships should be investigated with respect to the multidimensional nature of job performance. Both theory (Borman & Motowidlo, 1993) and research
(Motowidlo & Van Scotter, 1994) suggest that task and citizenship performance are distinct, therefore studying both of these broad types of job behavior should provide a more thorough investigation of the relationships of interest here.
Research Questions and Hypotheses
With these issues in mind, the purpose of this research was to explore the
performance criteria. Ratee task and citizenship performance ratings (operationalization described in Method section) were averaged for each rater, as ratee level performance was not the focus of this study. Staged multilevel analyses were conducted on each set of criterion scores, in order to address the following questions and hypotheses. First, what proportion of the variance in task and citizenship performance resides between raters (within contexts), and what proportion resides between-contexts? Although no prediction was made with respect to the relative amounts of variance, it was predicted that a statistically
significant amount of variance would reside between-contexts for both task (H1) and
citizenship performance (H2).
Second, what rater-level characteristics are predictive of the between-rater variance in task and citizenship performance? It was predicted that the rater tendency for leniency would explain a significant amount of between-rater variance in both task (H3) and citizenship
performance (H4). In addition, the rater tendency for halo was predicted to explain a
significant amount of between-rater variance in task (H5) and citizenship performance (H6).
The final rater-level variable included was the rater opportunity to observe performance, which was also expected to explain a significant amount of between-rater variance in task (H7) and citizenship performance (H8).
Based on confirmation of the initial hypotheses regarding between-context variation (i.e., H1 and H2), analyses also examined the context-level model depicted in Figure 3 in
variance in both task (H9) and citizenship performance (H10). Furthermore, the contextual
norm for halo was predicted to explain a significant amount of between-context variance in task (H11) and citizenship performance (H12). The opportunity to observe performance at
the context-level was also expected to explain a significant amount of between-context variance in task (H13) and citizenship performance (H14). Finally, the nature of
work/activity in each context was predicted to explain a significant amount of between-context variance in both task (H15) and citizenship performance (H16).
METHOD
Participants
Ratings collected from sworn members of a large southeastern state law enforcement agency served as data for this research. Data collected as part of the agency’s annual
performance management process provided both a primary and replication sample. In the primary sample (data collected in 2003 and 2004), 153 supervisors from 58 districts (i.e., contexts) evaluated the performance of 1,078 subordinates. After removing cases with missing data (i.e., criterion data could not be derived unless an individual was rated on all 14 performance dimensions), a final primary sample of 138 supervisors from 56 districts was retained for analysis. The number of ratees per supervisor ranged from 1 to 21 (M = 7.00, SD
= 3.57), and the number of supervisors per district ranged from 1 to 11 (M = 2.68, SD =
In the replication sample (data collected in 2004 and 2005), 166 supervisors from 58 districts evaluated the performance of 1,089 subordinates. After removing cases with missing data, a final replication sample of 138 supervisors from 56 districts was retained for analysis. The number of ratees per supervisor ranged from 1 to 22 (M = 7.00, SD = 3.56),
and the number of supervisors per district ranged from 1 to 6 (M = 2.46, SD = 0.97). In the
majority of cases the supervisor held the rank of Sergeant (83%) or First Sergeant (12%), with a smaller number of ratings being provided by Lieutenants (5%). Similar to the primary sample, the supervisors in the replication sample were 86% Caucasian, 14% African
American, 98% male, and 2% female.
Operationalization of Study Variables
Job performance. A job analysis conducted in the agency of interest identified 14
dimensions of job performance relevant for the rank of Trooper (see Table 1). These 14 dimensions are incorporated into the performance management process, with supervisors documenting behavioral observations on these dimensions of performance, and providing ratings in the organization’s annual evaluation process. Performance dimensions are rated on a scale ranging from 1 = excellent, to 7 = well below average, which was reverse coded in order to ease the interpretation of results. See Appendix A for a copy of the organization’s performance appraisal form. In order to operationalize task and citizenship performance, the ratings on these 14 dimensions were subject to exploratory factor analysis (described further in Analyses section), in order to derive factor scores describing each ratee’s standing on these
Tendency for leniency. Leniency was measured by first calculating the distance
between the average rating (across dimensions) and scale midpoint (i.e., “4”) for each ratee (Barrett, 1966; Bernardin, 1977). Therefore, larger values are suggested to indicate greater leniency. These values were then averaged for each rater to represent the rater-level
Tendency for halo. Halo was operationalized as the variance in the ratings across
performance dimensions for each ratee (Bernardin, 1977; Bernardin & Pence, 1980; Borman, 1975). Therefore, smaller values are suggested to be indicative of greater halo. These values were then averaged for each rater to represent the rater tendency for halo. Although all of the common operationalizations of halo have been criticized as being insufficient measures (Balzer & Sulsky, 1992), the variance measure employed here was chosen because it has been frequently used (Murphy & Cleveland, 1995), but more importantly because it was deemed the most well suited to the data being analyzed in this research. More specifically, other common measures of halo (e.g., intercorrelations among dimension ratings, percentage of variance accounted for by the first principal component, etc.) would require a larger number of ratees per rater to calculate. In the data analyzed here, some supervisors only rated a small number of ratees. Furthermore, previous research has shown the variance measure of halo incorporated here to be consistent over time with the three other most common measures (Jacobs & Kozlowski, 1985). The context-level norm for halo was
calculated in a similar manner (i.e., halo values were averaged for each context), however the previous year’s performance ratings were used to operationalize contextual halo. In the primary sample rater-level halo was calculated using the 2004 ratings, and context-level halo was calculated using the 2003 ratings. In the replication sample, rater-level halo was
Opportunity to observe performance. Each supervisor documented behavioral
observations of performance for each of his/her respective ratees. The opportunity to observe job performance at the rater-level was operationalized as the average number of these
behavioral observations documented by each rater. Therefore, larger numbers are suggested to be indicative of greater opportunities to observe performance. The contextual opportunity to observe performance was measured by averaging the number of observations documented for each context. However, at the context-level the previous year’s documented behavioral observations were used. In the primary sample, rater-level opportunity to observe
performance was calculated using the 2004 ratings, and context-level opportunity to observe was calculated using the 2003 ratings. In the replication sample, rater-level opportunity to observe was calculated using the 2005 ratings, and context-level opportunity to observe was calculated using the 2004 ratings. This allowed for an alternate operationalization at this level, rather than simply aggregating the rater-level values using the same year’s data (i.e., 2004 in the primary sample). In further support of this context-level measure, a subject matter expert from the organization under study indicated that there should not be significant changes in the opportunities to observe performance in the various districts across the two-year spans in the data analyzed here. In other words, the barriers to observation (i.e., time, proximity, etc.) in each context should be relatively consistent over these periods of time.
Nature of work/activity. The nature of work or activity was operationalized based on
each district’s (i.e., context) standing on three variables: the number of accidents
reduction purposes, and to compute component scores describing each context’s standing on the three work/activity variables (described further in Analyses section). The nature of
work/activity in the primary sample was calculated based on district data from 2004, with 2005 district data serving as the replication sample.
Procedure
The organization’s performance management process stipulates that supervisors provide performance ratings annually for all of their respective subordinates (see Appendix A for a copy of the performance appraisal form). Furthermore, policy dictates that supervisors document behavioral observations of their subordinate’s performance, throughout the course of each performance cycle (i.e., one year). All supervisors are provided rater training on how to record these observations, in addition to frame-of-reference training, and training on psychometric error in performance ratings. Furthermore, refresher training is provided annually to all supervisors. Previous performance records are stored in both paper and electronic form for at least three years, providing the source for the performance data under study here. More specifically, performance ratings from the 2003 and 2004 performance cycles served as the primary sample, with 2004 and 2005 data serving as the replication sample. The organization also maintains ongoing records regarding the number of accidents investigated, the number of cases made, and the number of calls for service by year and district. These records provided the source for the context-level nature of work/activity data.
In any given year, approximately 10% of the Troopers participate in the
developmental. Furthermore, it should be noted that the administrative impact of the
performance ratings in the promotion process changed in 2005. Previously, ratings carried a point value in the promotion process, but in 2005 ratings served as a “qualifier” only. In other words, promotional participants had to achieve at least an average performance rating on 5 specific performance dimensions in order to be allowed to participate in the promotion process. Therefore, performance ratings were administrative for promotional participants in both samples, however the administrative role of the ratings was different. Although
previous research has indicated that administrative ratings tend to be more lenient than those provided for developmental purposes (Jawahar & Williams, 1997), it was unknown as to what impact this change in the promotion process would have for ratings across these samples. In addition, the organization had a significant change in leadership during this period of time, with a new Colonel being appointed who favored decentralization. Again, it is unclear as to what impact this change may have had on the performance ratings collected during this period of time. Although it may have been more desirable to compare two samples without the changes in the promotion process and organizational leadership, at the time of this research these were the only samples available for comparison.
Analyses
the purpose was identifying latent performance dimensions and deriving factor scores (Hatcher, 1994). Principal component analyses were used in examining the contextual work/activity data, as the purpose was strictly data reduction and the derivation of component scores (Hatcher, 1994). Finally, multilevel regression models were performed in order to address the research questions and hypotheses of this study.
Exploratory factor analyses. In order to derive factor scores for task and citizenship
performance in both the primary and replication samples, the 14 dimensions of job
performance relevant for the rank of Trooper (see Table 1) were subject to EFA using SAS version 9.1 (SAS Institute, 2003). The principal axis method was used to extract the factors, with squared multiple correlations as prior communality estimates. Based on the
eigenvalues, scree plots, and percentages of variance explained, the number of factors were chosen to subsequently rotate using orthogonal rotation. These factors were then interpreted and named. Finally, factor scores were derived to indicate each ratee’s standing on the latent factors. These scores represent linear composites of the optimally-weighted observed
performance ratings (Hatcher, 1994). Finally, in order to determine if the factors derived in the primary and replication samples were sufficiently similar, cross-sample factorial
comparisons were carried out by computation of coefficients of congruence (Harman, 1967; Tucker, 1951). These coefficients range from -1.00 representing perfect negative similarity, through 0 (complete dissimilarity), to 1.00 representing perfect similarity (Rummel, 1970).
Principal component analyses. In order to derive component scores describing the
were subject to a principal component analysis using SAS version 9.1 (SAS Institute, 2003). The principal axis method was used to extract the components, with ones as prior
communality estimates. Given only three manifest indicators, and the likely high covariance among these indicators, it was expected that only one component would be responsible for this covariance. Therefore, subsequent rotation was not necessary. Finally, component scores were derived indicating each context’s standing on the nature of work/activity component. These scores represent linear composites of the optimally-weighted observed work/activity variables (Hatcher, 1994).
Multilevel modeling. As discussed previously, multilevel models allow for the
simultaneous modeling of both within and between-group variance (Bryk & Raudenbush, 1992; Hofmann, 1997). In the data under study here, ratee level data was averaged for each rater, as between-ratee variance was not the focus of this research. Therefore raters
comprised level-1 in the hierarchy, and contexts (i.e., districts) comprised level-2. All of the multilevel modeling was conducted using HLM 6 software (Raudenbush, Bryk, Cheong, & Congdon, 2004). For each set of criterion ratings (and for both the primary and replication samples), model testing followed a staged multilevel approach (Bryk & Raudenbush, 1992). The first stage consisted of the estimation of “null models” (conceptually equivalent to one-way analyses of variance) in order provide the initial partitioning of variance in each set of criteria. For example, in order to partition the variance in task performance ratings, the following equations were estimated:
Level-1: Task Performanceij = β0j + rij (1)
Where, β0j represents the mean task performance for context j, γ00 represents the grand mean, rij represents the within-group variance (i.e., σ2) in task performance, and U0j represents the between-group variance (i.e., τ00). Null model results therefore indicate the amount of variance residing within and between groups, and allow the computation of an intra-class correlation (ICC; ratio of between group variance to the total variance) which indicates the percentage of the total variance residing between groups (Hofmann, 1997). Results also provide a chi-square test indicating whether the between-group variance is significant and, therefore, whether a multilevel approach is warranted (i.e., if there is not significant between-group variance, then an ordinary least squares approach is sufficient). Null model results therefore address H1 and H2. In other words, a finding of significant between-context
variance in the null models would support H1 and H2.
testing for significant between group variance in the pooled level-1 intercepts (necessary condition for testing H9-H16) and slopes. For example, the following random-coefficient
regression equations were estimated for task performance:
Level-1: Task Performanceij = β0j + β1j(Leniencyij - Leniency ______
.j) + β2j(Haloij - Halo
___ .j) + β3j(Observeij - Observe
_____
.j) + rij (3)
Level-2: β0j = γ00 + U0j (4)
β1j = γ10 + U1j (5)
β2j = γ20 + U2j (6)
β3j = γ30 + U3j (7)
Where, γ00 represents the mean of the intercepts across contexts; γ10, γ30, and γ30 represent the means of the slopes across contexts for leniency, halo, and the opportunity to observe,
respectively; rij represents the level-1 residual variance; U0j represents the variance in the intercepts (i.e., τ00); and U1j, U2j, and U3j represent the variance in the slopes. Significant pooled level-1 slopes for the rater tendency for leniency would support H3 and H4,
significant pooled slopes for the rater tendency for halo would support H5 and H6, and
significant pooled slopes for the opportunity to observe performance would support H7 and H8. The results of the random-coefficient regression models also indicate the percentage of
level-1 variance (within-group) explained by the rater-level predictors (R2).
predictors were group mean centered, the level-2 regression coefficients therefore represent the context-level relationship between the level-2 predictors and the performance criteria (Hofmann & Gavin, 1998). For example, the following equations were estimated for task performance:
Level-1: Task Performanceij = β0j + β1j(Leniencyij - Leniency ______
.j) + β2j(Haloij - Halo
___ .j) + β3j(Observeij - Observe
_____
.j) + rij (8)
Level-2: β0j = γ00 + γ01(Norm for Leniencyj) + γ02(Norm for Haloj) + γ03(Observej) + γ04(Nature of Workj) + U0j (9)
β1j = γ10 + U1j (10)
β2j = γ20 + U2j (11)
β3j = γ30 + U3j (12)
Where, γ00 represents the level-2 intercept; γ01, γ02, γ03, and γ04 represent the level-2 slopes for the norm for leniency, norm for halo, opportunity to observe, and the nature of work, respectively; γ10, γ20, and γ30 again represent the means of the slopes across contexts for the level-1 predictors; rij represents the level-1 residual variance; U0j represents the residual intercept variance (i.e., τ00); and U1j, U2j, and U3j represent the variance in the leve-1 slopes. These final models therefore address H9-H16, and also indicate the percentage of level-2
variance (between-group) explained by the context-level predictors (R2). Significant level-2
slopes for the contextual norm for leniency would support H9 and H10, significant slopes for
the contextual norm for halo would support H11 and H12, significant slopes for the
the nature of work/activity would support H15 and H16. Finally, all of the before mentioned
relationships were examined in both the primary (i.e., 2003 and 2004 data) and replication samples (i.e., 2004 and 2005 data), in order to determine if the findings could be replicated in an alternate set of data.
RESULTS
Table 2 presents descriptive statistics and zero-order correlations for all rater and context-level variables, for both the primary and replication samples. Although the strength and direction of the majority of the relationships between the variables remained consistent across samples, there were several exceptions. For example the rater-level tendency for leniency was not significantly correlated with the opportunity to observe performance in the primary sample (r = .16, p > .05), however this relationship was significant in the replication
sample (r = .19, p < .05). The rater tendency for halo was significantly related to the
opportunity to observe performance in the primary sample (r = .19, p < .05), but was not in
the replication sample (r = .07, p > .05). Furthermore, the tendency for leniency was not
significantly correlated with the tendency for halo at the rater (r = -.08, p > .05) or
context-level (r = -.22, p > .05) in the primary sample, however in the replication sample these
correlations were significant at both the rater (r = -.25, p < .01) and context levels (r = -.45, p
< .01). Finally, at the context-level the norm for halo was not significantly related to the nature of work/activity in the primary sample (r = -.07, p > .05), but was significant in the
replication sample (r = -.41, p < .01).
Exploratory factor analyses. Supervisor ratings on the 14 dimensions of performance
examination of the eigenvalues, scree plots, and percentages of variance explained suggested that two factors should be retained for rotation. More specifically, the first factor explained 93% of the common variance, and the second factor explained 13%. Two factors were therefore rotated using orthogonal rotation. Table 3 presents the rotated factor pattern for the primary sample. An examination of the rotated factor pattern suggested a task and
citizenship performance interpretation of the factors. Performance dimensions loading highest on the task factor were dimensions which would typically be characterized as task performance (e.g., Arrest Procedures, Knowledge and Application of Laws, and Preparing Cases for Court), as they contribute to the “technical core” (Borman & Motowidlo, 1993) for the job of Trooper. Dimensions loading highest on the citizenship factor were
correspondingly dimensions which would be characterized as citizenship performance (e.g., Community Relations, Communication, Special Duties, and Citizenship), as they include behaviors such as demonstrating cooperation and teamwork, endorsing and supporting organizational objectives, applying extra effort, maintaining good relations with local agencies, receiving calls at home, attending organization functions, and volunteering for special assignments. All of these behaviors can be seen as supporting “the organizational, social, and psychological context that serves as the critical catalyst for tasks to be
they were retained so that potentially valuable information would not be lost. Furthermore, each of the derived factor scores represent linear composites of all 14 dimensional ratings,
therefore these cross-loading dimensions (like all of the other dimensions) make a contribution to both factors.
EFA results from the replication sample were similar to those obtained in the primary sample. An examination of the eigenvalues, scree plots, and percentages of variance
explained suggested that two factors should be retained for rotation. The first factor explained 93% of the common variance, and the second factor explained 12%. Therefore, two factors were rotated using orthogonal rotation. Table 4 presents the rotated factor pattern for the replication sample. The factor pattern again suggested a task and citizenship
performance interpretation of the factors. The task factor was characterized by performance dimensions which would typically be characterized as task performance (e.g., Arrest
solution based on all 14 dimensions was retained for the replication sample, and factor scores were subsequently derived based on this solution.
Principal component analyses. District work/activity data on the number of accidents
investigated, number of cases made, and number of calls for service in each district were subject to principal component analysis, in both the primary and replication samples. Given only three observed variables, and only one component with an eigenvalue greater than one (Kaiser, 1960), a one-component solution was deemed acceptable. This first component explained 91% of the total variance. Component scores were subsequently derived, indicating each district’s standing on this linear composite of the three work/activity measures.
Multilevel modeling. In addressing the first research question and corresponding
hypotheses (i.e., H1 and H2), staged multilevel modeling began with the estimation of null
contexts). Therefore, null model results for task performance in both the primary and replication samples provide support for H1.
Null model results for citizenship performance in the primary sample suggested that there was not significant between-context variance in this criterion (τ00 = .05, df = 55, χ2 = 71.05, p > .05), however the significance value was approaching the .05 threshold (p = .07).
Results yielded an ICC of .14, indicating that 14% of the variance in citizenship performance resides between contexts, and hence 86% can be seen as between-rater (within-context) variance. Null model results for citizenship performance in the replication sample did
however suggest significant between-context variance in this criterion (τ00 = .11, df = 55, χ2 = 121.39, p < .01). Replication sample results yielded an ICC of .32, indicating that 32% of the
citizenship performance variance in the replication sample resides between contexts, and thus 68% resides between raters (within contexts). Therefore, null model results provide partial support for H2, in that results were approaching significance in the primary sample, and
indicated a fairly large percentage of between-context variance (i.e., 14%). Furthermore, the finding of significant between-context variance in citizenship performance in the replication sample also suggests support for H2.
In order to address H3-H8, the second stage of modeling introduced level-1 (i.e.,
tendency to be lenient and increases in the tendency for halo (smaller values were indicative of greater halo) were associated with increases in task performance ratings. Rater
opportunity to observe performance however was not a significant predictor. The level-1 predictors explained 84% of the within-context variance in task performance. In the replication sample, the rater tendency for leniency explained a significant amount of between-rater variance in task performance (γ20 = 1.475, p < .01), however neither the tendency for halo or opportunity to observe performance were significant predictors. The level-1 predictors explained 70% of the within-context variance in the replication sample. These results therefore provide support for H3, in that the rater tendency for leniency was a
significant predictor of the between-rater variance in task performance, in both the primary and replication samples. With regard to H5, the results were inconclusive, since the
significant prediction due to the tendency for halo was not replicated. Finally, no support was found for H7 in that the number of rater opportunities to observe performance did not
explain significant variance in task performance ratings in either sample.
The random-coefficient regression model results for citizenship performance in the primary sample followed a similar pattern as with task performance. More specifically, both the rater tendencies for leniency (γ20 = 1.729, p < .01) and halo (γ30 = 1.030, p < .01)
explained significant amounts of between-rater variance in citizenship performance. Increases in the tendency to be lenient were associated with increases in citizenship performance ratings. However, in this case decreases in the tendency for halo were
within-context variance in citizenship performance. In the replication sample, the rater tendency for leniency explained a significant amount of between-rater variance in citizenship performance (γ20 = 1.682, p < .01), however neither the tendency for halo or opportunity to observe performance were significant predictors. The level-1 predictors explained 72% of the within-context variance in the replication sample. These findings support H4 since the
rater tendency for leniency was a significant predictor in both the primary and replication samples. The results are however inconclusive regarding H6, as the tendency for halo was
not a significant predictor in both samples. Similar to the results for task performance, no support was found for H8 in that rater opportunity to observe performance was not
significantly associated with citizenship performance ratings in either sample.
The final stage of modeling was intended to address H9-H16 by including level-2
(i.e., context) predictors in intercepts-as-outcomes models. Table 6 presents the results of these models for both task and citizenship performance, and for both the primary and replication samples. With regard to task performance in the primary sample, the contextual norm for leniency (γ03 = .679, p < .01) explained a significant amount of the between-context variance. Increases in the contextual tendency to be lenient were associated with increases in task performance ratings. However, none of the other context-level variables were
significant predictors (i.e., nature of work/activity, contextual opportunity to observe performance, and contextual norm for halo). The level-2 predictors explained 29% of the between-context variance in task performance. However, in the replication sample none of the context-level variables were significant predictors. Therefore, the results are
leniency was not replicated. Furthermore, the findings provide no support for H11 (i.e.,
contextual norm for halo), H13 (i.e., contextual opportunity to observe performance), or H15
(i.e., nature of work/activity), since these context-level predictors were insignificant in both samples.
The intercepts-as-outcomes model results for citizenship performance in the primary sample indicated that the contextual norm for leniency (γ03 = .627, p < .01) explained a significant amount of between-context variance. None of the other context-level variables were significant predictors (i.e., nature of work/activity, contextual opportunity to observe performance, and contextual norm for halo). The level-2 predictors explained 33% of the between-context variance in citizenship performance. In the replication sample several level-2 predictors were significant, including the nature of work/activity (γ01 = -.121, p = .05), the contextual norm for leniency (γ03 = .483, p = .05), and the contextual norm for halo (γ04 = 1.029, p < .05). More specifically, decreases in the number of accidents investigated, number
of cases made, and number of calls for service (i.e., nature of work/activity) were associated with increases in citizenship performance ratings. Increases in the contextual tendency to be lenient were associated with increases in citizenship performance ratings. Furthermore, decreases in the contextual tendency for halo were associated with increases in citizenship performance ratings. The contextual opportunity to observe performance was not a
significant predictor. The level-2 predictors explained 17% of the between-context variance in the replication sample. These findings provide support for H10, since the contextual norm
work/activity), as these variables were significant in the replication sample, but not in the primary sample. Finally, no support was found for H14 since the contextual opportunity to
observe performance was insignificant in both samples. DISCUSSION
Main Findings
The appraisal of job performance via supervisor ratings is unfortunately often influenced by factors other than the actual performance of the ratee, as evidenced by the often large portion of variance associated with the rater (Scullen et al., 2000). The purpose of this research was consequently to contribute to our understanding of ratings as a form of performance measurement, by identifying sources that explain this variation in rater
performance. Therefore, just as “Task activities are typically different for different jobs, whereas citizenship activities are similar across jobs” (Borman, 2004, p. 238), the findings here would suggest that this may also be the case for the same job across different contexts.
This study also sought to identify rater characteristics that explain the variation in performance ratings between raters. In discussing potential sources of rater variance, Scullen et al. (2000) cited two of the most widely researched rater tendencies (i.e., leniency and halo) as possible sources. With regard to rater leniency, the results here suggested that this
tendency explained significant rater variation in both task and citizenship performance ratings. Variation in the raters’ tendencies to rate above the scale midpoint therefore explained variability in the ratings they tended to provide on the observed performance variables comprising both of the two latent dimensions. Furthermore, the tendency for halo was also a significant predictor of between-rater variance in both task and citizenship performance, although this finding failed to replicate. Interestingly however, in both samples, as the tendency for halo increased, task performance tended to increase, while increases in halo were associated with decreases in citizenship performance. In other words, raters who tended to discriminate less among all 14 of the observed performance dimensions also tended to provide higher ratings on the dimensions which predominantly characterized task performance, but lower ratings on the dimensions that comprised citizenship
performance. Finally, results indicated no relationship between the number of rater
opportunities to observe performance and either task or citizenship performance. While the rater-level model results are potentially encouraging in terms of providing a better
unfortunately be interpreted cautiously as the operationalizations of all three of these predictors may have been poor measures (discussed further in Limitations).
The final research question focused on identifying contextual characteristics that explain the variation in performance between contexts. More specifically, the tendencies for
leniency and halo at the context-level were purported to represent norms or standards for evaluating performance. It is important to note that operationalizations of these tendencies or norms at the context-level were based on performance ratings provided in each context the previous year. While the contextual norm for leniency significantly predicted the between-context variance in task performance in the primary sample, this finding was not replicated. Therefore the results can be seen as inconclusive with respect to the contextual norm for leniency and task performance. However, this norm was a consistent significant predictor of citizenship performance. In other words, the degree to which ratings tended to exceed the scale midpoint in the previous year in each district, explained a significant amount of
between-context variance in citizenship performance ratings the following year. This finding lends support to the notion that norms may be operating in each rating context, influencing the rating behaviors of the supervisors. The contextual norm for halo was not a significant predictor of task performance in either sample. This tendency did however explain
significant contextual variation in citizenship performance in the replication sample, although not in the primary sample. Therefore the relationship between context-level halo and
performance. Although this variable also was insignificant for citizenship performance in the primary sample, it did however explain significant variation in the replication sample. It is interesting to note that increases in the number of accidents investigated, number of cases made, and number of calls for service were associated with decreases in citizenship performance ratings.
Limitations
There are several limitations of this research that should be called to attention. First, the fact that many of the relationships failed to replicate across the two samples used for comparison in this study may not have been a function of the instability of those
relationships, but rather a function of the previously mentioned differences across the two samples. More specifically, the administrative impact of the ratings for participants in the organization’s annual promotion process was different in the primary versus replication samples. Although these were the only samples available for comparison, and only 10% of the ratees were promotional participants in either sample, this change may have created systematic differences across the two samples which altered the relationships under study. Furthermore, the organizational change in leadership during this time period may have also somehow distorted the relationships between the variables of interest across the two samples. Because of these potential limitations, it is difficult to interpret the results that failed to replicate across the samples.
ratings) were calculated based on derivations of the 14 dimensional performance ratings provided to each ratee, and so were the factor scores employed as criteria (i.e., optimally weighted linear composites of the 14 dimensional ratings). Although each derivation was unique, the fact that the source was the same in all three cases may have confounded the results. Therefore the large percentages of within-context variance explained by the level-1 predictors (i.e., 70% - 84% for task performance; 72% - 85% for citizenship performance) may have been predominantly due to the manner in which these predictors were measured, rather than the degree to which these tendencies are driving rater differences in reality. In retrospect, the rater level-tendencies for leniency and halo may have been better
operationalized by using a measure similar to that used for the context-level tendencies. For example, rater-level leniency and halo could be operationalized using the ratings provided by each rater in previous performance cycles1. Unfortunately, it is unclear given the measures used here just how much between-rater variance is actually due to these idiosyncratic rater tendencies. Finally, the proxy measure used for the opportunity to observe performance at both the rater and context levels may not have been measuring what was intended. Although it seems reasonable to expect that supervisors with greater opportunity to observe
performance would document a greater number of behavioral observations, other factors may be systematically impacting the number of observations recorded. For example, rater
motivation or beliefs about the importance of documenting performance may have more to do with the number of observations recorded, than actual opportunity to observe
performance. At the context-level, the number of observations documented may be
1 A post hoc inspection of the data revealed that using the previous year’s ratings to operationalize rater
influenced by norms for minimal or acceptable numbers of observations to document for each ratee, rather than contextual opportunities to observe behavior. Therefore, the results here can be seen as conclusive with respect to the number of documented observations (i.e.,
insignificant predictor of between-rater and between-context variance), but inconclusive with
regard to rater opportunities to observe performance.
The final limitations worth noting concern both the sample and certain
methodological decisions made regarding the modeling approach. In both the primary and replication samples, the numbers of raters per context were considerably low (i.e., M = 2.68
for the primary sample; M = 2.46 for the replication sample). It would obviously have been
The three-level model would have allowed for a weighted level-2 model, so that raters with more precise level-1 estimates (i.e., raters who evaluated more ratees) would have received more weight in the level-2 regression equation (Hofmann, 1997). Although more complex, this model may have provided a better test of the relationships of interest in this research.
Implications
reducing between-context differences in standards. The leadership in each context could be provided with annual feedback describing the ratings provided in their context, as compared to other organizational contexts. If this context-level performance rating feedback is
communicated effectively, this strategy may also serve to broaden the reference group of the supervisors in the various contexts. Murphy and Cleveland (1995) review reference group research which “suggests that a judge will adopt standards that are similar to those he or she believes are held by the appropriate reference groups” (p. 164). Therefore, consistent
context-level feedback may broaden reference groups from the immediate surrounding rating context (i.e., district), to the more expansive organization as a whole.
Future Research
Given the finding here of significant between-context variation in task and citizenship performance, future research should seek to identify other contextual characteristics that explain this variation. The results here implied that the tendency for leniency from context to context may in some cases be driving contextual differences. However, there are likely many other potential factors of influence. For example, in describing the social context of
performance appraisal, Levy and Williams (2004) cited distal variables such as culture and climate, economic conditions, workforce composition, and the legal climate, all of which may also be driving contextual variation. Furthermore, with regard to rater differences, future research should re-examine the rater-level variables incorporated here (i.e., leniency, halo, and opportunity to observe), and attempt to identify different methods for measuring these factors. As mentioned previously, it may be beneficial to operationalize rating
the difficulty of measuring the opportunity to observe performance in field settings, a well designed lab study may therefore provide insight into the degree to which this variable creates variation across raters. There are also numerous other rater-level factors that need to be investigated, such as rater goals and motivation, rater personality and cognitive ability, and the rater’s own performance level, especially on dimensions pertaining to supervision and evaluation. Finally, despite the somewhat limiting requirement for larger sample sizes, future research should continue to examine sources of variance in performance ratings from a multilevel approach when appropriate. Ultimately, if the data were available, a more
comprehensive three-level model could be estimated, allowing the simultaneous examination of ratee characteristics at level-1 (e.g., conscientiousness, cognitive ability, and appraisal purpose), along with the previously mentioned rater and context-level variables.
Summary