ABSTRACT
LI, XIAOMENG. Sugar Reduction and Alternative Sweetening of Skim Chocolate Milk. (Under the direction of Dr. MaryAnne Drake).
Milk and milk products provide essential nutrients, especially for children. However, overall milk consumption does not meet recommendations from the Dietary Guidelines for Americans. Flavored milk, especially chocolate milk, increases milk consumption for children, but the added sugar content raises health concerns. Interest in dietary sugar reduction has led to research in alternative sweetening of chocolate milk. The objectives of this dissertation were to evaluate the drivers of purchase intent for parents when purchasing chocolate milk for their children, identify the acceptable sugar reduction for skim chocolate milk for both young adults (19-35 y) and children (5-13 y), and to determine if lactose hydrolysis, stevia leaf extract or monkfruit extract is a viable alternative sweeting approach. Three different studies were conducted to investigate parental opinions of chocolate milk and consumer acceptability of skim chocolate milk with different sweeteners.
was hydrolyzed into its sweeter monosaccharide constituents, glucose and galactose. Hydrolysis of added lactose was able to achieve the sweetness of sucrose in chocolate milk, but contributed undesirable calories with the >7.5% (w/v) added lactose required, indicating that lactose hydrolysis may be more suitable for other dairy beverages that require less added sugar. The third study evaluated the acceptability of skim chocolate milk sweetened solely or partially by monkfruit or stevia leaf extracts. Chocolate milks sweetened by natural non-nutritive sweeteners alone were less acceptable compared to the sucrose control milk (51.4 g/L, lowest acceptable sweetness level from study 1). Skim chocolate milk sweetened by natural sweetener and sucrose blends (39.7 g/L sucrose and 46 mg/L monkfruit extract or 30 mg/L stevia leaf extract) were acceptable by both young adults (19-35 y) and children (5-13 y). The information of “natural non-nutritive sweeteners” had different impacts on parents. Traditional parents preferred chocolate milk sweetened with regular sucrose and label conscious parents preferred chocolate milk with natural non-nutritive sweeteners.
This dissertation demonstrated that sugar reduction is desired in chocolate milk and that parents preferred an all natural label. Direct sugar reduction is possible and additional sugar reduction can be achieved using natural non-nutritive sweeteners, which has an appealing effect for label conscious parents.
Sugar Reduction and Alternative Sweetening of Skim Chocolate Milk
by Xiaomeng Li
A dissertation submitted to the Graduate Faculty of North Carolina State University
in partial fulfillment of the requirements for the Degree of
Doctor of Philosophy
Food Science
Raleigh, North Carolina 2014
APPROVED BY:
_______________________________ ______________________________ Dr. MaryAnne Drake Dr. Edward Allen Foegeding
DEDICATION
BIOGRAPHY
Xiaomeng Li was born in Sichuan, China on November 19th, 1987. Her parents, Xinjian Li, who is the deputy director of Chongqing Audit Bureau; and Xuedong Zhang, who is an ophthalmic surgeon and professor of Chongqing Medical University and its 1st affiliated hospital, reside in Chongqing, China. Xiaomeng moved to Chongqing at the age of eight, graduated from Chongqing Foreign Languages School in 2005 and entered Zhejiang University in Hangzhou, which is one of the top three universities in China, with an
ACKNOWLEDGMENTS
I would like to thank my parents, Mr. Li and Ms. Zhang for their unconditional love and support when I was pursuing my degree. They always have my best interest at heart and always have great confidence in me.
To Dr. MaryAnne Drake, thank you for giving me the opportunity to study as your graduate student and really helped me improve my research skills, analytical thinking, and the ability to show confidence and to interact with clients. To my committee, Dr. Foegeding, Dr. Sanders, and Dr. Truong, I really appreciate your support and encouragement, and thank you all for making me a better scientist by asking inspiring questions during my committee meeting and oral exam. I would also like to thank Dr. Kannapon Lopetcharat for all your help and advice on statistics.
with chocolate milk processing. And to all my friends who helped and gave me great advice along the way, especially Yixu Wang, Huiying Lu, Marshall Wang, and Yun Long, thank you for all your help and support, and thank you Bo Chen, Kairong Yu, Yuting, and Ni for being great listeners.
TABLE OF CONTENTS
LIST OF TABLES………..………ix
LIST OF FIGURES………xi
CHAPTER 1: LITERATURE REVIEW. FLAVORED MILK: PAST AND FUTURE.. 1
ABSTRACT……….. 3
INTRODUCTION………. 4
SUGAR AND SUGAR CONSUMPTION……… 6
NON-NUTRITIVE SWEETENERS IN DAIRY PRODUCTS……… 7
FLAVORED MILK AND MILK DRINKS……… 11
FLAVORED MILK FOR CHILDREN……….….. 12
Nutrition of Flavored Milk………12
Flavored Milk in Schools……….. 15
Calorie-reduced Flavored Milk………. 17
Children’s Perception of Fluid Milk………. 20
FLAVORED MILK FOR ADULTS………... 21
Flavored Milk for Athletes………21
Sensory Perception of Flavored Milk………... 22
OTHER NUTRITIONAL ISSUES………. 23
Dental Caries……… 23
CONCLUSIONS………. 25
REFERENCES……… 26
CHAPTER 2: EXTRINSIC ATTRIBUTES THAT INFLUENCE PARENTS’ PURCHASE OF CHOCOLATE MILK FOR THEIR CHILDREN……… 41
ABSTRACT……… 43
PRACTICAL APPLICATION……….………... 44
INTRODUCTION………... 45
MATERIALS AND METHODS……… 47
Online Survey………... 47
Conjoint Survey……… 47
Agreements and Emotions……… 48
Kano Analysis………... 48
Statistical Analysis……… 49
RESULTS AND DISCUSSION……….. 50
Demographic and Conjoint Analysis……… 50
Agreement and Emotions………. 55
ACKNOWLEDGEMENTS………. 59
REFERENCES……… 60
CHAPTER 3: SUGAR REDUCTION OF SKIM CHOCOLATE MILK AND VIABILITY OF ALTERNATIVE SWEETENING THROUGH LACTOSE HYDROLYSIS………...… 73
INTERPRETIVE SUMMARY……… 75
ABSTRACT………. 76
INTRODUCTION………... 78
MATERIALS AND METHODS………. 80
Experimental Overview……… 80
Chocolate Milk Manufacture……… 80
Experiment I: Sugar Reduction in Skim Chocolate Milk………. 81
Threshold Determination……… 81
Power Function of Sweetness in Different Media……….. 82
Acceptance of Sugar Reduction in Chocolate Milk in Young Adult………..82
Acceptance of Sugar Reduction in Chocolate Milk in Children………...…... 84
Experiment II: Alternative Sweetening by Lactose Hydrolysis………... 86
Lactose Hydrolysis………. 86
Descriptive Analysis of Hydrolyzed Chocolate Milk………. 87
Young Adult Acceptance of Chocolate Milk Sweetened by Lactose Hydrolysis…….. 88
Statistical Analysis……… 89
RESULTS AND DISCUSSION……….. 89
Experiment I: Sugar Reduction in Skim Chocolate Milk………. 89
Thresholds and Power Functions of Sweetness in Different Media………... 89
Young Adult Acceptance of Sweetness Reduction in Chocolate Milk……….. 90
Children Acceptance of Sweetness Reduction in Chocolate Milk………. 91
Experiment II: Alternative Sweetening by Lactose Hydrolysis………... 94
Lactose Hydrolysis………. 94
Descriptive Analysis of Hydrolyzed Chocolate Milk………. 95
Young Adult Acceptance of Chocolate Milk Sweetened by Lactose Hydrolysis…….. 96
CONCLUSIONS………. 97
ACKNOWLEDGEMENTS……….... 98
REFERENCES……… 99
CHAPTER 4: PARENTS’ AND CHILDREN’S ACCEPTANCE OF SKIM CHOCOLATE MILKS SWEETENED BY MONKFRUIT AND STEVIA LEAF EXTRACTS………..………..……….. 113
ABSTRACT………... 115
Sample Preparation………. 120
Power Function of Sweetness of Natural Non-nutritive Sweeteners in Water and Skim Chocolate milk……….. 121
Determination of Iso-sweetness in Skim Chocolate Milk……….. 121
Descriptive Analysis………... 123
Young Adult Acceptance of Non-nutritive Sweeteners in Skim Chocolate Milk……….. 123
Children Acceptance of Non-nutritive Sweeteners in Skim Chocolate Milk………. 124
Acceptance Test……… 124
5-7 y Children Follow-up Interview………. 126
Parents Acceptance of Non-nutritive Sweeteners in Skim Chocolate Milk………... 127
Statistical Analysis……….. 128
RESULTS AND DISCUSSION……… 129
Power Functions of STV and MK in Water and SCM and Iso-sweetness in SCM……… 129
Descriptive Analysis………... 130
Young Adult Acceptance of Non-nutritive Sweetener in Skim Chocolate Milk………… 131
Children Acceptance of Non-nutritive Sweeteners in Skim Chocolate Milk………. 132
Acceptance Test……… 132
5-7 y Children Follow-up Interview………. 133
Parents Acceptance of Non-nutritive Sweeteners in Skim Chocolate Milk………... 134
CONCLUSIONS………... 137
ACKNOWLEDGEMENTS………... 138
REFERENCES……….. 139
APPENDICES……….. 158
APPENDIX A: ADDITIONAL TABLES OF CHAPTER 2…...………. 159
APPENDIX B: ADDITIONAL TABLES OF CHAPTER 3……...………. 164
LIST OF TABLES CHAPTER 1
Table 1. Characteristics of different artificial and natural non-nutritive sweeteners………... 40 CHAPTER 2
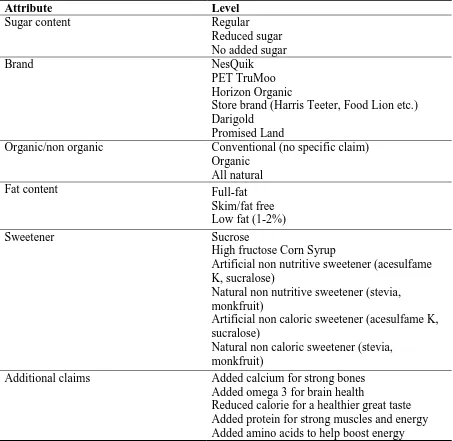
Table 1. Attributes and levels for conjoint analysis………. 65 Table 2. Zero-centered utility scores for total population and segmented groups…………... 66 Table 3. Agreement statements for segments……….. 67 Table 4. Emotions for purchasing chocolate milk for their children between segments……. 68 Table 5. Kano classification1 for total population and segmented groups……….. 69 CHAPTER 3
Table 1. Young adult liking scores for skim chocolate milk with varying sucrose
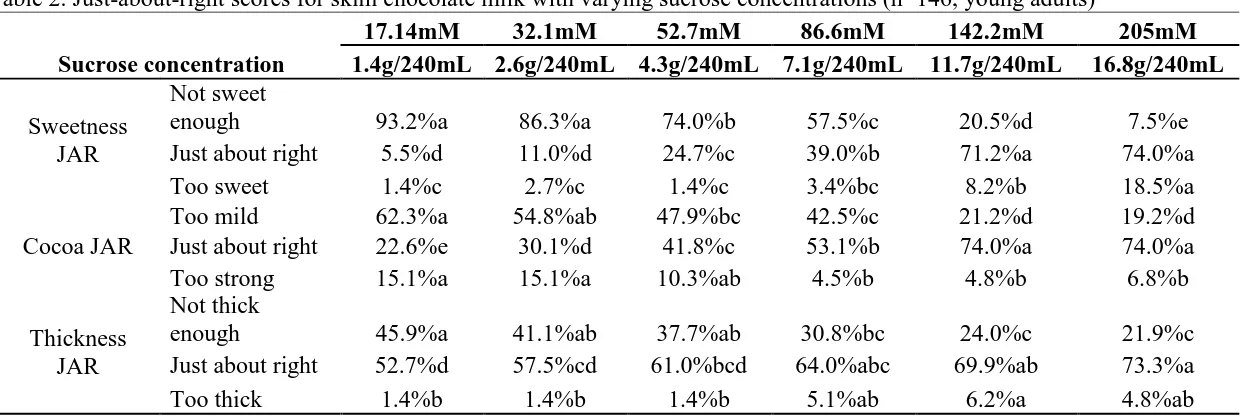
concentrations……… 104 Table 2. Just-about-right scores for skim chocolate milk with varying sucrose concentrations (young adults)……… 105 Table 3. Children acceptance scores for skim chocolate milk with varying sucrose
concentrations (8-10 y)……….. 106 Table 4. Children acceptance scores for skim chocolate milk with varying sucrose
concentrations (11-13 y)……… 107 Table 5. Young adult acceptance scores for lactose hydrolyzed chocolate milks…………. 108 CHAPTER 4
Table 1. Iso-sweetness concentrations of MF, STV, SUC:MK blends, and SUC:STV
blends………. 145 Table 2. Agreement statements for parents on chocolate milk……….. 146 Table 3. Descriptive analysis of skim chocolate milk sweetened by SUC, MK, STV,
Table 4. Young adult acceptance scores for skim chocolate milks sweetened by SUC, MK, STV, SUC:MK blends, and SUC:STV blends……….. 148 Table 5. Children acceptance scores for skim chocolate milk with different sweeteners (8-10 y)……… 149 Table 6. Children acceptance scores for skim chocolate milk with different sweeteners (11-13 y)……… 150 Table 7. Frequency of parents reading labels when purchasing chocolate milk for themselves and their children………... 151 Table 8. Parents attributes liking scores for skim chocolate milk with different
sweeteners ………..152 Table 9. Parents overall liking scores for skim chocolate milk with different sweeteners… 153 Table 10. Paired comparison between blind and prime ballots of parents purchase intent for themselves and for their children within treatments ………..154 APPENDICES
APPENDIX A
Table 1. Demographic and behavioral information for online survey ………...160 Table 2. Emotions for purchasing dairy products for their children ………..163 APPENDIX B
Table 1. Demographic information and consumer consumption characteristics of young adults……….. 165 Table 2. Demographic information of young adult acceptance test of lactose hydrolyzed chocolate milk……… 167 APPENDIX C
LIST OF FIGURES CHAPTER 2
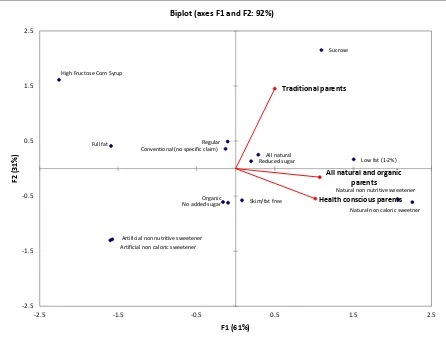
Figure 1. Attribute importance scores for total population and segmented groups for parents when purchasing chocolate milk for children……….. 70 Figure 2. Zero-centered utility scores of attributes levels for total population……… 71 Figure 3. Principal component biplot of clusters from conjoint survey with key attributes and levels……… 72 CHAPTER 3
Figure 1. Power functions of sucrose in water, skim milk, and skim chocolate milk……... 109 Figure 2. Trained panel sweet taste scores of skim chocolate milk with sucrose and lactose hydrolyzed skim chocolate milk with different levels of lactose addition……… 110 Figure 3. Trained panel sweet taste scores of skim chocolate milk with sucrose and lactose hydrolyzed skim chocolate milk with different levels of permeate addition………. 111 Figure 4. Trained panel salty taste scores of skim chocolate milk with sucrose and lactose hydrolyzed skim chocolate milk with different levels of permeate addition………. 112 CHAPTER 4
Flavored Milk: Past and Future Xiaomeng E. Li1 and MaryAnne Drake1*
1Department of Food, Bioprocessing & Nutrition Sciences, Southeast Dairy Foods
Research Center, North Carolina State University, Raleigh 27695
*Corresponding Author: MaryAnne Drake
Department of Food, Bioprocessing & Nutritional Sciences North Carolina State University
Raleigh, NC 27695-7624 Phone: 919-513-4598
Fax: 919-513-0014
E-mail: maryanne_drake@ncsu.edu
ABSTRACT
Milk and milk products provide essential nutrients for both adults and children. However, overall milk consumption of both adults and children does not meet the
recommendations from Dietary Guidelines for Americans. Flavored milk can increase milk consumption for children and adolescents, but the added sugar content raises concern. Since the removal or reduction of flavored milk decreases milk consumption for children, it is important to understand all aspects of flavored milk in order to help increase milk consumption while control sugar intake. Non-nutritive sweeteners are widely used in the food industry to reduce sugar content, and the usage of both artificial and natural sweeteners in dairy products are discussed in this review. This review also discusses the regulations of flavored milk in school meal programs, and how both adults and children perceive flavored milk. Understanding the sensory perception of both adults and children for flavored milk can help food developers and manufacturers to address attractive attributes while reducing the sugar content to meet the needs of a healthy diet.
INTRODUCTION
Milk is a white liquid produced by the mammary glands of mammals and has been regularly consumed by human for centuries as an important food (Varnam and Sutherland 2001). Since 1611, when the first cows arrived in the U.S., milk and milk products have had an important position in American history (International Dairy Foods Association 2012). The legal definition of milk in the United States is “the lacteal secretion, practically free from colostrum, obtained by the complete milking of one or more healthy cows” (US FDA 2013a) which contains mostly water (87.3%), approximately 9% solids not fat (protein, lactose, ash), and approximately 3.5% fat (Teubner 1998).
Vitamin D fortification of milk was initiated in the 1930s to prevent infantile rickets, as a recommendation by the American Medical Association’s Council on Foods and
Nutrition. The fortification of vitamin A started in the 1940’s in vitamin-mineral
formulations as vitamin D fortification became common (Dairy Practices Council 2001). Since 1978, vitamin A fortification has been required by the Pasteurized Milk Ordinance for low fat and nonfat milks since vitamin A levels are reduced with fat reduction, and vitamin D fortification has remained optional. However, for fluid milks that make vitamin addition claims, the fortification levels have to meet the FDA requirements as described above (Dairy Practices Council 2001).
2007-and consumers who did not drink fluid milk on a given day increased from 41% to 54% (Stewart and others 2013).
Flavored milk can increase milk consumption among both adults and children and also provides essential nutrients like plain milk and other milk products (Anonymous 2003; Murphy and others 2008). However, the high sugar content of flavored milk has raised health concerns and caused some schools to remove or reduce flavored milk from their lunch
programs (Quann and Adams 2013). It is important to find a balance between trying to increase milk consumption and the control of sugar intake. The objective of this review is to review flavored milk and provide a detailed description of the current status and future of flavored milk.
SUGAR AND SUGAR CONSUMPTION
had a similar level of percentage of energy intake (USDA ARS 2012). From NHNES 2003-2006 data, the mean intake of added sugar, which was added to foods or beverages when they are processed or prepared (Schorin and others 2012), for Americans ≥ 4 y, was 83 g/d
(Marriott and others 2010). Reduction of sugar-sweetened beverage intake across all population groups largely contributed to the decrease of added sugar consumption from 100.1 g/d to 76.7 g/d between 1999-2000 and 2007-2008 (Welsh and others 2011).
NON-NUTRITIVE SWEETENERS IN DAIRY PRODUCTS
Non-nutritive sweeteners are widely used in food industry to reduce the sugar content of foods and beverages. Physical and sensory properties, and food applications for artificial and natural non-nutritive sweeteners have been reviewed by Dubois and Prakash (2012). Common properties for non-nutritive sweeteners are high potency, slow onset sweetness, sweetness and aftertaste lingering, and bitter off-tastes (Table 1). Artificial non-nutritive sweeteners are sweet tasting synthetic organic compounds. Commonly used artificial non-nutritive sweeteners are saccharin (SAC), aspartame (APM), acesulfame potassium (Ace-K), and sucralose (SUL).
SAC is an organic acid and is the first artificial commercialized non-nutritive sweetener. Sodium (SAC-Na) and calcium (SAC-Ca) salts of saccharin are the commonly used forms for saccharin. Due to the synergistic property of SAC-Na with APM, and its stable thermal and pH stability, it is usually used as blends with APM and SUL in
2013). APM is the most widely used HP sweetener nowadays, especially for low pH applications in beverages. The degradation of APM can be controlled by the optimum pH range. Under Ultra High Temperature (UHT) processing temperature 136 °C (15 s), pH = 6 resulted in 42% APM loss, compared to 1% at pH = 3.5. High-temperature short-time temperature 75°C (30 s) resulted in ≤ 1% APM loss at both 3.5 and 6 pH level (O'Donnell and Kearsley 2012). APM is more often used in blends with Ace-K other than single application (DuBois and Prakash 2012). Ace-K is the potassium salt of oxathiazinone dioxide, and is often used in blends with APM in foods and beverages due to the synergetic properties that can reduce off-taste and improve the quality of sweetness (Dubois and
Prakash 2012). SUL is produced by replacing three hydroxyl groups of sucrose into chlorine atoms. SUL has good pH and light stability which made it widely used in food and beverage industry, and usually in blends with Ace-K (Dubois and Prakash 2012). Cyclamate (CYC), a cyclohexylsulfamic acid, is not permitted in United States, but its sodium salt (CYC-Na) can be used solely as a sweetener or in blends with SAC-Na in many other countries (O'Donnell and Kearsley 2012; Walters 2013).
metallic and sweetness, and longer aftertaste duration. However, pH, time and temperature, have effects on APM stability which will affect the shelf-life of APM sweetened yogurt (Fellows and others 1991). The metabolic rate of starter cultures in yogurt was also
correlated with the degradation of APM (Keller and others 1991). Pinheiro and others (2005) reviewed the effect of different sweeteners in yogurts with reduced calories. Decourcelle and others (2004) reported that yogurts made with guar gum and fructose,
fructo-oligosaccharides, APM or Ace-K had no effect on flavor release. In an early study, Hyvoene and Slotte (1983) reported that saccharin could only be used in blends with xylitol to cover its inherit bitter taste. However, in a recent study, Meena and others (2012) reported that a blend of aspartame and saccharin (70:30, 0.0425%) received the best result for sweetness perception in whey lemon beverage compared to products sweetened by aspartame alone, and was not significantly different from control products that were sweetened by sucrose in sensory profile. Reis and others (2011) determined that the iso-sweetness of strawberry yogurt sweetened by 11.5% w/w sucrose were 0.072% w/w for aspartame, 0.042% w/w for aspartame/acesulfame-K (2:1), 0.064% w/w for cyclamate/saccharin, and 0.030% w/w for sucralose. In this study, sucralose proved to be the strongest sweetener.
Natural non-nutritive sweeteners are gaining popularity in the market along with consumer preferences for all natural foods. Two plant-based high potency sweeteners, stevia and monk fruit have been reviewed by Pawar and others (2013) for their physical and
(Pawar and others 2013). The major sweet components of stevia were identified as stevioside (STV) and rebaudioside A (RebA) (Mosetting and Nes, 1995; Kohda and others 1976). RebA purified from S. rebaudiana by Whole Earth Sweetener Company was first affirmed as GRAS for use as a sweetener in 2008 (GRAS Notice No. 252), and purified steviol glycosides with RebA and STV as the principal components manufactured by
Wisdom Natural Brands were first affirmed as GRAS in 2009 (GRAS Notice No. 287) to use as a general-purpose sweetener in foods, excluding meat, poultry, and infant formulas. The acceptable daily intake for steviol glycosides was 4 mg/kg body weight per day (Pawar and others 2013).
Monk fruit is the fruit of Siraitia grosvenorii (Swingle) (also known as Monordica grosvenorii), belongs to the family Cucurbitaceae, and is most commonly known as Luo Han Guo to Chinese (DuBois and Prakash 2012; Pawar and others 2013). Monk fruit has been consumed for centuries as traditional Chinese medicine for coughs, sore throat, and other maladies (DuBois and Prakash 2012). The major sweet component of Monk fruit was
identified as mogroside V in the 1980s (Takemoto and others 1983). In 2009, PureLo®, monk fruit juice concentrate manufactured by BioVitorria was affirmed as GRAS (GRAS Notice No. 301), and in 2011, powdered monk fruit extract was affirmed as GRAS (GRAS Notice No. 359) for the U.S. The acceptable daily intake for Luo Han Guo fruit juice concentrate was approximately 25 mg/kg body weight per day (DuBois and Prakash 2012).
stevia sweeteners for vanilla yogurt by using just-about-right and penalty analysis (Narayanan and others 2014). In this study, stevia from different sources affected the concentration of sweeteners utilized in yogurt. Sweetness and sourness were the two key attributes that were affected by stevia sweeteners. The acceptance of yogurt sweetened by sucrose of all concentration levels was penalized by consumers for being too sour while yogurt sweetened by one of the stevia sweeteners (95% pure mix of maltodextrin and steviol glycosides) was not penalized. This study suggested that careful selection of stevia sweetener source was important. In a study on the effect of prebiotics and sucrose replacement on chocolate dairy desserts, stevia (SweetMix) was reported to be the weakest sweetener compared to Neotame, sucralose, and aspartame, and the acceptability of the chocolate dairy dessert was affected by both prebiotic and gum concentrations (Morais and others 2014). The effect of sweetener type on acceptability was not addressed in these studies.
FLAVORED MILK AND MILK DRINKS
Sir Hans Sloane, a British physician, was believed to first invent chocolate milk by mixing cocoa with milk to make the drink more palatable when he was introduced to cocoa as a local favorite drink in Jamaica in the late 1600’s. It was first sold as a medicine in
England (Natural History Museum, U.K.). In modern America, flavored milk and milk drinks are milk-based drinks with caloric additions such as chocolate- and fruit-flavored milk, milk shakes, hot chocolate/cocoa, malted milk, and eggnog (USDA ARS 2010). In 2011, there were 2.09 billion kg sales in flavored milk and milk drinks, which decreased by 2.8%
milk flavor for both children and adults (Boor 2001; Thompson and others 2004; Thompson and others 2007; NDC 2010). Ready-to-drink refrigerated chocolate milk is often processed with cocoa powder. Stabilizers such as carrageenan or other thickening agents are added to prevent separation and to improve the viscosity and texture (Varnam and Sutherland 2001). Artificial and natural flavors may also be added to chocolate milk to improve the flavor profile. Chocolate milk can also be created by consumers at home by adding commercially available cocoa powder or chocolate syrup to plain milk. The flavors of other flavored milks are achieved by the addition of natural and/or artificial flavors.
Nutritive sweeteners such as sugar and other non-nutritive sweeteners (artificial and natural) are often used to sweeten flavored milk (NDC 2009). The amount of sugar that is added to flavored milk varies due to different formulas and manufactures procedures (NDC 2009). On average, 28 g/serving total sugar, which indicates 16 g/serving added sugar, is present in ready-to-drink reduced fat milk beverages (flavored and sweetened, with added calcium, vitamin A and D); for chocolate-flavored drinks (whey and milk based), 21 g/serving total sugar was present; for chocolate milk (with added vitamin A and D)
specifically, 24-25 g/serving total sugar was present (USDA ARS 2013). Due to the added sweeteners and/or added solids, flavored milk is pasteurized at a temperature that is 3˚C higher than regular fluid milk (USDHHS, US PHS and US FDA 2013).
FLAVORED MILK FOR CHILDREN Nutrition of Flavored Milk
(NDC 2011). For children > 2 y, fluid milk is the number one single food contributor of calcium, potassium, phosphorous, and vitamin D (Rafferty and Heaney 2008). The
replacement of dairy servings (302.3 mg calcium per serving) by calcium-equivalent servings (such as fortified soy beverage (1.1 servings), bony fish (1.2 servings), or leafy greens (2.2 servings)) will not sufficiently replace other nutrients including protein, potassium or phosphorus (Fulgoni and others 2011). The dairy consumption of Americans falls short for the daily intake recommendations of Dietary Guidelines for Americans and is at least in part due to the increase of consumption of soft drinks and juices (Wyshak 2000; Rampersaud and others 2003; Forshee and Storey 2003; USDA ARS 2010; NDC 2011; Quann and Adams 2013; Stewart and others 2013). The dairy consumption of Americans, especially for children, is very important.
Flavored milk can improve dairy consumption and lower the intake of soft drinks and fruit drinks, and increase calcium intake (Johnson and others 2002). Johnson and others (2002) also found that the added sugar intake did not increase with flavored milk consumption, possibly due to the result of lower intake of soft drinks and fruit drinks.
among flavored milk consumers compared to plain milk consumers in some age-sex groups. Milk consumption (flavored and plain) positively influenced nutrient intakes and did not have a negative influence on body mass index (BMI)(Murphy and others 2008). This finding was supported by Vanselow and others (2009) in which chocolate milk was not associated with changes in BMI over a 5-y period for adolescents. Nicklas and others (2013) reported that among total energy consumed by children, flavored and white milk only contributed 2-6%, and contributed a higher percentage of essential nutrients compared to the percentage of added sugar consumption.
Flavored Milk in Schools
Currently, the USDA requires the National School Lunch Program (NSLP) and School Breakfast Program (SBP) to meet the meal pattern and nutrition standards based on the latest Dietary Guidelines for Americans. By 1994, participating schools of NSLP were required to offer whole milk and/or milk with other fat varieties (SNA and NDC 2008). In 1994, the Healthy Meals for Healthy Americans Act (US 103rd Congress 1994) authorized that participating schools of NSLP “shall offer students a variety of fluid milk consistent with prior year preferences unless the prior year preference for any such variety of fluid milk is less than 1 percent of the total milk consumed at the school.” This allowed many schools to gradually phase out whole milk (SNA and NDC 2008). In 2004, the Child Nutrition and WIC Reauthorization Act (US 108th Congress 2004) stated that participating schools “shall offer students fluid milk in a variety of fat contents” which removed the whole milk requirement completely (SNA and NDC, 2008). According to this act, schools could also offer flavored and unflavored fluid milk. USDA regulated schools were to only offer low-fat (1%) and fat-free flavored milk due to the recommendations of the 2010 Dietary Guidelines which recommended that children over 2 y should consume low-fat (1%) or fat-free fluid milk (USDA FNS 2011). In January of 2012, the USDA issued a final rule for the Nutrition Standards in the National School Lunch and Breakfast Program of 2012, and required that the NSLP and SBP could only offer flavored fluid milk if it was fat-free. This requirement became effective July 1, 2012, the beginning of School Year 2012-2013 (USDA FNS 2012).
several schools to reduce or remove flavored milk from school meals (Patterson and Saidel 2009; NDC 2011; Quann and Adams 2013). The removal of flavored milk caused unintended negative consequences where the consumption of milk by children decreased significantly. Patterson and Saidel (2009) reported that in a school district in Connecticut, milk sales decreased 37-63% in all K-12 grades in a 3-month period after flavored milk was removed.
Similarly, Quann and Adams (2013) reported that the removal of flavored milk would negatively influence milk consumption in a study that included 49 schools. In that study, compared to when school offered both flavored milk and white milk, milk sales and milk consumption were significantly lower when the school only offered white milk (P < 0.001). The percentage of purchased milk discarded was also significantly higher when only white milk was offered compared to when both white milk and flavored milk were offered (P < 0.001). Quann and Adams (2013) also investigated the replacement of nutrient deficits from decreased milk consumption (calcium, vitamin A and D, potassium, magnesium, and
phosphorus), and found that in order to sufficiently replace the nutrients, 3 to 4 additional foods would be needed. And this resulted in additional calorie (16-141 kcal) intake and additional cost ($2200-$4600 annually per 100 students). Therefore, unintended negative consequences from removing flavored milk from school need to be addressed.
school meal programs can reduce added sugar in children’s diet through other approaches, such as introduction of calorie-reduced flavored milk, and include flavored milk in a balanced diet and reduce calorie and sugar intake from other foods as well, the unintended consequences brought by the removal of flavored milk in the school meal program could be avoided.
Calorie-reduced Flavored Milk
Like white milk, flavored milk also contains 12 g/serving (240 mL) natural sugar, mainly lactose. Added sweeteners can be nutritive such as sucrose, HFCS, or non-nutritive sweeteners (NDC 2009). Concerns over HFCS have cost removal of chocolate milk from some schools in the past (Patterson and Saidel 2009). However, there are conflicted opinions on if HFCS contributes to children obesity. Bray and others (2004) reported that HFCS in beverages may play a role in the epidemic of obesity, but the American Medical Association has reviewed that due to the similar metabolic way of digestion, HFCS is unlikely more associated with obesity than sucrose (American Medical Association 2008). Efforts to reduce the calories of flavored milk have decreased the calories from 165.9 to 154. 0 per 8 oz (236.6 mL) from 2006 to 2010 (reduced fat and reduced sugar) (Van Horn and others 2010).
However, the higher cost associated with reduced-sugar flavored milk, since it costs more to produce, may sometimes cause it not to be selected by school nutrition directors (NDC 2009; Van Horn and others 2010).
with 25-27 g sugar content per serving (8 oz - 236.6 mL), and reduced-calorie flavored milks (150 kcal/serving) were either fat free or 1% fat flavored milk with 22-27 g sugar per
serving. Ninety nine percent of the flavored milk in this study was chocolate milk which is consistent with previous studies that chocolate milk is the most popular flavored milk (Boor 2001; Thompson and others 2004; Thompson and others 2007; NDC 2010). Yon and others (2012) reported that reduced-calorie flavored milk was still well accepted, however, the reformulated milks in that study did not have a huge calorie reduction such that flavor differences were likely small and possibly not detected by the children. Furthermore, the study was done prior to the final rule of Nutrition Standards in the National School Lunch and Breakfast Program (USDA FNS 2012) which has more strict regulations on the fat content of flavored milk.
Artificial sugar substitutes can be used to reduce the sugar content of chocolate milk. However, Dairy Management, Inc.TM and the National Dairy Council have reported that mothers and health professionals had limited acceptability for sugar substitutes although they are proved to be safe for adults and children (Ragalie 2007). In that study, all sugar
by monk fruit juice. Schools in Kansas City, Missouri and Omaha, Nebraska regions have started to offer fat-free chocolate milk with only 3 g added sugar that is also sweetened by monk fruit juice (Anonymous 2013), and Lawrence public schools food service (Kansas) will soon include similar products (Wilson 2013). The innovation of calorie reduced chocolate milk with natural sweeteners should help increase milk consumption with concurrent sugar reduction.
The International Dairy Foods Association (IDFA) and the National Milk Producers Federation (NMPF) filed a petition in 2009 to ask FDA to remove the “reduced calorie” or “reduced sugar” label from the chocolate milk package if the milk was manufactured with “any safe and suitable” non-nutritive sweeteners (US FDA 2013b). Existing regulations require manufacturers to include a nutrient content claim on the package if an ingredient that is not in a standard product was included. The argument was that nutrient content claims such as “reduced calorie” are not appealing to children and milk without such claims can let consumers “more easily identify its overall nutritional value” (US FDA 2013a). FDA
labels and/or Nutrition Facts labels, labels like “reduced calorie” should be able to help children to choose more healthful food and beverages.
Children’s Perception of Fluid Milk
FLAVORED MILK FOR ADULTS
Flavored Milk for Athletes
Athletes had improvements in endurance performance following consumption of a carbohydrate beverage (Coggan and Coyle 1991) and carbohydrate beverages are also used to increase glycogen recovery speed after exercise to benefit sequential workouts (Pritchett and others 2009). Research has shown that the addition of protein to a carbohydrate beverage (such as chocolate milk) ingested post exercise may have a positive influence on exercise recovery (Saunders and others 2004; Skillen and others 2008; Valentine and others 2008).
investigate the effect of chocolate milk consumption after soccer training on muscle
recovery. The ingestion of chocolate milk post exercise showed similar effects compared to carbohydrate beverage, but future studies with greater increases in training volumes and longer periods of time are needed to determine if functional significance exists between treatments. Lunn and others (2012) also reported in a study with male runners that after endurance exercise, chocolate milk consumption had favorable effects compared to carbohydrate only beverages. Chocolate milk popularity among adults as a post exercise recovery drink could be another way to increase adult milk consumption.
Sensory Perception of Flavored Milk
Not surprisingly, flavor is a key attribute of flavored milks. Folkenberg and others (1999) reported that mouthfeel in instant cocoa milk drinks was related to both flavor and viscosity properties, and consumers in this study preferred sweet and milky products that were not too thick. Campbell and others (2003) reported that the addition of chocolate flavor could increase the liking of conjugated linoleic acid fortified fluid milk. For chocolate milk specifically, Thompson and others (2004) reported that cocoa aroma was the major driver of liking for chocolate milks for adults. Consumers in this study were segmented into three groups, cocoa aroma and flavor was a universal driver while two of the groups were also positively influenced by malty or cooked/eggy flavors in chocolate milk. Participants
(2012) investigated the rejection and detection threshold of bitterness in chocolate milk with milks spiked with sucrose octaacetate. In this study, consumers with self-reported preference for dark chocolate had a higher rejection threshold, but the same detection threshold of bitterness compared to consumers who preferred milk chocolate, which suggested that personal preferences for dark or milk chocolate had an impact on the rejection threshold of bitterness in chocolate milk. Kim and others (2013) reported that adult consumer purchase of chocolate milk was influenced primarily by the labeled fat content on the package, followed by sugar content and brand. Interestingly, fat free was not preferred by most adults
consumers, instead reduced fat (1 or 2% milkfat) was preferred. In an online adaptive conjoint study, Li et al. (2014) reported that the majority of parents preferred reduced chocolate milk sweetened by natural non-nutritive sweeteners or sucrose, however no specific chocolate milk samples were evaluated by tasting in this study. Future studies could evaluate if labeling of “exercise recovery” or “work-out drink” would affect adult consumer acceptance, especially for athletic consumers.
OTHER NUTRITIONAL ISSUES Dental Caries
2000), and plaque acidity from sugar exposure contributes to early dental caries (Lingström and others 2000). Milk lowers the plaque pH in the mouth through the metabolism of lactose content into organic acid by plaque organisms (Levine 2001). However, previous research has shown that the decrease in plaque pH by milk is negligible and cow’s milk is
non-cariogenic due to its high buffering capacity, high calcium and phosphate content, milk proteins and enzymes (Jenkins and Ferguson 1966; Levine 2001).
Flavored milk is often sweetened with sucrose. Various studies have confirmed that the addition of sucrose to plain milk will increase cariogenicity (Thompson and others 1984; Bowen and Pearson 1993). Dunning and Hodge (1971) evaluated the influence of cocoa and sugar in milk on cariogenicity. In that study, over a 2 y period, children who consumed conventional chocolate milk with cocoa and sugar had a “small, but non-significantly higher” increase in caries compared to plain milk consumers. Chocolate milk consumers also had a “borderline significant” increase in caries compared to consumers with cocoa and an artificial sweetener group. Petti and others (1997) also reported that in an Italian schoolchildren study, children with lower sucrose consumption had better dental health. Milk and sucrose
consumption had a negative significant association with dental health, but sucrose had a much higher significance compared to milk which had a weak negative association. Optimal oral hygiene practices could substantially reduce the incidence of dental caries. More
CONCLUSIONS
Flavored milk plays a significant role in increasing milk consumption to ensure children’s essential nutrients intake as well as providing nutrition for adults. The controversy on the sugar content and calories of chocolate milk has influenced and caused many
REFERENCES
American Dental Association. 2000. Statement on early childhood caries.
http://www.ada.org/en/about-the-ada/ada-positions-policies-and-statements/statement-on-early-childhood-caries. Accessed 2014 July 25.
American Medical Association, Council on Science and Public Health. 2008. The health effect of high fructose syrup. Report 3 of the council on science and public health (A-08). http://www.ama-assn.org/resources/doc/csaph/csaph3a08-summary.pdf. Accessed 2014 January 10.
Anonymous. 2003. Tools for innovation: Dairy Foods for Today’s Pre-teens.
http://www.dairyfoods.com/articles/tools-for-innovation-dairy-foods-for-today-s-pre-teens. Accessed 2013 May 3.
Anonymous. 2013. Back to School with Monk Fruit Juice-Sweetened Chocolate Milk. http://berryondairy.blogspot.com/2013/08/back-to-school-with-monk-fruit-juice.html. Accessed 2014 January 4.
Black RE, Williams SM, Jones IE, Goulding A. 2002. Children who avoid drinking cow milk have low dietary calcium intakes and poor bone health. Am J Clin Nutr 76:675-80. Boor KJ. 2001. Fluid dairy product quality and safety: looking to the future. J Dairy Sci
84:1-11.
Bowen WH, Pearson SK. 1993. Effect of milk on cariogenesis. Caries Res 27:461-466. Bray GA, Nielsen SJ, Popkin BM. 2004. Consumption of high-fructose corn syrup in
Campbell W, Drake MA, Larick DK. 2003. The impact of fortification with conjugated linoleic acid (CLA) on the quality of fluid milk. J Dairy Sci 86:43-51.
Chapman KW, Boor KJ. 2001. Acceptance of 2% ultra-pasteurized milk by consumers, 6 to 11 years old. J Dairy Sci 84:951-954.
Christoph IB, Peter G, Rothe A, Salamon P, Weber SA, Weible D. 2011. School milk consumption in Germany-what are important product attributes for children and parents? EAAE 2011 Congress Change and Uncertainty. ETH Zurich, Zurich, Switzerland.
Coggan AR, Coyle EF. 1991. Carbohydrate ingestion during prolonged exercise: effects on metabolism and performance. Exerc Sport Sci Rev 19:1-40.
Dairy Practices Council. 2001. Guideline for vitamin A & D fortification of fluid milk. DPC 53. Keyport, NJ.
http://phpa.dhmh.maryland.gov/OEHFP/OFPCHS/Milk/Shared%20Documents/DPC 053_Vitamin_AD_Fortification_Fluid_Milk.pdf. Accessed 2014 July 10.
Decourcelle N, Lubbers S, Vallet N, Rondeau P, Guichard E. 2004. Effect of thickeners and sweeteners on the release of blended aroma compounds in fat-free stirred yoghurt during shear conditions. Int Dairy J 14:783-789.
DuBois GE, Prakash I. 2012. Non-caloric sweeteners, sweetness modulators, and sweetener enhancers. Annu Rev Food Sci Technol 3:353-380.
Fellows JW, Chang SW, Shazer WH. 1991. Stability of aspartame in fruit preparations used in yogurt. J Food Sci 56:689-691.
Folkenberg DM, Bredie WLP, Martens M. 1999. Sensory-rheological relationships in instant hot cocoa drinks. J Sens Stud 14:181-195.
Forshee RA, Storey ML. 2003. Total beverage consumption and beverage choices among children and adolescents. Int J Food Sci Nutr 54:297-307.
Frary CD, Johnson RK, Wang MQ. 2004. Children and adolescents’ choices of foods and beverages high in added sugars are associated with intakes of key nutrients and food groups. J Adolesc Health 34:56-63.
Fulgoni VL, Keast DR, Auestad N, Quann EE. 2011. Nutrients from dairy foods are difficult to replace in diets of Americans: food pattern modeling and an analyses of the
National Health and Nutrition Examination Survey 2003-2006. Nutr Res 31:759-765. Gilson SF, Saunders MJ, Moran CW, Moore RW, Womack CJ, Todd MK. 2010. Effects of
chocolate milk consumption on markers of muscle recovery following soccer training: a randomized cross-over study. J Int Soc Sports Nutr 7:19-28.
Harwood ML, Ziegler GR, Hayes JE. 2012. Rejection thresholds in chocolate milk: evidence for segmentation. Food Qual Prefer 26:128-133.
[HHS] U. S. Department of Health and Human Services. National Center for Health Statistics. 2013. Health, United States, 2012: With Special Feature on Emergency Care. Hyattsville, MD.
Hough G, Sanchez R, Barbieri T, Martinez E. 1997. Sensory optimization of a powdered chocolate milk formula. Food Qual Prefer 8:213-221.
Hough G, Sanchez R. 1998. Descriptive analysis and external preference mapping of powdered chocolate milk. Food Qual Prefer 9:197-204.
International Dairy Foods Association. 2011. Dairy Facts. 2011 Edition. International Dairy Foods Association. 2012. Dairy Facts. 2012 Edition.
Jenkins GN, Ferguson DB. 1966. Milk and dental caries. Br Dent J 120:472-477.
Jensen HH, Kesavan T. 1993. Sources of information, consumer attitudes on nutrition, and consumption of dairy products. J Consum Aff. 27:357-376.
Johnson RK, Frary C, Wang MQ. 2002. The nutritional consequences of flavored-milk consumption by school-aged children and adolescents in the United States. J Am Diet Assoc 102:853-856.
Karp JR, Johnston JD, Tecklenburg S, Mickleborough TD, Fly AD, Stager JM. 2006. Chocolate milk as a post-exercise recovery aid. Int. J. Sport Nutr Exerc Metab 16:78-91.
Keller SE, Newberg SS, Krieger TM, Shazer WH. 1991. Degradation of aspartame in yogurt related to microbial growth. J Food Sci 56:21-23.
Kim MK, Lopetcharat K, Drake MA. 2013. Influence of packaging information on consumer liking of chocolate milk. J Dairy Sci 96:4843-4856.
Kohda H, Kasai R, Yamasaki K, Murakami K, Tanaka O. 1976. New sweet diterpene glucosides from Stevia rebaudiana. Phytochemistry 15:981-983.
Levine RS. 2001. Milk, flavored milk products and caries. Br Dent J 191:20.
Li XE, Lopetcharat K, Drake MA. 2014. Extrinsic attributes that influence parents’ purchase of chocolate milk for their children. J Food Sci 79:S1407-1415.
Lingström P, van Ruyven FO, van Houte J, Kent R. 2000. The pH of dental plaque in its relation to early enamel caries and dental plaque flora in humans. J Dent Res 79:770-777.
Lunn WR, Pasiakos SM, Colletto MR, Karfonta KE, Carbone JW, Anderson JM, Rodriguez NR. 2012. Chocolate Milk and Endurance Exercise Recovery: Protein Balance, Glycogen, and Performance. Med Sci Sports Exerc 44:682-691.
Marriott BP, Olsho L, Hadden L, Connor P. 2010. Intake of added sugars and selected nutrients in the United States, National Health and Nutrition Examination Survey (NHANES) 2003-2006. Crit Rev Food Sci Nutr 50:228-258.
Monneuse M, Bellisle F, Louis-Sylvestre J. 1991. Impact of sex and age on sensory evaluation of sugar and fat in dairy products. Phy Behav 50:1111-1117.
Morais EC, Morais AR, Cruz AG, Bolini HM. 2014. Development of chocolate dairy dessert with addition of prebiotics and replacement of sucrose with different high-intensity sweeteners. J Dairy Sci 97:2600-2609.
Mosettig E. and Nes WR. 1955. Stevioside. II. The structure of the aglucon. J Org Chem 20:884-99.
Murphy MM, Douglass JS, Johnson RK, Spence LA. 2008. Drinking flavored or plain milk is positively associated with nutrient intake and is not associated with adverse effects on weight status in US children and adolescents. J Am Diet Assoc 108:631-639. Narayanan P, Chinnasamy B, Jin L, Clark S. 2014. Use of just-about-right scales and penalty
analysis to determine appropriate concentrations of stevia sweeteners for vanilla yogurt. J Dairy Sci 97:3262-3272.
[NASS and USDA] National Agricultural Statistics Service (NASS), Agricultural Statistics Board, and U.S. Department of Agriculture. 2013. Milk production.
http://usda01.library.cornell.edu/usda/nass/MilkProd//2010s/2013/MilkProd-01-23-2013.pdf. Accessed 2013 July 20.
Natural History Museum, U.K. About Sir Hans Sloane. http://www.nhm.ac.uk/research-
[NDC] National Dairy Council. 2009. Flavored milk in perspective.
http://www.nationaldairycouncil.org/SiteCollectionDocuments/child_nutrition/gener al_nutrition/FlavoredMilk_V13.pdf. Accessed 2013 December 20.
[NDC] National Dairy Council. 2010. Top five reasons to raise your hand for flavored milk. http://efnep.ucanr.edu/files/98997.pdf. Accessed 2014 March 3.
[NDC] National Dairy Council. 2011. Why flavored milk is a nutritious choice for children. Dairy Council Digest. 82:25-32.
http://www.nationaldairycouncil.org/SiteCollectionDocuments/education_materials/f lavored_milk/DCD11-4w.pdf. Accessed 2013 December 20.
Nicklas TA, O’neil CE, Fulgoni VL. 2013. The nutritional role of flavored and white milk in the diets of children. J Sch Health 83:728-733.
Noel SE, Ness AR, Northstone K, Emmett P, Newby PK. 2013. Associations between flavored milk consumption and changes in weight and body composition over time: differences among normal and overweight children. Eur J Clin Nutr 67:295-300. O'Donnell K, Kearsley M. 2012. Sweeteners and sugar alternatives in food technology, 2nd
edition. John Wiley & Sons, West Sussex, United Kingdom.
Patterson J, Saidel M. 2009. The removal of flavored milk in schools results in a Reduction in total milk purchases in all grades, K-12. J Am Diet Assoc 109:A97 (abstr.). Pawar RS, Krynitsky AJ, Rader JI. 2013. Sweeteners from plants-with emphasis on Stevia
Petti S, Simonetti R, D’Arca AS. 1997. The effect of milk and sucrose consumption on caries in 6-to-11-year-old Italian schoolchildren. Eur J Epidemiol 13:659-664.
Pinheiro MVS, Oliveira MN, Penna ALB, Tamime AY. 2005. The effect of different sweeteners in low-calorie yogurts-a review. Int J Dairy Technol 58:193-199. Prakash I, Campbell M, Miguel RIS, Chaturvedula VSP. 2012. Synthesis and sensory
evaluation of ent-kaurane diterpene glycosides. Molecules 17:8908-8916.
Pritchett K, Bishop P, Pritchett R, Green M, Katica C. 2009. Acute effects of chocolate milk and a commercial recovery beverage on postexercise recovery indices and endurance cycling performance. Appl Physiol Nutr Metab 34:1017-1022.
Quann EE, Adams D. 2013. Impact on milk consumption and nutrient intakes from eliminating flavored milk in elementary schools. Nutr Today 48:127-134.
Rafferty K, Heaney RP. 2008. Nutrient effects on the calcium economy: emphasizing the potassium controversy. J Nutr 138:166S-171S.
Ragalie J. 2007. Position statement: flavored milk and sweeteners. Dairy Management, Inc.TM and National Dairy Council.
http://www.nationaldairycouncil.org/SiteCollectionDocuments/child_nutrition/health _kit/FMUPositionStatementFlavoredMilkandSweeteners.pdf. Accessed 2013
January 3.
Reis RC, Minim VPR, Bolini HMA, Dias BRP, Minim LA, Ceresino EB. 2011. Sweetness equivalence of different sweeteners in strawberry-flavored yogurt. J Food Qual 34:163-170.
Rosan B, Lamont RJ. 2000. Dental plaque formation. Microbes Infect 2:1599-1607. Saunders MJ, Kane MD, Todd MK. 2004. Effects of a carbohydrate-protein beverage on
cycling endurance and muscle damage. Med Sci Sports Exerc 36:1233-1238. Schorin MD, Sollid K, Edge MS, Bouchoux A. 2012. The science of sugars, part I: a closer
look at sugars. Nutr Today 47:96-101.
[SNA and NDC] School Nutrition Association and National Dairy Council. 2008. School milk: fat content has declined dramatically since the early 1990s. ENVIRON International Corporation for SNA and NDC.
http://www.nationaldairycouncil.org/SiteCollectionDocuments/child_nutrition/milki nschools/ENVIRONReportonSNDAIandIIIdataFinal.pdf. Accessed 2014 January 5. Skillen RA, Testa M, Applegate EA, Heiden EA, Fascetti AJ, Casazza GA. 2008. Effect of
an amino acid-carbohydrate drink on exercise performance after consecutive-day exercise bouts. Int J Sports Nutr Exerc Metab 18:473-479.
Spence LA, Cifelli CJ, Miller GD. 2011. The role of dairy products in healthy weight and body composition in children and adolescents. Curr Nutr Food Sci 7:40-49.
Stewart H, Dong D, Carlson A. 2013. Why are Americans consuming less fluid milk? A look at generational differences in intake frequency, ERR-149, U.S. Department of
Takemoto T, Arihara S, Nakajima T, Okuhira M. 1983. Studies on the constituents of
Fructus momordicae. III. Structure of mogrosides. Yakugaku Zasshi103:1167-1173. Teubner C. 1998. The cheese bible. Penguin Studio. p 6-23.
Thomas K, Morris P, Stevenson E. 2009. Improved endurance capacity following chocolate milk consumption compared with 2 commercially available sports drinks. Appl Physiol Nutr Metab 34:78-82.
Thompson ME, Dever JG, Pearce EIF. 1984. Intraoral testing of flavored sweetened milk. N Z Dent J 86:44-46.
Thompson JL, Drake MA, Lopetcharat K, Yates MD. 2004. Preference mapping of commercial chocolate milks. J Food Sci 69:406-413.
Thompson JL, Gerard PD, Drake MA. 2007. Chocolate Milk and the Hispanic Consumer. J Food Sci 72:S666-675.
US 103rd Congress. Healthy Meals for Healthy Americans Act of 1994. S 1614.
http://www.gpo.gov/fdsys/pkg/BILLS-103s1614enr/pdf/BILLS-103s1614enr.pdf. Accessed 2014 January 30.
US 108th Congress. Child Nutrition and WIC Reauthorization Act of 2004. S 2507. http://www.gpo.gov/fdsys/pkg/BILLS-108s2507enr/pdf/BILLS-108s2507enr.pdf. Accessed 2014 January 30.
[USDA ARS] U.S. Department of Agriculture, Agricultural Research Service. 2010. What We Eat in America, NHANES 2005-2006: Fluid milk consumption in the United States.
http://www.ars.usda.gov/SP2UserFiles/Place/12355000/pdf/DBrief/3_milk_consumpt ion_0506.pdf. Accessed 2013 December 20.
[USDA ARS]US Department of Agriculture, Agricultural Research Service. 2012. Nutrient Intakes from Food: Mean Amounts Consumed per Individual, by Gender and Age, What We Eat in America, NHANES 2009-2010. www.ars.usda.gov/ba/bhnrc/fsrg. Accessed 2014 April 5.
[USDA ARS]U.S. Department of Agriculture, Agricultural Research Service. 2013. USDA National Nutrient Database for Standard Reference, Release 26.
[USDA FNS] U.S. Department of Agriculture, Food and Nutrition Service. 2011. Guidance memo: child nutrition reauthorization 2010: nutrition requirements for fluid milk. http://www.eed.state.ak.us/tls/cnp/pdf/SP292011.pdf. Accessed 2013 December 20. [USDA FNS] U.S. Department of Agriculture, Food and Nutrition Service. 2012. Final rule:
nutrition standards in the national school lunch and school breakfast programs. 7 CFR 210 and 220. http://www.fns.usda.gov/sites/default/files/SP10-2012ar6.pdf. Accessed 2013 December 20.
[USDA and USDHHS] U.S. Department of Agriculture and U.S. Department of Health and Human Services. Dietary Guidelines for Americans, 2010. 7th Edition, Washington, DC: U.S. Government Printing Office, December 2010.
US FDA. 1980. Cyclamate (cyclamic acid, calcium cyclamate, and sodium cyclamate), commissioner’s decision. No. 76F-0932.
http://www.fda.gov/downloads/food/ingredientspackaginglabeling/foodadditivesingre dients/ucm404344.pdf. Accessed 2014 July 18.
US FDA. 2013a. Milk. 21 CFR 131.110.
http://www.accessdata.fda.gov/scripts/cdrh/cfdocs/cfcfr/CFRSearch.cfm?fr=131.110. Accessed 2013 December 20.
US FDA. 2013b. Proposed rules: flavored milk; petition to amend the standard of identity for milk and 17 additional dairy products. FDA-20090P-0147.
http://www.gpo.gov/fdsys/pkg/FR-2013-02-20/pdf/2013-03835.pdf. Accessed 2014 January 30.
US FDA. 2013c. FDA wants your opinion on dairy-product labels.
http://www.fda.gov/downloads/forconsumers/consumerupdates/ucm347770.pdf. Accessed 2014 January 30.
US FDA. 2014. Additional information about high-intensity sweeteners permitted for use in food in the United States.
Valentine RJ, Saunders MJ, Todd MK, St. Laurent TG. 2008. Influence of carbohydrate-protein beverage on cycling endurance and indices of muscle disruption. Int J Sport Nutr Exerc Metab 18:379-388.
Van Horn L, Johnson RK, Flickinger BD, Vafiadis DK, Yin-Piazza S. 2010. Translation and implementation of added sugars consumption recommendations. Circulation
122:2470-2490.
Vanselow MS, Pereira MA, Neumark-Sztainer D, Raatz SK. 2009. Adolescent beverage habits and changes in weight over time: findings from Project EAT. Am J Clin Nutr 90:1489-95.
Varnam AH, Sutherland JP. 2001. Milk and milk products. Aspen Publishers, Inc. Gaithersburg, Maryland.
Walters DE. 2013. The Sweetener Book. Gale Walters publishing. Lindenhurst, Illinois. Welsh JA, Sharma AJ, Grellinger L, Vos MB. 2011. Consumption of added sugars is
decreasing in the United States. Am J Clin Nutr 94:726-734. Wilson A. 2013. Change coming to Lawrence school cafeterias.
http://6lawrence.com/news/education/6292-change-coming-to-lawrence-school-cafeterias. Accessed 2014 January 29.
Wyshak G. 2000. Teenaged girls, carbonated beverage consumption and bone fractures. Arch Pediatr Adolesc Med 154:610-613.
http://www.washingtonpost.com/business/economy/beverage-of-champions- chocolate-milk-gets-an-olympic-style-makeover/2014/01/31/a13261b6-89c8-11e3-916e-e01534b1e132_story.html. Accessed 2014 February 2.
TABLES
Table 1. Characteristics of different artificial and natural non-nutritive sweeteners (DuBois and Prakash 2012; O'Donnell and Kearsley 2012; Prakash and others 2012; Pawar and others 2013; US FDA 2014)
Saccharin Acesulfame
K Aspartame Sucralose Cyclamate Mogrosides V Stevioside
Rebaudioside A Sweetener potency
Pw(5)*
450 140 200 680 32 256 120 250
Temporal profile of sweetness
Onset rapid quick slight delay slight
delay rapid delay delay
slight delay Lingering not
significant low moderate moderate
not
significant moderate moderate significant
Off-taste bitter and
metallic
bitter and metallic at
high concentration
little or no bitterness for some tasters drying or bitter for some tasters bitter and salty at high concentration bitter licorice-like cooling bitter licorice-like cooling bitter licorice-like cooling Year first affirmed as
GRAS or approved by FDA as a general purpose sweetener in US 1879; 2000 (removed from potential carcinogens)
2003 1996 1999
Not permitted in US but in
many other countries1 2009 (juice concentrate) 2011 (powder extract)
2009 2008
*Pw(5) indicates that relative to a 5% (w/v) sucrose reference, the sweetener is x times more potent.
1Cyclamate (cyclamic acid, calcium cyclamate, and sodium cyclamate) was first approved for table top sweetener use in 1951. In
Extrinsic Attributes That Influence Parents’ Purchase of Chocolate Milk for Their Children
Xiaomeng E. Li1, Kannapon Lopetcharat2, and MaryAnne Drake1*
1Department of Food, Bioprocessing & Nutrition Sciences, Southeast Dairy Foods
Research Center, North Carolina State University, Raleigh 27695
2Nouveau Centric Co. Ltd. Bangkok 10250 Thailand
*Corresponding Author: MaryAnne Drake
Department of Food, Bioprocessing & Nutritional Sciences North Carolina State University
Raleigh, NC 27695-7624 Phone: 919-513-4598
Fax: 919-513-0014
E-mail: maryanne_drake@ncsu.edu
ABSTRACT
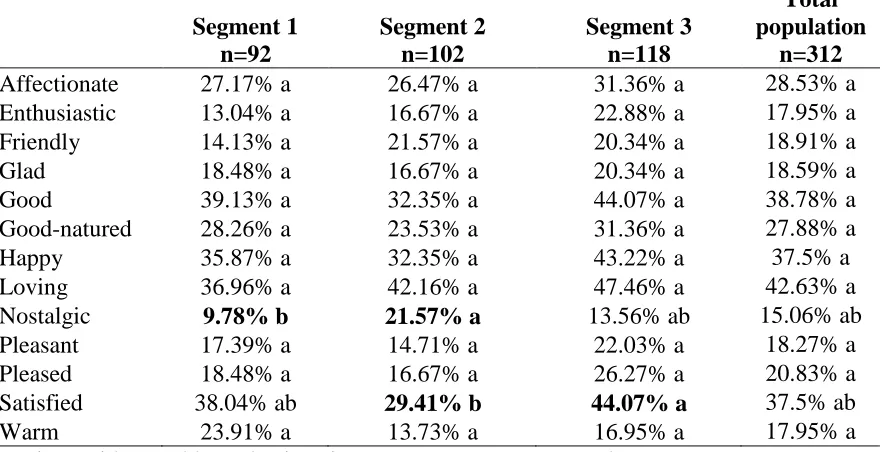
The consumption of milk is essential for children’s heath; and flavored milk, especially chocolate milk, is often purchased to increase children’s milk consumption. However, the sugar content of chocolate milk has raised health concerns. As such, it is important to understand chocolate milk extrinsic attributes that influence parents’ purchase decisions when they are purchasing chocolate milk for their children. The objective of this study was to determine the key extrinsic attributes for parents when they purchase chocolate milk for their children. An online survey with a conjoint analysis design, emotions questions, and Kano questionnaire that focused on chocolate milk was conducted targeting parents. Three hundred and twelve parents participated in the survey. Parents reported positive emotions including good, good natured, happy, loving, and satisfied when purchasing chocolate milk for their kids. Three segments of parents were identified with subtle but distinct differences in their key preferences for chocolate milk attributes for their children. Type of sweetener was the primary driver of choice for purchasing chocolate milk for children followed by fat content. Among sweetener types, natural noncaloric/nonnutritive sweeteners or sucrose were preferred over artificial sweeteners, and reduced fat was
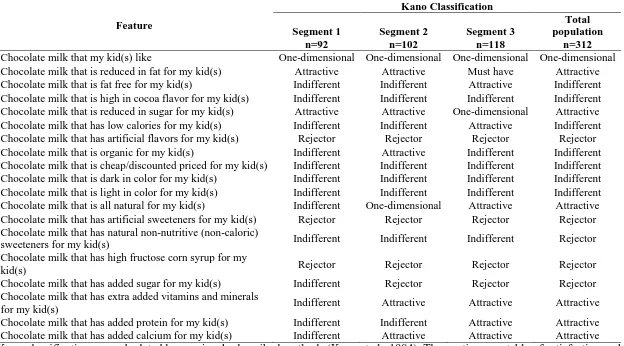
preferred over full fat or skim milk. Kano results revealed that reduced fat and sugar with an all natural label and added vitamins, minerals, and protein were attractive to the majority of parents when purchasing chocolate milk for their kids.
PRACTICAL APPLICATION
Understanding the driving extrinsic attributes for parents when they purchase chocolate milk for their children will assist manufacturers to target extrinsic attributes that are attractive to parents for chocolate milk. This study established that sweetener type and fat content are the primary extrinsic attributes affecting parents purchase decisions when
INTRODUCTION
Bone health in children and adolescents is related to the intake of milk and milk products (Dietary Guidelines for Americans 2010). Studies have shown that milk is the number one source of calcium and that consumption of milk has a beneficial relationship with the health of children and adolescents, and that children who avoid drinking cow milk have poor bone health (Black and others 2002; Spence and others 2011). The Dietary Guidelines for Americans (2010) suggests that Americans should consume ca. 710 mL per day of fat-free or low-fat milk or equivalent milk products for adults and children ages 9 to 18 y, ca. 592 mL per day for children ages 4 to 8 y, and ca. 473 mL per day for children ages 2 to 3 y. However, Quann and Adams (2013) confirmed that the consumption of dairy foods falls short for children. The milk consumption of children has decreased at least in part due to other beverages such as soft drinks and fruit drinks (Johnson and others 2002; Ha and others 2009). For young children <5 y, fruit juice consumption is significantly higher than
or reduced flavored milk from their lunch program but milk consumption of children at school also declined accordingly (Quann and Adams 2013).
It is important to understand parents’ perception and attitudes toward the sugar content of flavored milk and milk consumption, especially, their flavored milk buying behavior for their children to provide some insights on what are the drivers of decision. Flavored milks come in different flavors such as chocolate, strawberry, and vanilla with low-fat and low-fat-free varieties (National Dairy Council 2012). Chocolate milk is the most popular milk flavor for both children and adults (Boor 2001; Thompson and others 2004; Thompson and others 2007). In a Texas based study (Ward and others 2002), children preferred skim chocolate milk over plain whole or skim milk at lunchtime, which represented 19% of dairy food choices. In an ethnic group study, Thompson and others (2007) also confirmed that Hispanic children preferred flavored milk at school, as a snack after school, at breakfast, on special occasions, and before bed; and that children preferred chocolate milk over other flavors and unflavored milk due to its flavor and color.
for their children. The objective of this study was to determine the key attributes for parents when they purchase chocolate milk for their children. An online survey with a conjoint survey and Kano questionnaire was conducted targeting the parents.
MATERIALS AND METHODS
Online Survey
All respondents (n = 312) were recruited from an online consumer database of over 5000 individuals maintained by the North Carolina State Univ. Sensory Service Center (Raleigh, N.C., U.S.A.). Respondents were prescreened parents 18 to 64 y, who purchased fluid milk at least 2 to 3 times per month, and currently purchased or were willing to purchase chocolate milk for their children. A minimum of one child between 3 and 17 y living in the household was also required for participation. The online survey was created with SSI Web (Sawtooth Software version 8.1.2, Orem, Utah, U.S.A.). Respondents answered demographic questions first and then answered behavior, agreement and emotion questions, followed by a Kano questionnaire. The online survey included an adaptive choice-based conjoint (ACBC) survey (Orme 2009; Jervis and others 2012b). After respondents finished the entire survey, they were entered into a drawing to receive a $100 or one of 4 $25 gift cards to a local shopping store. A total of 312 qualified responses were collected.
Conjoint Survey
designed with a build-your-own sequence and was followed by 10 screening tasks with 4 product concepts per task, with the possible responses of “a possibility” or “won’t work for me” (Jervis and others 2012b). Seven unacceptable questions and 6 must-have questions were built through the screening tasks. The screening task selection was followed by 10 choice tasks with 3 concepts per choice task. A maximum of 21 choice tasks were brought in to the choice task tournament section. Root likelihood (RLH) values were analyzed to
remove any respondents with a RLH value below 0.333 (Orme 2009; Jervis and others 2012b).
Agreements and Emotions
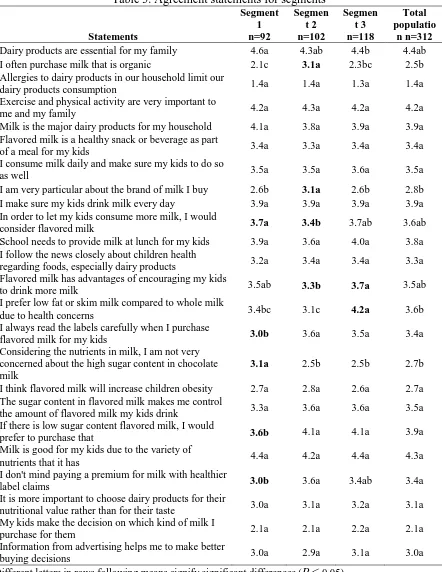
After demographic questions and prior to the Kano questionnaire (described in Kano Analysis section), consumers were asked about their attitudes toward dairy products using a 5-point agreement scale where 1 was strongly disagree and 5 was strongly agree (Table 3). The agreement questions were followed by emotion questions where respondents were asked how they felt when they purchased chocolate milk, regular milk, cheese, yogurt, and cottage cheese for their children through a CATA (choose all that apply) task that was adapted from King and others (2010). Emotions selected by over 20% of respondents were reported.
Kano Analysis
were presented in negative format, for example: “chocolate milk that my kid(s) do NOT like.” The answer choices for satisfaction/dissatisfaction questions were: like, must have, do not care, can live with it, and dislike. Kano index and satisfaction/ dissatisfaction coefficients were calculated based on previously described methods (Berger and others 1993; Xu and others 2009).
Statistical Analysis
RESULTS AND DISCUSSION
Demographic and conjoint analysis
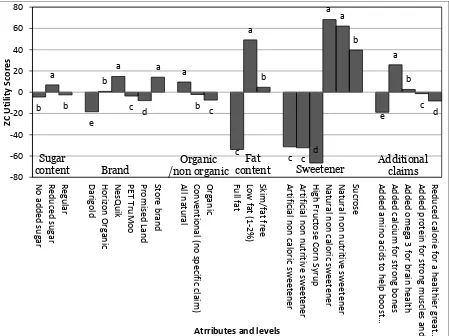
A total of 312 parents completed the survey. Respondents were primarily female (82.1% female, 17.9% male). Most parents (77%) had 1 to 2 children and 22.0% had 3 to 4 children in the household. No respondents had RLH values of 0.333 for the conjoint survey, thus all respondents were kept in the data analysis. Importance values with higher scores indicate that the attribute is more important than other attributes with lower importance scores (Orme 2009). Parents were more concerned with attributes with higher importance scores than lower importance scores. Among 6 attributes, sweetener type received the highest importance score followed by fat content which indicates that parents were concerned more about the way that chocolate milk was sweetened and its fat content than brand, additional claims, organic/non organic, or sugar content (Figure 1). Kim and others (2013) found that fat content followed by sugar content were the most important attributes for adult consumers but sweetener type was not addressed.
For utility scores (zero centered), higher scores represent more appealing attribute levels, and negative scores represent less appealing levels compared to levels with positive scores (Orme 2009). Parents preferred chocolate milk with reduced sugar over no added sugar or regular sugar content (Figure 2; P < 0.05). Studies have shown that parents
Christoph and others (2011) found that low sugar content was not an important statement for the majority of German parents’ flavored milk purchase for children >15 y.
In this study, the national brand NesQuik and store brands were not distinct from each other (P > 0.05), and they received higher utility scores compared to other brands. Kim and others (2013) also confirmed chocolate milk consumers, especially women, had a positive attitude toward store brands. In this study, 82% of the respondents were women; therefore, it is reasonable that there was no difference between a national brand and store brands.
Darigold received the lowest brand utility score as expected (P < 0.05) as it is a regional brand not present in the North Carolina market. North Carolina consumers are not familiar with this brand and well-recognized brands often obtain higher consumer acceptance (Hoyer and Brown 1990; Kim and others 2013).