Copyright 0 1989 by the Genetics Society of America
The Effect of Change in Population Size on DNA Polymorphism
Fumio Tajima
Department of Biology, Kyushu University, Fukuoka 812, Japan
Manuscript received March 10, 1989
Accepted for publication July 14, 1989
ABSTRACT
The expected number of segregating sites and the expectation of the average number of nucleotide differences among DNA sequences randomly sampled from a population, which is not in equilibrium, have been developed. The results obtained indicate that, in the case where the population size has changed drastically, the number of segregating sites is influenced by the size of the current population more strongly than is the average number of nucleotide differences, while the average number of nucleotide differences is affected by the size of the original population more severely than is the number of segregating sites. The results also indicate that the average number of nucleotide differences is affected by a population bottleneck more strongly than is the number of segregating sites.
T
HE amount of genetic variation at the DNA level can be measured by the number of segregating sites among DNA sequences sampled (WATTERSON1975) or by the average number of (pairwise) nucleo- tide differences between DNA sequences sampled (TAJIMA 1983). T h e statistical properties of these quantities have been obtained under the assumption that the size of population is constant (WATTERSON
1975; TAJIMA 1983).
T h e size of population, however, often changes drastically. Although the effects of change in popula- tion size on heterozygosity and the number of alleles in a sample have already been studied by NEI, MA-
RUYAMA and CHAKRABORTY (1975), CHAKRABORTY and NEI (1977), MARUYAMA and FUERST (1984,
1985a,b), WATTERSON (1986), the effect of change in population size on the number of segregating sites and the average number of nucleotide differences is not yet known.
Here I examine this problem quantitatively, since the number of segregating sites and the average num- ber of nucleotide differences are more appropriate measures for the amount of DNA polymorphism than heterozygosity and the number of alleles.
THEORY
Assumption: Assume that a mutant is selectively neutral (KIMURA 1968, 1983), and that the number of sites on a DNA sequence is so large that a newly arisen mutation takes place at a site different from the sites where the previous mutations have occurred (KIMURA 1969). Also assume that a population consists of diploid individuals, and consider a DNA sequence located on an autosomal chromosome.
General formula: Consider a randomly mating population with discrete and nonoverlapping genera-
Genetics 123: 597-601 (November, 1989)
tions, and let N t be the effective population size in the tth generation. Denote by v the mutation rate per DNA sequence per generation. Also denote the ex- pected number of segregating sites among n DNA sequences randomly chosen from a population in the tth generation by S,(t).
T h e number of segregating sites is the number of sites which are segregating (or polymorphic) among n
DNA sequences. On the other hand, the average number of nucleotide differences between DNA se- quences is given by
where I t j is the number of nucleotide differences
between the ith and jth DNA sequences. Therefore, the expectation of the average number of nucleotide differences is equal to the expected number of nu- cleotide differences between two DNA sequences ran- domly sampled from a population. Since the number of nucleotide differences between two DNA se- quences is equal to the number of segregating sites when n is
2,
the expectation of the average number of nucleotide differences is equal to the expected number of segregating sites for n = 2, namelyE $ ) = S,(t).
Incidentally, S,(t) = 0 since there is no segregating site when only one DNA sequence is considered.
If we denote the probability, that n DNA sequences randomly sampled from a population in the tth gen- eration are derived from i DNA sequences in the previous generation, by Pn(i) then Sn(t) is given by
n
where the last term in the right side of (1) is the effect of mutations. When n is small, P,(i) is approximately given by
mined from the initial conditions. Then, we have
n
~ , ( t ) = bn,l
+
C
b,.iexp(-a,t), (6) i=2where
P,(n) = 1
- -
,2Nt-1
and
P,(i) = 0 for i
<
n-
1(KINGMAN 1982; HUDSON 1983; TAJIMA 1983). Sub- stituting (2) into (l), we have
&(t)
-
S,(t-
1)where Sl(t) = 0 as mentioned earlier.
becomes
If we use the differential equation method, (3)
This formula is simpler than (3), and we do not have to assume that n is small in this case. We use (4) instead of (3) in order to obtain S,(t).
Assume that the population size is constant (Nf = N ,
for t
>
0). Then, integration of (4) givesM
+-
n - 1
+
C,exp(-a,t),where
M = 4Nv,
a, = -,
2N
and Cn is the integral constant which can be deter-
n- 1
bn,n = ~ n ( 0 )
-
bn,i.I= 1
bl,l
is equal to 0 since S,(t) is 0, so that we haven-1
bn,, can be obtained by using
(7)
repeatedly. For example, when n is2,
from(7)
we haveb2,1 = M and b2,2 = S40)
-
M .Therefore, we obtain
&(t) = M
+
[&(0)-
M]exp[-t/(2N)], (8)which is identical with the formula obtained by LI (1977) using a different method. Incidentally, LI (1977) has shown not only the expectation but also the variance and distribution of the number of nu- cleotide differences between two DNA sequences.
Starting from an equilibrium population: When the population is in equilibrium at time 0, we can simplify ( 6 ) . Since S,(O) = Mo C:Z/ (l/z), where Mo =
4N0v (WATTERSON 1975), (6) becomes
n-l 1 W 2 1
1=1 a I= 1
S,(t) = M 7
+
(Mo-
M) cn,iexp(-a2,t), (9)where [n/2] is the largest integer which is not greater than n/2, and cn,, is given by
(n
-
l)!n!(4i-
1)cnri = (n
-
2i)!(n+
2i-
l)!i(2i-
1)' (10).When n = 2, we have c 2 , ] = 1 from (10). Therefore, we obtain (8).
NUMERICAL EXAMPLE
Starting from an equilibrium population: First, we consider the case where the population is in equilib- rium at time 0. Then, Sn(t) is given by (9). Table 1 shows the case where M o = 0 and M = 1. This means that until time 0 the size of the population is so small that there is no genetic variation, but population size becomes large afterwards. In this table the values of
S,(t)/C:=;' (l/i) are shown, since they are equal to M
Change in Population Size 599
TABLE 1
Values of S.(t)/C:=;' ( I / i ) obtained by equation 9, where 4N0v = 0 and 4Nv = 1 are assumed
Sample size (n)
t
-
2N 2 5 10 20 50 100
0.0 0.000 0.000 0.000 0.000 0.000 0.000
0.1 0.095 0.109 0.146 0.198 0.283 0.349
0.2 0.181 0.202 0.253 0.317 0.407 0.469
0.3 0.259 0.282 0.337 0.403 0.488 0.545
0.4 0.330 0.353 0.407 0.471 0.550 0.601
0.5 0.393 0.416 0.468 0.527 0.599 0.646
0.6 0.451 0.472 0.521 0.575 0.641 0.683
0.7 0.503 0.523 0.567 0.617 0.677 0.715
0.8 0.551 0.568 0.609 0.655 0.709 0.743
0.9 0.593 0.610 0.647 0.688 0.737 0.768
1.0 0.632 0.647 0.681 0.718 0.763 0.791
1.2 0.699 0.711 0.739 0.769 0.806 0.829
1.4 0.753 0.763 0.786 0.811 0.841 0.860
1.6 0.798 0.806 0.825 0.846 0.870 0.885
1.8 0.835 0.841 0.857 0.874 0.894 0.906
2.0 0.865 0.870 0.883 0.896 0.913 0.923
2.5 0.918 0.921 0.929 0.937 0.947 0.953
3.0 0.950 0.952 0.957 0.962 0.968 0.972
3.5 0.970 0.971 0.974 0.977 0.981 0.983
4.0 0.982 0.982 0.984 0.986 0.988 0.990
4.5 0.989 0.989 0.990 0.992 0.993 0.994
5.0 0.993 0.994 0.994 0.995 0.996 0.996
6.0 0.998 0.998 0,998 0.998 0.998 0.999
7.0 0.999 0.999 0.999 0.999 0.999 0.999
8.0 1.000 1.000 1.000 1.000 1.000 1.000
.S,(t) is the expected number of segregating sites among a sample
of n DNA sequences. Especially, &(t) is equal to the expectation of
the average number of (pairwise) nucleotide differences between
DNA sequences sampled.
we can see that the amount of variation increases very slowly, especially in the case of n = 2. For example, it takes 1.4N generations until this number becomes half of the maximum value. On the other hand, in the case of n = 100 it takes only 0.5N generations. In fact, from (9) we can see that the larger is the sample size, the more quickly the number of segregating sites increases.
Table
2
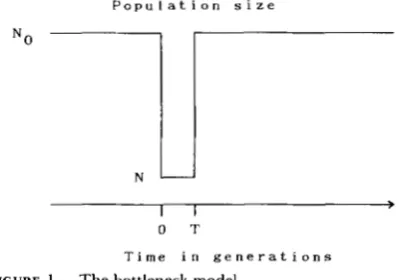
shows the case where the size of population suddenly becomes one hundredth at time 0. In this case the number of segregating sites declines more rapidly than the average number of nucleotide differ- ences. Again, the larger is the sample size, the more quickly the number of segregating sites decreases.Bottleneck effect: In this section we consider the case where the size of the population becomes small, but the population recovers the original size T gen- erations later. Figure 1 shows this process. At time 0 the population is assumed to be in equilibrium, so that
&(t) for 0
<
t<
T can be computed, using (9). After then, S,(t) is computed, using (6) with(7),
since the population is no more in equilibrium. It should be noted that M is replaced with M o in these formulae. Figure 2 gives several examples in which the popu- lation size is assumed to become one hundredth of theTABLE 2
Values of S,,(t)/ZZ/ (l/i) obtained by equation 9, where 4Nov = 100 and 4Nv = 1 are assumed
t 2N 0.0 0.1 0.2 0.3 0.4 0.5 0.6 0.7 0.8 0.9 1
.o
1.2 1.4 1.6 1.8 2.0 2.5 3.0 3.5 4.0 4.5 5.0 6.0 7.0 8.0 9.0 10.0-
2 100.00 90.58 82.05 74.34 67.36 6 1.05 55.33 50.16 45.48 41.25 37.42 30.82 25.41 20.99 17.36 14.40 9.13 5.93 3.99 2.81 2.10 1.67 1.25 1.09 1.03 1.01 1 .oo5 100.00 89.17 80.00 72.06 65.07 58.84 53.27 48.25 43.74 39.66 35.97 29.63 24.44 20.19 16.7 1 13.86 8.80 5.73 3.87 2.74 2.06 1.64 1.24 1.09 1.03 1.01 1 .oo
Sample size (n)
10 20
100.00 100.00
85.55 80.36
74.99 68.60
66.63 60.1 1
59.67 53.40
53.70 47.83
48.47 43.06
43.84 38.88
39.69 35.18
35.98 31.88
32.63 28.91
26.88 23.83
22.18 19.68
18.34 16.29
15.20 13.52
12.62 11.25
8.05 7.22
5.28 4.77
3.59 3.29
2.57 2.39
1.95 1.84
1.58 1.51
1.21 1.19
1.08 1.07
1.03 1.03
1.01 1.01
1.00 1.00
50 100 100.00 100.00
72.01 65.45
59.72 53.53
51.65 46.04
45.57 40.51
40.65 36.10
36.52 32.40
32.94 29.22
29.79 26.43
26.99 23.95
24.49 21.73
20.20 17.95
16.71 14.87
13.86 12.35
1 1.53 10.29
9.62 8.61
6.23 5.62
4.17 3.80
2.92 2.70
2.17 2.03
1.71 1.62
1.43 1.38
1.16 1.14
1.06 1.05
1.02 1.02
1.01 1.01
1.00 1.00
S.(t) is the expected number of segregating sites among a sample
of n DNA sequences. Especially, &(t) is equal to the expectation of
the average number of (pairwise) nucleotide differences between
DNA sequences sampled.
P o p u l a t i o n s i z e
I I
O T
T i m e i n g e n e r a t i o n s
FIGURE 1 .-The bottleneck model.
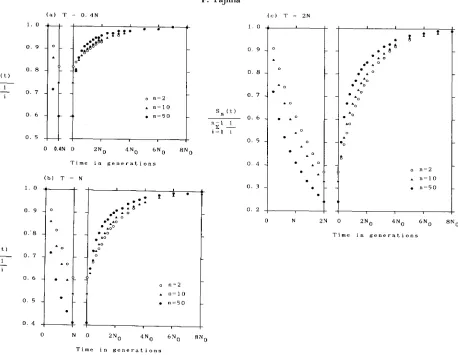
original size. For the values of T , 0.4N, N , and 2N are used. In all the cases examined, larger reduction of
( a ) T - 0. 4 N ( c ) T ~ 2 N
1. 0
0 . 6
0 . 5
0 O.4N 0 2 N 0 4 N 0 6 N 0 8 N 0
T i m e i n g e n e r a t i o n s
( b ) T = N
1 . 0
0 . 9
0 . 8
0 . 7
s n ( t ) 0. 6
n - 1 1 i = l z - i
0 . 5
0 . 4 4-
i
.
-0 . o- *O
6
o n = 2
A n = 1 0
.
n = 5 0I - a t i o n s
FIGURE Z.-ReIationship between S,(t)/C:G' (l/i) and the number of generations after the recovery of population size. S.(t) is the expected
number of segregating sites among a sample of n DNA sequences. Especially, &(t) is equal to the expectation of the average number of
(pairwise) nucleotide differences between DNA sequences sampled. The bottleneck model is shown in Figure 1. The durations ( T ) of
bottleneck are (a) 0.4N. (b) N, and (c) 2N generations. 4N0v = 1 and 4Nv = 0.01 are assumed. When points and A (and 0) are close to
each other, only point is plotted in order to avoid confusion. Point 0 is eliminated when it is close to point A.
DISCUSSION
In this paper the formulae for computing the ex- pected number of segregating sites and the expecta- tion of the average number of nucleotide differences among DNA sequences sampled from a population, which is not in equilibrium, have been developed. T h e results obtained indicate that the number of segregat- ing sites is influenced by the size of current population more strongly than is the average number of nucleo- tide differences, while the average number of nucleo- tide differences is affected by the size of original population more severely than is the number of seg- regating sites. T h e relationship between the two num- bers is quite similar to the relationship between het- erozygosity and the number of alleles. In fact hetero- zygosity and the number of alleles obtained from the infinite allele model are equivalent to the average number of nucleotide differences and the number of segregating sites obtained from the infinite site model, respectively.
Recently, TAJIMA ( 1 989) has developed a statistical method for testing the neutral mutation hypothesis
by using the average number of nucleotide differences and the number of segregating sites. This method, however, assumes that a population is in equilibrium.
As he has indicated, we must consider whether the population used is in equilibrium or not when we apply this method. In fact, if the population experi- enced a bottleneck recently, then this method may falsely reject the neutral hypothesis. This might be avoided, however, if we apply this method for several types of DNA polymorphism separately; for example, coding region us. noncoding region, nucleotide poly- morphism vs. insertion/deletion polymorphism, mi- tochondrial DNA vs. nuclear DNA, and so on.
I thank B. S. WEIR and two anonymous reviewers for their
valuable suggestions and comments.
LITERATURE CITED
CHAKRABORTY, R., and M. NEI, 1977 Bottleneck effects on aver- age heterozygosity and genetic distance with the stepwise mu-
tation model. Evolution 31: 347-356.
HUDSON, R. R., 1983 Testing the constant-rate neutral allele
Change in Population Size 60 1
KIMURA, M., 1968 Evolutionary rate at the molecular level. Na-
ture 217: 624-626.
KIMURA, M., 1969 The number of heterozygous nucleotide sites
maintained in a finite population due to steady flux of muta-
tions. Genetics 61: 893-903.
KIMURA, M., 1983 The Neutral Theory of Molecular Evolution.
Cambridge University Press, London.
KINGMAN, J. F. C., 1982 On the genealogy of large populations.
J. Appl. Probab. 1 9 A 27-43.
LI, W.-H., 1977 Distribution of nucleotide differences between two randomly chosen cistrons of a finite population. Genetics
MARUYAMA, T., and P. A. FUERST, 1984 Population bottlenecks
and nonequilibrium models in population genetics. I . Allele
numbers when populations evolve from zero variability. Ge-
netics 108: 745-763.
MARUYAMA, T., and P. A. FUERST, 1985a Population bottlenecks
and nonequilibrium models in population genetics. 11. Number
of alleles in a small population that was formed by a recent
bottleneck. Genetics 111: 675-689.
85: 331-337.
MARUYAMA, T., and P. A. FUERST, 1985b Population bottlenecks
and nonequilibrium models in population genetics. 111. Genic
homozygosity in populations which experience periodic bottle-
necks, Genetics 11 1: 69 1-703.
NEI, M., T . MARUYAMA and R. CHAKRABORTY, 1975 The bottle-
neck effect and genetic variability in populations. Evolution 2 9
1-10.
TAJIMA, F., 1983 Evolutionary relationship of DNA sequences in
finite populations. Genetics 105: 437-460.
TAJIMA, F., 1989 Statistical method for testing the neutral muta-
tion hypothesis by DNA polymorphism. Genetics 123: 585-
595.
WATTERSON, G. A., 1975 On the number of segregating sites in
genetic models without recombination. Theor. Popul. Biol. 7:
256-276.
WATTERSON, G. A., 1986 The homozygosity test after a change
in population size. Genetics 112 899-907.