Development of a Model for Lathe Machine’s
Installation, Completion Time and Due Date
Prediction
Akinnuli B. O
1, I. A. Daniyan
2, A. O. Adeodu
3,
I. E. Elemure
4Department of Mechanical Engineering, Federal University of Technology, Akure, Nigeria1
Department of Mechanical & Mechatronics Engineering, Afe Babalola University, Ado-Ekiti, Nigeria2,3,4
ABSTRACT: The installation and commissioning of machine tools such as the Lathe machine is very vital. Proper installation ensures appropriate functioning of equipment which minimizes chances of machine failure. Over the years, the prediction of completion time and due dates of installing and commissioning machine tools have been approached unscientifically with methods ranging from guessing to brainstorming. However, these methods were found to be unreliable and causing lots of disappointment to manufacturing companies which results in delay during installation and commissioning with attendant increase in cost implications. This study makes use of a very efficient and reliable scientific approach to develop a model that can predict the due date for lathe machine installation. Activities involved in machine installation and commissioning were first identified and critical path method was applied to predict the due date for installation and commissioning of the machine tools. The software programming language used for the prediction is MATLAB: an efficient and reliable software with Artificial Neural Network conditions (ANN), simulation model and set of data generated during the installation and commissioning of lathe machine which were iteratively trained in a MATLAB R.2010 environment. The results of the predictive model were found to be highly promising. It has almost the same value when compared to manual calculations. This conclusively confirmed that the model is a veritable and vital tool in predicting the completion time and due dates. This model will find its application in all manufacturing industries that machine installations affect their production.
KEYWORDS: Artificial Neural Network, Completion time, Critical Path, Due Dates and Simulation Model
I. INTRODUCTION
Meeting due dates is one of the most important objectives in scheduling (Gordon et al. 2002). Accurate prediction of installation time of machine tools enhances production scheduling and forecasting as this ensures machine tool delivery for commissioning meets targets and deadlines. It also helps develop best practices to improve production capacities, quality, reliability and man-machine interaction. Commissioning verifies that was specified and procured was installed; that it functions properly and that it was successfully turned over to the user and reasonably ensures the next step: verification for regulated industries would be successful (Blackburn, 2012).
Over the years, the prediction of completion time and due dates of installing and commissioning machine tools have been done unscientifically via guessing, executive meetings, brainstorming etc which was found to be unreliable causing lots of disappointment, which results in delay during installation and commissioning with attendant cost implications.
Prediction of machine tools installation time is a cost reduction initiative, besides it provides means of evaluation of potential safety and hazards and assist in the elimination of these hazards. This prevents delay along critical path and foster safe and healthy work environment via identification and control of risk associated with machine installation and commissioning.
II. LITERATURE REVIEW
Machine tools are devices for cutting materials (mostly metals), to impart them the required shape (Joshi et al., 2007, Adekoya, 2010). They have an in built arrangement that facilitates the use of various type of detachable cutting tools that can be changed to suit the task in hand, and removed for replacement or re-sharpening after wear. The cut off material obtained is usually in form of chips.
2.1 Installation Procedure Procedures to include:
1. pre-installation activities 2. installation activities
3. use of moving equipment to move and position the machine 4. use of metrology instruments to measure and test the equipment 5. making mechanical and electrical connections
6. troubleshooting, checking and testing activities
7. completing relevant paperwork Commissioning is a well-planned, documented and managed engineering approach to the start up by eliminating problems up front and turnover of facilities, systems and equipment to the end users that result in a safe and functional environment that meets established design requirement and stakeholder expectation. That is, commissioning verifies what was specified was installed, that it functions properly and it was successfully turned over to the user and reasonable ensures the next step verification for regulated industries would be successful. (Blackburn, 2012) It is a process by which an equipment, facility, or plant (which is installed, or is complete or near completion) is tested to verify if it functions according to its designobjectives or specifications.
In practice, the commissioning process comprises the integrated application of a set of engineering techniques and procedures to check, inspect and test every operational component of the project, from individual functions, such as instruments and equipment, up to complex amalgamations such as modules, subsystems and systems.
2.2 Methods of Prediction
There are several methods of predictions, some of which will be discussed below: guessing, brain storming, executive meeting etc.
1. Guessing
This type of prediction is almost like that of brainstorming but the difference is that the purchasing manager is left to predict a due-date for the equipment installation and commissioning time by guessing due to factors on ground concerning the equipment and depreciation status.
2. Brainstorming
A department or group of persons are tasked to predict a possible date, installation and commissioning could be made for procured equipment. A due-date that will suit the installation and commissioning of the equipment would be made by this group.
3. Executive Meeting
4. Qualitative tools for due date prediction
The methods mentioned above are unreliable and cause a lot of disappointment to manufacturing companies that result to a lot of delay in installation and commissioning and make them loose a lot of money within a very short time. A very good scientific approach to due date prediction is needed, for a scientific objective (or combined set of objectives) and an environment which is also specified and deterministic, an optimal allocation of resources will exist (coincidentally, there may be two or more optimal). The possibility of a solution derived by analysis as applied to search is therefore an attractive proposition. Over the last two decades there have been more example of analytically derived optima in organisation of many kinds of solution that can be obtained to problems of queuing, stock control, replacement etc. and the operational effectiveness of organisation in very many cases have been improved significantly.
According to Akinnuli and Aderoba, (2000), there are applicable methods of optimizing due-date prediction for equipment procurement some of them are: network analysis, decision theory and empirical model for job shop flow time and due-date prediction.
III. METHODOLOGY
Table 3.1: Installation Activities for Lathe Machine
Activit ies
Precedence Description Duration (days)
A - Pre- installation activities
5
B A Arrival of the machine tools into the central
workshop
1
C B Removal of the machines from the
pallet boxes
1
D B Exercises involving check, and inspection of
the machine tools
1
E B Use of transport equipment in moving machine tools to correct
positions
3
F C Assembly of all subparts
2
G E Making connections 1 H G Testing all installation
works
1
I D F H Proper check, inspection and testing
activities
1
J I Completion of the relevant paper work
Fig. 3.1: Network Analysis for Lathe Installation
The initial path A-B-E-G-H-I-J The non- critical path are C, D and F The float for this analysis is as follows:
Table 3.2: Float Analysis for Lathe Machine Installation
Ac tiv iti es
LS T
ES T
F l o a t s
EF T a
LFT b
Nor mal dura tion (m)
Expecte d time
E=
(𝒂+𝟒𝒎+𝒃) 𝟔
Varian ce
[𝒃 − 𝒂
𝟔 ]
𝟐
A 0 0 0 5 5 5 5 0 B 5 5 0 6 6 1 2.66 0 C 8 6 2 7 9 1 3.33 0.11 D 10 6 4 7 11 1 3.66 0.44 E 6 6 0 9 9 3 5 0 F 9 7 2 9 11 2 4.66 0.11 G 9 9 0 10 10 1 4 0 H 10 10 0 11 11 1 6.5 0 I 11 11 0 12 12 1 4.66 0 J 12 12 0 14 14 2 5.33 0
LST-Latest Start Time EST-Earliest Start Time EFT-Earliest Finish Time LFT-Latest Finish Time SPT- Shortest Processing Time EDD-Expected Due Dates
In many realistic scheduling environments, a job’s processing time may be depending on its position in the sequence (Bachman and Janiak, 2004) cited by Zhao et al., (2014).
Table 3.3: Lathe Installation Activities and Processing Time
Activities
j
A B C D E F G H I JProcessing time (days)
5 1 1 1 3 2 1 1 1 2
No of jobs: 10
Table 3.4: Lathe Installation Activities and Processing Time as Per SPT Ordering
Activities B C D G H I F J E A Processing time
(days)
1 1 1 1 1 1 2 2 3 5
Therefore job sequence is as follows: B-C-D-G-H-I-F-J-E-A
Computation of Mean Flow Time
F
Table 3.5: Mean Flow Time for Lathe Installation Activities
Activiti es
j
B C D G H I F J E A
Processi ng time (days)
1 1 1 1 1 1 2 2 3 5
Comple tion time
c
j1 2 3 4 5 6 8 10 13 18
F
1
1
nj i
f
n
F
St
10
1
1
(1 2 3 4 5 6 8 10 13 18)
10
i
1
(70)
10
F
7
F
days
Therefore, the optimal mean low time is 7 days
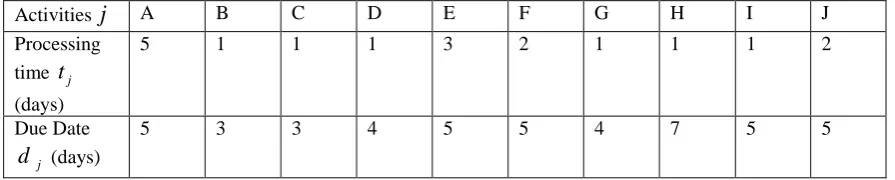
Table 3.6: Lathe Installation Activities and Due Date
Activities
j
A B C D E F G H I J Processingtime
t
j(days)
5 1 1 1 3 2 1 1 1 2
Due Date
j
d
(days)5 3 3 4 5 5 4 7 5 5
Table 3.7: Lathe Installation Activities and Completion Time
Jobs
j
B C D G A E F I J HDue dates
j
d
(days)3 3 4 4 5 5 5 5 5 7
Processing time
t
j(days)
1 1 1 1 5 4 3 1 2 1
Completion time
c
j(days)
1 2 3 4 9 13 16 17 19 20
Lateness
l
j(days)
-2 -1 -1 0 4 8 11 12 4 13
Tardy/Non tardy (1/0)
0 0 0 0 1 1 1 1 1 1
The EDD sequence is B-C-D-G-A-E-F-I-J-H. From the last row in table 3.7, 0 means corresponding job is untardy and 1 means that the corresponding job is tardy. There are six tardy jobs, the first is in the fifth column (k=5)
The maximum lateness value is 13, so this EDD sequence gives the minimum value for
L
maxwhich is equal to 13. Insome situations, the tardiness penalties depend on whether the jobs are tardy, rather than how late they are. In these cases, the number of tardy jobs should be minimized (Yin et al. 2013) cited by Zhao et al., 2014.
Resilient back propagation is employed in training the network because its algorithm is one of the fastest for this purpose (Shifmann et al., 1994, Rocha et al., Kumar and Zhang 2006 and Almeida et al., 2010 as cited by Gunther and Fritsch 2010.
The algorithm employed for training the data set is the Levenberg Marquardt algorithm.
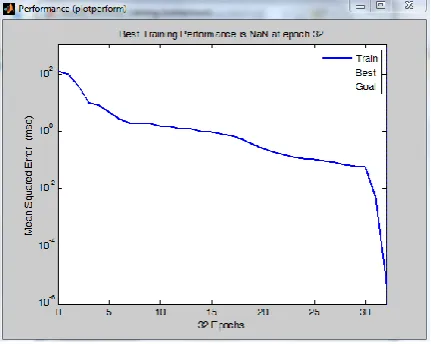
Fig. 4.2: Training State
Fig. 4.3: Output- Target Graph
After 32 iterations, the target was reached as shown in Fig. 4.1 with the line cutting across the vertical axis of performance training graph. The negligible value of the Mean Square Error (MSE) from Fig. 4.1 and the linearity of the regression graph from Fig. 4.4 is an indication that the Artificial Neural Network is highly efficient and that the network is well trained with predicted values in agreement with calculated values..
The degree of correlation will be significant if correlation coefficient r is close or equal to 1. From Fig. 4.4, the coefficient of correlation r is 1, this confirms that there is good agreement between the input, target and predicted results. From Fig. 4.4: there is no deviation of data points from the line of best fit indicating that there is high degree of correlation between calculated and predicted values.
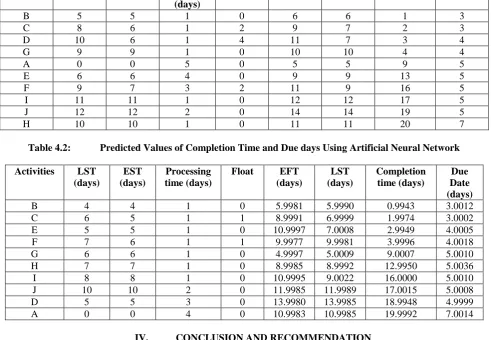
Comparing table 4.1 and 4.2, predicted values were very close to the calculated values an indication of the viability of the predictive model.
Table 4.1: Values of Completion Time and Due days Using Manual Calculation
Activities LST (days) EST (days) Processing time (days)
Float EFT (days) LST (days) Completion time (days) Due Date (days)
B 5 5 1 0 6 6 1 3
C 8 6 1 2 9 7 2 3
D 10 6 1 4 11 7 3 4
G 9 9 1 0 10 10 4 4
A 0 0 5 0 5 5 9 5
E 6 6 4 0 9 9 13 5
F 9 7 3 2 11 9 16 5
I 11 11 1 0 12 12 17 5
J 12 12 2 0 14 14 19 5
H 10 10 1 0 11 11 20 7
Table 4.2: Predicted Values of Completion Time and Due days Using Artificial Neural Network
Activities LST (days)
EST (days)
Processing time (days)
Float EFT (days) LST (days) Completion time (days) Due Date (days) B 4 4 1 0 5.9981 5.9990 0.9943 3.0012 C 6 5 1 1 8.9991 6.9999 1.9974 3.0002 E 5 5 1 0 10.9997 7.0008 2.9949 4.0005 F 7 6 1 1 9.9977 9.9981 3.9996 4.0018 G 6 6 1 0 4.9997 5.0009 9.0007 5.0010 H 7 7 1 0 8.9985 8.9992 12.9950 5.0036 I 8 8 1 0 10.9995 9.0022 16.0000 5.0010 J 10 10 2 0 11.9985 11.9989 17.0015 5.0008 D 5 5 3 0 13.9980 13.9985 18.9948 4.9999 A 0 0 4 0 10.9983 10.9985 19.9992 7.0014
IV. CONCLUSION AND RECOMMENDATION
5.1 Conclusion
The objective of this project was met at the end of this research work. The following inferences and conclusions were deduced after the successful completion of this research work.
b) Critical paths in machine installation and commissioning were also identified and critical path method was employed in predicting the due date for installation and commissioning procured equipment (a) above;
c) The developed algorithm and software for implementing the critical path method were highly efficient; d) The predictive model for the prediction of completion time and due-date of machine tools was developed, because the artificial neural network employed could closely predict values of due-dates having studied the interaction among imputed values
e) The calculated values were very close to the predicted values for each of the selected machines. Thus it can be concluded that the training of data set was effectively and successfully carried out and the model is a veritable tool for prediction of due-date.
f) From all the negligible values gotten from mean square error, it can be inferred that data were properly trained and the calculated values are not far from the predicted values.
5.2 Recommendations
The following are recommended in case this work may be carried out in future;
1) Emphasis should be made on the application of MATLAB software in Mechanical Engineering courses, as it offers divers solution to vast problems in the field.
2) The application of this research should be extended to other machine tools
REFERENCES
1. Adekoya L. O (2010) “Lecture note on Design and Manufacturing of Machine Tools”, Unpublished pp1-10, Department of Mechanical
Engineering, Obafemi Awolowo University, Ile-Ife.
2. Akinnuli B. O and Aderoba A. A (2000): Emperical Model for Job-Shop Flow Time and Due-Date Perdition”, Nigeria Journal for Engineering
Management. Besade publishing, Ondo, Ondo State, Nigeria Pp. 42-46.
3. Almeida, C., Baugh, C., Lacey, C., Frenk, C., Granato, G., Silva, L., and Bressan, A. (2010). Modelling the dsty Universe i: Introducing the
Artificial Neural Network and First Application to Luminosity and Colour Distributions. Monthly Notices of the Royal Astronomical Society. 402: 544-564
4. A. Bachman and A. Janiak (2004) “Scheduling jobs with position-dependent processing times,” Journal of the Operational Research Society,
vol. 55, no. 3, pp. 257–264.
5. Blackburn T.D. (2012): Commissioning Fundamentals and a Practical Approach, pp.1-14
6. Gordon, J. Proth, and C. Chu (2002). “A survey of the state-of-the-art of common due date assignment and scheduling research,” European Journal of Operational Research, vol. 139, no. 1, pp. 1–25.
7. Gunther, F. and Fritsch, S. (2010). Neuralnet: Training of Neural Networks. Research Journal Vol. 2(1): 30-39.
8. Joshi, P.H. (2007) “Machine Tools and Handbook” Design and Operation, Tata Mc Graw-Hill Publishing Company Ltd, New Delhi pp.1-30.
9. Kumar, A. and Zhang, A. (2006). Personal Recognition Using Hand Shape and Texture. IEEE Transaction on Image Processing 15:2454-2461.
10. Panneerselvam, R. (2002). Design and Analysis of Algorithm. PHI Learning PVT Ltd., pp. 300-340
11. Rocha, M., Cortez, P. and Neves, J. Evolutionary Neural Network Learning Lecture Notes in Computer Science. 2907:24-28.
12. Schifmann, W., Joost, M. and Werner, R. (1994). Optimization of the Back Propagation Algorithm for Training Multi-layer Perceptrons.
Technical Report. University of Koblenz, Institute of Physics.
13. Y. Yin, M. Liu, T. C. E. Cheng, C. Wu, and S. Cheng (2013) “Four single-machine scheduling problems involving due date determination decisions,” Information Sciences. An International Journal, vol. 251, pp. 164–181.
14. Chuan-Li Zhao, Chou-Jung Hsu, and Hua-Feng Hsu (2014). Single Machine Scheduling and Due Date Assignment with
Past-Sequence-Dependent Setup Time and Position-Past-Sequence-Dependent Processing Time
15. The Scientific World Journal
16. Volume 2014 (2014), Article ID 620150, pp. 1-9.