PHYSICAL ACTIVITY AND MEDIA ENVIRONMENT AS ANTECEDENTS OF CHILDHOOD
OBESITY IN MALAYSIA
AMUTHAGANESH MATHIALAGAN
1*, NARKEERAN NALLASAMY
2, SYAZA NURFARIDA RAZALI
21Department of Clinical Pharmacology, Perdana University, Royal College of Surgeons, Ireland School of Medicine, 43400 Serdang,
Malaysia. 2Department ofMedicine, Perdana University, Royal College of Surgeons, Ireland School of Medicine, 43400 Serdang, Malaysia.
Email: amuthan@pu-rcsi.edu.my
Received: 15 January 2017, Revised and Accepted: 29 May 2018 ABSTRACT
Objective: The aim of this study was to explore the influence of physical activity and media viewing on the occurrence of childhood obesity in Malaysia. Methods: A42-item validated questionnaire in the Malay and English language, containing Likert scale close-ended questions was used to explore the degree of physical activity practiced by families as well as trends on media viewing restrictions among parents in 5 selected states of Peninsular Malaysia. A total of 1200 self-administered questionnaires were sent out to schools in rural and urban areas of the respective 5 states and body mass index (BMI) for children was measured using the WHO 2007 reference standards. A total of 802 completed and usable questionnaires were obtained yielding a response rate of 66.6%. Chi-square and descriptive statistics were used to analyze the results.
Results: The findings revealed that while children may have agreed limits on media viewing (television/computer/video games), as the child’s BMI increased the rate of agreed limits decreased. However, the enforcement of these limits was not consistent. Interestingly, 70% of the parents who did not enforce restrictions on media viewing were also obese themselves. In terms of physical activity, this was far lower among obese and severe obese children and family activities involving physical activity was scarce with a rate of 25%.
Conclusion:The study affirms the fact that Malaysia needs to promote engagement in physical activity as a national policy and shows that the importance of enforcing media viewing restrictions should be highlighted to the community at large.
Keywords: Childhood obesity, Media viewing, Physical activity, Malaysia, Socioeconomic status.
INTRODUCTION
Currently, obesity is an important public health concern in many countries around the world. Obesity is a proven risk factor for a number of chronic conditions, which include cardiovascular disease (hypertension, hypercholesterolemia, stroke, etc.), diabetes, and even certain types of cancers [1,2]. One of the most closely related of these conditions to obesity is diabetes, so it is therefore of great concern that there is evidence of increasing incidence of diabetes in different countries throughout the world. This is presenting a significant burden on National Health care Systems and the situation is only predicted to get worse. Recently, the International Diabetes Foundation predicted an increase in the number of patients with diabetes from 240 million in 2007 to 380 million by 2025 [3,4]. This is consistent with the alarming rate of obesity prevalence across the world. In the United States, the prevalence is >30% of the adult population and has impacted productivity and health-care burden significantly [5,6]. Indeed in Europe, while there are regional differences, the prevalence is high among teenagers and children [7,8]. It is also of particular concern in children, especially when one considers that obesity levels have increased three-fold in this group recently and that childhood obesity is a major risk factor for obesity in adulthood [9,10]. This concern is not exclusive to developed countries, but it also an emerging plague in developing countries like Malaysia. In Malaysia, since 1996, the levels of overweight and obesity have increased significantly, particularly the obese group [11]. Indeed, in Malaysia, it has been estimated by the Malaysian Association for the Study of Obesity that approximately 30% of primary schoolchildren are either overweight or obese [12-15]. Childhood obesity is also associated with a number of comorbidities and adult conditions. It has been shown that childhood obesity increases the incidence of metabolic syndrome, Type II diabetes mellitus, cardiovascular disease, and even mental health problems [16-19].
The causes or risks for developing childhood obesity appear to be multifactorial including, among others, genetic and social/ environmental elements [20,21]. Within the environmental elements, factors such as food quality and intake, physical activity, video games, TV advertising, parental influence, and availability of dedicated play areas have all shown to have a negative impact on a child’s weight [22,23]. These strong predictors play a heavy role in exacerbating obesity in children. However, very minimal studies have been undertaken to review the combined role of media viewing and physical activity among Malaysian children. To the best of our knowledge, this is the first study to quantify the influence of media viewing among children and parents in Malaysia and also to correlate it with physical activity. Specifically, this study examined the influence of physical activity and screen time (both television and computers/games consoles) among of both normal, overweight and obese primary schoolchildren in Peninsular Malaysia.
METHODS
Study design and sample population
This was a cross-sectional study based on a survey of parents of school-going children in 5 states of Peninsular Malaysia. A list of government-owned schools was obtained from the Education Department of each respective state and the schools were stratified as urban or rural according to the classification by the Department of Statistics, Malaysia (DOSM). According to DOSM, an area with a population of more than 10,000 is classified as urban. Two schools were chosen randomly from the strata for each state to be included in the study. A sample population of 660 was deemed adequate to achieve 90% power at 0.05 significance [24]. To accommodate an acceptable response rate, 120 questionnaires were distributed in each school with the assistance of © 2018 The Authors. Published by Innovare Academic Sciences Pvt Ltd. This is an open access article under the CC BY license (http://creativecommons. org/licenses/by/4. 0/) DOI: http://dx.doi.org/10.22159/ajpcr.2018.v11i9.17095
the relevant schoolteachers. The questionnaire was taken home by the children to their respective parents and returned to the schoolteacher after 7 days. Those children whose parents agreed to participate in the study were measured using the Leicester method for height and weight [15]. Weight status was expressed as body mass index (BMI) for age according to WHO 2007 growth reference [25].
Study instrument
A 42-item validated questionnaire in the Malay and English language was adapted for the study. The questionnaire contained Likert scale close-ended questions which explored demographics, physical activity, and screen time measure. A pre-test of the instrument was conducted on 36 students aged 10–12 in a vernacular school in Puchong, Selangor. Slight modifications were made to the questionnaire based on results of the pre-test, in which a few questions were rephrased to enhance clarity. The revised questionnaire was used in the actual survey.
Data analysis and ethical considerations
Data were entered and analyzed in SPSS version 11.5. Chi-square tests for statistical significance of associations were computed along with correlation analysis for this study. Ethical approval for the study was obtained following institutional review and each participant was given an informed consent form before enlisting in the study.
RESULTS
A total of 802 responses were obtained from participants from both the rural and urban areas of the selected states for the study yielding a response rate of 66.6%. Various demographic variables were recorded in addition to measures of media viewing and physical activity.
For the first demographic variable of parents BMI, our results show that overweight and obese parents had a greater number of high BMI children, with the number in urban areas larger than that in rural areas (Table 1). The parents income indicated that parents with an annual income level of <RM 20,000 (low-income group) had the highest proportion of overweight and obese children, and the trend appeared to decrease as the income level increased, although the prevalence of childhood obesity was more evenly distributed among all levels of income in the urban area (Table 1). We also showed a link with the level of education, irrespective of the urban or rural environment. Both rural and urban low-educated parents, mostly at the primary and secondary level of education, had the highest number of overweight and obese children and that trend also decreased as the parents’ education level increased. Geographically, urban areas showed a higher proportion of obese children (36.5%), compared to rural areas (28.4%) though the proportions of overweight children were similar (7.5% vs. 7.4%, respectively).
Table 1: Relationship between children’s body mass index and the socioeconomic profile of their parents
Variable Children BMI
Normal (n=162) Overweight (n=119) Obese (n=440) Severe obese (n=111) χ2
Urban (n=483) Parent BMI
Underweight 2.1 (10) 0.2 (1) 1.4 (7) 0.6 (3) p<0.001
Normal 16.1 (78) 8.7 (42) 21.3 (103) 2.9 (14)
Overweight 7.0 (34) 2.3 (11) 14.1 (68) 3.1 (15)
Obese 1.2 (6) 1.2 (67) 8.3 (40) 7.0 (34)
Severe obese 0.4 (2) 1.2 (6) 1.2 (6) 0.6 (3)
Parent income level
Less than RM 10,000 11.0 (5) 4.1 (20) 15.3 (74) 2.1 (10) p<0.001
RM 10,000 to RM 19,000 4.1 (20) 6.4 (31) 12.2 (59) 2.3 (11)
RM 20,000 to RM 50,000 6.8 (33) 1.9 (9) 8.5 (41) 7.2 (35)
RM 51,000 to RM 100,000 3.9 (19) 0.0 (0) 8.5 (41) 2.5 (12)
Greater than RM 100,000 1.0 (5) 0.0 (0) 1.9 (9) 0.2 (1)
Parent education level
Primary school 2.5 (12) 2.9 (14) 5.0 (24) 1.0 (5) p<0.001
Secondary school 6.2 (30) 5.8 (28) 24.4 (118) 6.8 (33)
Diploma 9.7 (47) 2.1 (10) 9.5 (46) 3.9 (19)
Degree 5.8 (28) 1.7 (8) 6.8 (33) 2.1 (10)
Master’s degree 2.7 (13) 0.0 (0) 0.6 (3) 0.4 (2)
Ph. D 0.0 (0) 0.0 (0) 0.0 (0) 0.0 (0)
Rural (n=319) Parent BMI
Underweight 1.3 (4) 0.0 (0) 0.6 (2) 0.3 (1) p<0.001
Normal 6.3 (20) 10.0 (32) 24.1 (77) 5.3 (17)
Overweight 1.6 (5) 6.0 (19) 16.6 (53) 2.8 (9)
Obese 0.3 (1) 2.5 (8) 16.0 (51) 4.1 (13)
Severe obese 0.6 (2) 0.0 (0) 0.9 (3) 0.6 (2)
Parent income level
Less than RM 10,000 3.8 (12) 7.5 (24) 31.3 (100) 7.5 (24) p<0.001
RM 10,000 to RM 19,000 1.6 (5) 8.2 (26) 14.1 (45) 2.2 (7)
RM 20,000 to RM 50,000 2.8 (9) 1.9 (6) 8.8 (28) 3.1 (10)
RM 51,000 to RM 100,000 1.9 (16) 0.9 (3) 2.5 (8) 0.0 (0)
Greater than RM 100,000 0.0 (0) 0.0 (0) 1.6 (5) 0.3 (1)
Parent education level
Primary school 0.9 (3) 3.4 (11) 16.3 (52) 2.8 (9) p<0.01
Secondary school 3.4 (11) 10.7 (34) 25.7 (82) 7.8 (25)
Diploma 3.4 (11) 2.8 (9) 6.9 (22) 1.6 (5)
Degree 1.6 (5) 0.9 (3) 8.5 (27) 0.9 (3)
Master’s degree 0.6 (2) 0.6 (2) 0.9 (3) 0.0 (0)
Ph. D 0.0 (0) 0.0 (0) 0.0 (0) 0.0 (0)
Our results showed an interesting trend on agreed media viewing limits. As illustrated in Fig. 1, there is an increasing trend of children with increasing BMI not having agreed limits on media viewing (television/ computer/video games) with their parents. Overweight children reported the lowest percentage of not having agreed limits (20.17%) whereas severe obese children had the highest rate at 39.64%. This means that parents of obese children were exerting less control of their children’s media viewing habits. In addition, even where such limits were in place, there was a decline in the level of enforcement on media viewing, inversely related to the increase in parents’ weight category (Fig. 2). Approximately 50% of parents with normal BMI often enforce limits on media viewing by their children, while around 80% of parent with high BMI rarely enforce those limits.
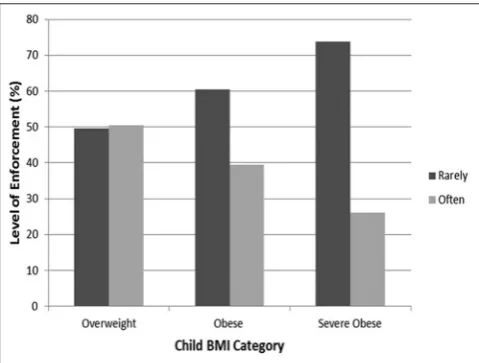
Similarly, there is a clear relationship between the level of enforcement and the child’s BMI, showing that as the child’s BMI increases, the level of enforcement by the parent of the media viewing limits decreases (Fig. 3). In overweight children, our study showed that in 49.58% of cases, the limits on media viewing were rarely enforced and that increased to 73.87% in severely obese children.
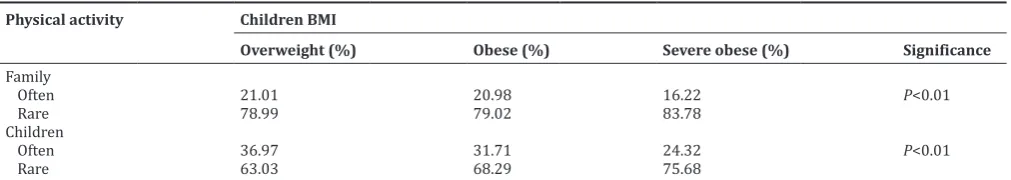
As parents are important role models for their children, it was of interest to look at the levels of physical activity in overweight and obese children, particularly as a family activity. Table 2 shows the results of the physical activity investigated across the child BMI. In the case of physical activity, as a family activity, there was a trend indicating a decline in the level of physical activity, as the child’s BMI category increased from overweight to severe obese. Overweight children seemed to have the highest family physical activity (21.01%) when compared to the severely obese children (16.22%). As one might predict, there was also a reduction in the child’s physical activity as their weight increases to severe obesity. There was no relationship between the level of the child’s obesity and the parental physical activity, but in general, parent’s physical activity was low (approx. 75% of parents reported rarely partaking in physical exercise). However, as role models for their children, this could still have a negative impact on their children.
DISCUSSION
The aim of this study was to explore the influence of physical activity and media viewing on the occurrence of childhood obesity in Peninsular Malaysia. In general, the study showed that enforcement of limits on media viewing in high BMI children is lacking and physical activity as a family activity is not practiced widely.
Demographics
In this study, we explored the impact of socioeconomic background in urban and rural populations on childhood obesity. In general, our findings highlighted the fact that urban areas are at higher risk for obesity in comparison to their rural counterparts. This is mainly due to the impact of the scenario of the “obesogenic environment.” The term “obesogenic environment” refers to “an environment that promotes gaining weight and one that is not conducive to weight loss” within the home or workplace [26]. In other words, the “obesogenic environment” refers to an environment that helps or contributes to obesity. An example of this would be the accessibility to and consumption of fast food in urban areas of Malaysia. The accelerated pace of industrialization and urbanization in recent decades has inevitably brought about changes in the lifestyle of Malaysians [27]. Fast food consumption has become a norm in the urban area as individuals seek to avoid the wastage of time in their busy schedule [28]. Furthermore, fast food is easily accessible with the explosion of fast food outlets in the last 10 years in Malaysia, and this has caused parents to often opt for it as an alternative to cooking at home [29]. Working class people of urban areas such as Kuala Lumpur, Ipoh, and Johor Bahru are prone to utilize fast food outlets as their dinner options. This has caused fast food to become a common children’s diet for meals in urban areas [30]. Another interesting aspect to note would be the role of primary caregivers. In urban areas, the children are often looked after by either babysitters or grandparents and these primary caregivers play a major role in determining a child’s
eating habits in three-generation families. Studies have shown that when grandparents are looking after the kids, more often than not, dietary intake is increased [31]. Traditionally, large portions of food Fig. 1: Relationship between children’s body mass index status and the presence or absence of agreed limits on media viewing
with their parents
Fig. 2: Enforcement of media viewing limits by parents and the relationship with parent’s
were often encouraged as it was believed to be the best remedy for child growth. This has subsequently increased the likelihood of the child care providers giving children food that is highly caloric leading to obese conditions.
In terms of rural areas, our study showed that rates of obesity have increased in comparison to previous studies resulting in higher proportions of children being classed in the severe obese category [32]. A major reason for this development would be the socioeconomic status (SES) of rural inhabitants. SES has been demonstrated to be an indirect precursor of childhood obesity, particularly in lower income groups in the rural area [29,33]. Among the determinants of SES are parents’ levels of education as well as their household income [34]. Our study concluded that parents in rural areas with low-level education had higher BMI levels and their children were also likely to be obese. Education plays a major role in health preservation and instilling disease preventive practices. Low levels of education impede proper understanding of the dangers of the obesity and importance of taking precautionary measures to protect children dietary habits [35]. A study by the United States National Center for Health Statistics revealed that from 2007 to 2010, lower obesity rates for children of age 2 to 19 could be correlated with higher levels of education for the heads of their households [36]. In instances where the head of the household had less than a high school education, 24% of boys and 22% of girls were obese. This scenario is replicated in Malaysia as residents in rural areas possess lower formal education in comparison to their urban counterparts leading to definite lack of awareness toward health concerns [37]. Although continuous health campaigns have been conducted by governmental and various non-governmental organizations, a lack of strong understanding on the consequences of obesity has still been observed.
This study also revealed that children in lower-income families in both rural and urban areas were more susceptible to obesity although urban counterparts had a better distribution across all income categories. Families with low income are financially constrained in their efforts to maintain livelihood. Cost becomes a priority rather than health and nutrition [38]. An association between hunger and obesity may be explained by the relatively low cost of energy-dense foods, the high palatability of sweets and fats associated with higher energy intakes, and the association of lower-income families with food insecurity with lower intakes of fruit and vegetables [39]. Studies have found that healthier foods, generally, are more expensive and less readily available in poorer communities [40]. As pointed out by Kamphuis et al. (2007), inadequate intake of “premium food” (due to the expensive price) such as fruits and vegetables among lower SES groups are highly prevalent, when compared to higher SES groups who are able to consume the recommended 3–5 servings per day [41]. Crackers and junk food which are cheap and sweet with high calories are becoming common dietary practice among children in rural locations in Malaysia.
Media viewing
Our study revealed that parental agreed limits on media viewing are lacking among children with high BMI. Media viewing as explored in this study entailed watching television and playing computer or video games. Excessive media viewing have consistently shown to be
linked to increased BMI in both children and adults independent of physical activity [42]. In the recent years, media viewing has become a major pastime for Malaysians [43]. A particularly convenient and easy pastime to indulge in, television viewing and online engagements have become a family trend nowadays. This eventually leads to an unnoticed lack of control by parents on children’s exposure to media viewing. In the absence of this control, children become more attached to media viewing as a result of modeling their parents’ behavior. These scenarios have been illustrated before in signaling theories of parental behavior [44,45]. Children tend to stay indoors all day long after school, playing computer games, and watching the television rather than going outside to exercise or play sports following the footsteps of parents who enjoy watching television after working hours as opposed to engaging in outdoor activities [46]. This invariably leads to increased media viewing on the part of the children that subsequently leads to childhood obesity.
Another interesting revelation from this study was that Malaysian parents who do have agreed limits on media viewing do not necessarily enforce them. Agreed limits toward media viewing are important predictors in avoiding childhood developmental damage, but without adequate enforcement, these limits are meaningless [47]. A possible reason for this scenario may be the tendency for parent to seek ““temporary harmony.”” Limits serve as a standard for acceptable and unacceptable behavior and children will have a tendency to test it. This process of testing is highly unpleasant and in certain cases seems to border on hostility. This in turn can infuriate and frustrate the parents to a point that they give in just to achieve a temporary peace and truce [48]. Alternatively, parents relax their enforcement when they perceive the media viewing as a developmental and educational advantage. Parents are happy to allow children to have access to larger amount of screen time if it involves educational materials and thus represents a virtual babysitter-tutor role for the family [49]. However, screen time guidelines in the US and Australia have, time and again, propagated that any exposure to screen time that exceeds 2 h a day is associated with long-term risks of obesity and heart problems [50]. This notion of “healthy screen time” by parents need to addressed and clarified to enable the optimum health preservation of children.
Physical activity
This study also revealed low levels of physical activity by families in both urban and rural areas of Peninsular Malaysia. The challenge of motivating children and their families to be physically active is a growing concern in pediatric health. Studies show that low levels of physical activity are related to poor cardiovascular fitness and increased adiposity [51]. Rates of peer victimization, low self-esteem, and depression have also been found to be higher among inactive children [52]. Notwithstanding the fact that high screen time impedes the ability to participate in physical activities, socioeconomic factors also prevent families from making physical activity a daily practice. Personal safety and increasing living costs are possible problems impeding physical activity as a family activity. Despite a decline in the crime rate over the last 10 years, Malaysians still show levels of insecurity regarding outdoor activities [53]. Often, the parent’s preference is for children to stay indoors and at home during weekdays and only venture outdoors during weekends, with the view that this is Table 2: Relationship between family and children’s physical activity compared with children’s body mass index status
Physical activity Children BMI
Overweight (%) Obese (%) Severe obese (%) Significance
Family
Often 21.01 20.98 16.22 P<0.01
Rare 78.99 79.02 83.78
Children
Often 36.97 31.71 24.32 P<0.01
Rare 63.03 68.29 75.68
for safety. Even activities such as children walking or cycling to nearby schools are discouraged due to high frequency of kidnapping and snatch theft incidences [54]. These measures, although carried out with good intentions, prevent children from actively engaging in physical activity on a routine basis. Another important factor in emphasizing physical activity among children is the role of schools. Children spend the majority of their days at school and parents have a tendency to assume that their children meet their daily requirements for physical activity at school [55]. Certainly, the exposure that children get to physical education in Malaysian schools is far from satisfactory and very limited, ranging from only 1 h–2 h/week [37]. This is primarily due to the low emphasis on physical education in the curriculum and the shortage of trained physical education teachers [56]. Indeed, the American Academy of Pediatrics has recommended that children engage in at least 60 min of physical activity daily and parents should not assume that schools are an avenue to fulfill this quota [57].
Recommendations
As this paper explored obesity trends in both the urban and rural communities of Peninsular Malaysia, the recommendations presented here are primarily directed toward community-based interventions, rather than individual or clinical setting-based policies. An important community strategy for this conundrum would be community-wide education. Campaigns on importance of physical activity and reduction of screen time have been shown to be an effective measure to curb obesity [58]. Community-wide education is important in creating awareness of parents to the dangers of obesity, excessive screen time, and the importance of having daily physical activity for children. The importance of setting limits on media viewing and adequately enforcing them should be highlighted to both rural and urban families in the battle to curb obesity. Another important measure that should be considered is policymaking that curbs obesogenic environments. Governments should formulate policies that give easier access by communities to parks and safe activity environments. Safety should become a major priority to encourage parents and children to become more involved in outdoor activities. Physical activity promotional schemes should be undertaken by corporate sector also to help battle obesity. Finally, school-based emphasis on physical activity should be strengthened. Curricula should be modified to increase the amount of time students spend in physical education classes. New strategies, such as teaching games for understanding, should be utilized to increase interest of students in physical education and to ensure that this interest is sustained into their adolescent years [59].
CONCLUSION
Childhood obesity is becoming a new multifactorial plague that needs to be addressed seriously. This study shows a major significant behavior associated with this phenomenon lies in decreased physical activity and increased screen time among Malaysian children both in urban and rural areas. Furthermore, certain socioeconomic and environmental factors also act as agents of obesity. Serious and immediate interventions are needed to ensure that the increase in childhood obesity in Malaysia can be curtailed.
CONFLICT OF INTEREST
The authors declare no conflict of interest.
REFERENCES
1. Flegal KM, Carroll MD, Ogden CL, Curtin LR. Prevalence and trends in obesity among US adults, 1999-2008. JAMA 2010;303:235-41. 2. Berghöfer A, Pischon T, Reinhold T, Apovian CM, Sharma AM,
Willich SN, et al. Obesity prevalence from a european perspective: A systematic review. BMC Public Health 2008;8:200.
3. Tee ES. Obesity in Asia: Prevalence and issues in assessment methodologies. Asia Pac J Clin Nutr 2002;11 Suppl 8:S694-701. 4. IDF. International Diabetes Federation. Diabetes Atlas. Brussels,
Belguim: International Diabetes Federation; 2011.
5. Haslam DW, James WP. Obesity. Lancet 2005;366:1197-209.
6. Malnick SD, Knobler H. The medical complications of obesity. QJM 2006;99:565-79.
7. Orpana HM, Berthelot JM, Kaplan MS, Feeny DH, McFarland B, Ross NA. BMI and mortality: Results from a national longitudinal study of Canadian adults. Obesity (Silver Spring) 2010;18:214-8. 8. Cowie CC, Rust KF, Ford ES, Eberhardt MS, Byrd-Holt DD, Li C, et al.
Full accounting of diabetes and pre-diabetes in the U.S. Population in 1988-1994 and 2005-2006. Diabetes Care 2009;32:287-94.
9. Hadidchi MS, Shenoy UV, Thomas JM, Vupputuri RS. Study awareness among healthcare providers for the need to periodically screen renal functions in diabetic patients receiving metformin. Int J Curr Pharm Res 2015;7:51-3.
10. Serdula MK, Ivery D, Coates RJ, Freedman DS, Williamson DF, Byers T. Do obese children become obese adults? A review of the literature. Prev Med 1993;22:167-77.
11. IPH Institute of Public Health. The Second national health and morbidity survey 1996. vol 14. In: Nutritional Status of Adults Aged 18 Years and above Ministry of Health M, editor. Kuala Lumpur: Institute of Public Health; 1997.
12. Chhatwal J, Verma M, Riar SK. Obesity among pre-adolescent and adolescents of a developing country (India). Asia Pac J Clin Nutr 2004;13:231-5.
13. Blebil AQ, Hassan Y, dujaili JA, Aziz NA. Pattern of dyslipidemia in type 2 diabetic patients in the state of Penang, Malaysia. Int J Pharm Pharm Sci 2012;4:305-8.
14. Strauss RS, Pollack HA. Epidemic increase in childhood overweight, 1986-1998. JAMA 2001;286:2845-8.
15. Sharifah WW, Nur HH, Ruzita AT, Roslee R, Reilly JJ. The Malaysian childhood obesity treatment trial (MASCOT). Malays J Nutr 2011;17:229-36.
16. Wee BS, Poh BK, Bulgiba A, Ismail MN, Ruzita AT, Hills AP. Risk of metabolic syndrome among children living in metropolitan Kuala Lumpur: A case control study. BMC Public Health 2011;11:333. 17. Daniels SR, Arnett DK, Eckel RH, Gidding SS, Hayman LL,
Kumanyika S, et al. Overweight in children and adolescents: Pathophysiology, consequences, prevention, and treatment. Circulation 2005;111:1999-2012.
18. Raitakari OT, Juonala M, Viikari JS. Obesity in childhood and vascular changes in adulthood: Insights into the cardiovascular risk in young finns study. Int J Obes (Lond) 2005;29 Suppl 2:S101-4.
19. Anderson SE, Cohen P, Naumova EN, Jacques PF, Must A. Adolescent obesity and risk for subsequent major depressive disorder and anxiety disorder: Prospective evidence. Psychosom Med 2007;69:740-7. 20. Herva A, Laitinen J, Miettunen J, Veijola J, Karvonen JT, Laksy K,
et al. Obesity and depression: Results from the longitudinal Northern Finland 1966 birth cohort study. Int J Obes (Lond) 2006;30:520-7. 21. Skelton JA, Irby MB, Grzywacz JG, Miller G. Etiologies of obesity in
children: Nature and nurture. Pediatr Clin North Am 2011;58:1333-54, ix.
22. Hills AP, Okely AD, Baur LA. Addressing childhood obesity through increased physical activity. Nat Rev Endocrinol 2010;6:543-9. 23. Tucker LA, Seljaas GT, Hager RL. Body fat percentage of children varies
according to their diet composition. J Am Diet Assoc 1997;97:981-6. 24. Krejcie R, Morgan, DW. Determining sample size for research
activities. Educ Psychol Meas 1970;30:607-10.
25. World Health Organisation. The World Health Organisation Multicenter Growth Reference Study. Geneva, Switzerland: World Health Organisation; 2007.
26. Swinburn B, Egger G, Raza F. Dissecting obesogenic environments: The development and application of a framework for identifying and prioritizing environmental interventions for obesity. Prev Med 1999;29 6 Pt 1:563-70.
27. Ismail MN, Chee SS, Nawawi H, Yusoff K, Lim TO, James WP. Obesity in Malaysia. Obes Rev 2002;3:203-8.
28. Johnson DB, Gerstein DE, Evans AE, Woodward-Lopez G. Preventing obesity: A life cycle perspective. J Am Diet Assoc 2006;106:97-102. 29. Jackson EA, Eagle T, Leidal A, Gurm R, Smolarski J, Goldberg C, et al.
Childhood obesity: A comparison of health habits of middle-school students from two communities. Clin Epidemiol 2009;1:133-9. 30. Anderson PM, Butcher KF, Levine PB. Maternal employment and
overweight children. J Health Econ 2003;22:477-504.
31. Jiang J, Rosenqvist U, Wang H, Greiner T, Lian G, Sarkadi A, et al.
Influence of grandparents on eating behaviors of young children in chinese three-generation families. Appetite 2007;48:377-83.
33. Wang Y, Lim H. The global childhood obesity epidemic and the association between socio-economic status and childhood obesity. Int Rev Psychiatry 2012;24:176-88.
34. Langnase K, Mast M, Muller MJ. Social class differences in overweight of prepubertal children in Northwest Germany. Int J Obes Relat Metab Disord 2002;26:566-72.
35. Davison KK, Birch LL. Childhood overweight: A contextual model and recommendations for future research. Obes Rev 2001;2:159-71. 36. NCHS. National Health and Nutrition Examination Survey, 2009–2010.
Centres for Disease Control/National Center for Health Statistics; 2012. 37. MoE. Educational Development Plan 2001-2010. Putrajaya, Malaysia:
Ministry of Education; 2001.
38. Booth ML, Wake M, Armstrong T, Chey T, Hesketh K, Mathur S, et al.
The epidemiology of overweight and obesity among australian children and adolescents, 1995-97. Aust N Z J Public Health 2001;25:162-9. 39. Ver Ploeg M, Mancino L, Lin BH. Food stamps and obesity: Ironic
twist or complex puzzle? Amber Waves 2006;4:32-9.
40. Darcey V, Quinlan JJ, Dale D. Comparison of the availability of healthy foods in low income and high income neighborhoods in Philadelphia. Ethn Dis 2009;19:S82-3.
41. Kamphuis CB, van Lenthe FJ, Giskes K, Brug J, Mackenbach JP. Perceived environmental determinants of physical activity and fruit and vegetable consumption among high and low socioeconomic groups in the Netherlands. Health Place 2007;13:493-503.
42. Inoue S, Sugiyama T, Takamiya T, Oka K, Owen N, Shimomitsu T. Television viewing time is associated with overweight/obesity among older adults, independent of meeting physical activity and health guidelines. J Epidemiol 2012;22:50-6.
43. Bindah EV, Nor Othman M. The role of family communication and television viewing in the development of materialistic values among young adults: A review. Int J Bus Soc Sci 2011;2:238-48.
44. Benabou R, Tirole J. Incentives and prosocial behavior. Am Econ Rev 2006;96:1652-78.
45. Dessi R. Collective memory, cultural transmission and investments. Am Econ Rev 2008;98:534-60.
46. Jago R, Fox KR, Page AS, Brockman R, Thompson JL. Parent and child physical activity and sedentary time: Do active parents foster active
children? BMC Public Health 2010;10:194.
47. Sigman A. Time for a view on screen time. Arch Dis Child 2012;97:935-42.
48. Jordan AB, Hersey JC, McDivitt JA, Heitzler CD. Reducing children’s television-viewing time: A qualitative study of parents and their children. Pediatrics 2006;118:e1303-10.
49. Brown A. Media use by children younger than 2 years. Pediatrics 2011;128:1040-5.
50. American Dental Hygienists’ Association. Education and prevention. In: Non-Productive Sedentary Behaviour. American Dental Hygienists’ Association. USA; 2011.
51. Ekelund U, Brage S, Froberg K, Harro M, Anderssen SA, Sardinha LB,
et al. TV viewing and physical activity are independently associated with metabolic risk in children: The european youth heart study. PLoS Med 2006;3:e488.
52. Storch EA, Milsom VA, Debraganza N, Lewin AB, Geffken GR, Silverstein JH, et al. Peer victimization, psychosocial adjustment, and physical activity in overweight and at-risk-for-overweight youth. J Pediatr Psychol 2007;32:80-9.
53. Chooi C. Malaysians Still Insecure Despite Drop in Crime Statistics. Malaysian Insider; 2012.
54. Ahlport KN, Linnan L, Vaughn A, Evenson KR, Ward DS. Barriers to and facilitators of walking and bicycling to school: Formative results from the non-motorized travel study. Health Educ Behav 2008;35:221-44.
55. Floriani V, Kennedy C. Promotion of physical activity in children. Curr Opin Pediatr 2008;20:90-5.
56. Hoe WE, Hua KP, Shaari JS. Needs Analysis of Physical Education Teachers in Malaysian Primary Schools. Malaysia: University Institute Technology Mara; 2004.
57. Tester JM. The built environment: Designing communities to promote physical activity in children. Pediatrics 2009;123:1591-8.
58. Ockene JK, Edgerton EA, Teutsch SM, Marion LN, Miller T, Genevro JL, et al. Integrating evidence-based clinical and community strategies to improve health. Am J Prev Med 2007;32:244-52. 59. Balakrishnan M, Rengasamy S, Aman MS. Effect of teaching games