DEVELOPMENT AND VALIDATION OF STABILITY INDICATING REVERSE-PHASE
HIGH-PERFORMANCE LIQUID CHROMATOGRAPHY METHOD FOR THE SIMULTANEOUS
QUANTIFICATION OF SAQUINAVIR, RITONAVIR, AND AMPRENAVIR
MANGAMMA KUNA
1*, GOWRI SANKAR DANNANA
21Department of Pharmaceutical Analysis, School of Pharmacy, JNTU-K and PhD Research Scholar, Andhra University, Visakhapatnam, Andhra Pradesh, India. 2Department of Pharmaceutical Analysis and Quality Assurance, University College of Pharmaceutical Sciences,
Andhra University, Visakhapatnam, Andhra Pradesh, India. Email: [email protected]
Received: 08 February 2018, Revised and Accepted: 21 March 2018
ABSTRACT
Objective: The objective of the study was to develop and validate a sensitive, precise, and accurate stability indicating reverse-phase (RP) high-performance liquid chromatography method for the quantification of saquinavir, ritonavir, and amprenavir simultaneously.
Methods: The determination of saquinavir, ritonavir, and amprenavir in their mixtures was done using a mobile phase consisted of 0.1M phosphate buffer (pH 3.5) and methanol (70:30, v/v). The method is based on the simultaneous separation of studied drugs in a RP Inertsil ODS C18 (4.6 mm×100 mm, 5 µm) column at ambient temperature. Detection and quantitation were achieved with photodiode array detector set at 260 nm.
Results: Saquinavir, ritonavir, and amprenavir showed linearity over a concentration range of 40–200 µg/ml (R2-0.9994), 20–100 µg/ml (R2-0.9992),
and 30–150 µg/ml (R2-0.9990), respectively. The limit of quantification was 0.64 µg/ml, 0.57 µg/ml, and 0.53 µg/ml for saquinavir, ritonavir, and
amprenavir, respectively. The accuracies for the three drugs were in the range of 99.40–100.53% (saquinavir), 99.45-100.47% (ritonavir), and 100.03–100.53% (amprenavir). The percentage relative standard deviations for the studied drugs were 0.785–0.848% (saquinavir), 0.338–0.499% (ritonavir), and 0.336–0.775% (amprenavir). No peaks were observed at the retention time of saquinavir, ritonavir, and amprenavir in placebo blank, mobile phase blank and stress degraded samples which suggested that the proposed was selective and specific.
Conclusion: The method was found to be suitable for the regular analysis of saquinavir, ritonavir, and amprenavir simultaneously in the presence of their stress degradation products.
Keywords: Saquinavir, Ritonavir, Amprenavir, HIV, Stress Degradation, Analysis.
INTRODUCTION
Saquinavir, chemically known as (2S)-N-[(2S,3R)-4-[(3S)-3- (tert-butylcarbamoyl)-decahydroisoquinolin-2-yl]-3-hydroxy-1-phenylbutan-2-yl]-2-(quinolin-2-ylformamido) butane diamide, is generally used in combination with other antiviral agents for the treatment of infections with human immunodeficiency virus [1]. It belongs to the class human immunodeficiency virus protease inhibitor. Saquinavir specifically inhibits human immunodeficiency virus protease I and II, and cytochrome P450 3A [2,3]. Human immunodeficiency virus protease I and II are involved in the process of viral replication and maturation. Saquinavir binds to the active site of human immunodeficiency virus protease I and II and inhibits the activity of the enzyme. This inhibition results in the development of inactive and defective viral particles.
Ritonavir, chemically known as 1,3-thiazol-5-ylmethyl N-[(2S,3S,5S)-3-hydroxy-5-[[(2S)-3-methyl-2-[[methyl-[(2-propan-2-yl-1,3-thiazol-4-yl)methyl]carbamoyl]amino] butanoyl] amino]-1,6-diphenylhexan-2-yl] carbamate, is an peptidomimetic agent that block the activities of human immunodeficiency viral I and II proteases, and also acts an inhibitor for cytochrome P450 3A [4]. Ritonavir is not an antiviral agent for hepatitis C virus infection. However, it is used in combination therapy for the treatment of hepatitis C virus infection as a booster [5,6]. Through inhibiting cytochrome P450 3A, ritonavir increases the plasma concentration of other protease inhibitors.
Amprenavir, chemically described as (3S)-oxolan-3-yl N-[(2S,3R)-3-
hydroxy-4-[N-(2-methylpropyl)(4-aminobenzene)sulfonamido]-1-phenylbutan-2-yl]carbamate, is an hydroxyl ethylamine sulfonamide synthetic derivative generally used in combination with other antiviral agents [7]. Amprenavir is used in the treatment and prevention of acquired immunodeficiency syndrome and human immunodeficiency virus infection. Amprenavir selectively binds and inhibits the action of human immunodeficiency virus protease [8,9]. The action of amprenavir toward the human immunodeficiency virus protease I is similar to that of saquinavir.
The chemical structures of the three studied drugs are presented in Fig. 1. The combination of saquinavir, ritonavir, and amprenavir is not officially listed in any pharmacopeia. However, there is no report to give information about the simultaneous determination of saquinavir, ritonavir, and amprenavir using high-performance liquid chromatography (HPLC) with photodiode array detector. Hence, a simple, sensitive, rapid, and accurate method for the analysis of studied drugs was necessary. The aim of this study was to develop and validate stability indicating reverse-phase (RP) -HPLC method for the simultaneous quantification of saquinavir, ritonavir, and amprenavir.
METHODS
Chemicals and solvents
Saquinavir, ritonavir, and amprenavir reference standards were obtained from Pharmatrain, A division of Hi Q Pharma Labs Pvt., Ltd (Hyderabad, India). Analytical grade potassium dihydrogen orthophosphate, hydrochloric acid, sodium hydroxide, and hydrogen peroxide were purchased from Ramkem (Haryana, India). Milli-Q-water prepared by Millipore system was used in the present analysis. © 2018 The Authors. Published by Innovare Academic Sciences Pvt Ltd. This is an open access article under the CC BY license (http://creativecommons. org/licenses/by/4. 0/) DOI: http://dx.doi.org/10.22159/ajpcr.2018.v11i6.25205
Orthophosphoric acid of analytical grade was from Fischer Scientific, Mumbai, India. Methanol used was of HPLC grade and purchased from Ramkem (Haryana, India).
Liquid chromatographic instrumentation and conditions
The analyses of the samples were performed on a Waters 2695 separation module HPLC system equipped with waters 1525 binary HPLC pump, Waters 2998 photodiode array detector, and Waters 2707 autosampler. The data collection and assessment were done using Windows Empower-2 software. Chromatographic separation of saquinavir, ritonavir, and amprenavir was performed on an Inertsil ODS C18 (4.6 mm × 100 mm, 5 µm) analytical column. The column temperature was maintained at ambient temperature. The mobile phase consisted of 0.1M phosphate buffer (pH 3.5) and methanol (70:30, v/v) at a flow rate of 1 ml/min. 0.1M phosphate buffer was prepared by dissolving 3.40 g of potassium dihydrogen orthophosphate in 250 ml of water in a volumetric flask. Orthophosphoric acid was used to adjust the buffer pH to 3.5. The mobile phase was degassed in an ultrasonic water bath for 10 min and then filtered through 0.45 µ filter under vacuum filtration. The total analytical runtime was 15 min. In the HPLC run, injection volume was 20 µl. The chromatograms were recorded using photodiode array detector set at the wavelength of 260 nm.
Preparation of stock and standard solutions
The mixed stock solution of saquinavir (40 mg/100 ml), ritonavir (20 mg/100 ml), and amprenavir (30 mg/100 ml) was prepared in mobile phase. The appropriate amount of saquinavir (40 mg), ritonavir (20 mg), and amprenavir (30 mg) was separately weighed and dissolved in 30 ml of mobile phase in a 100 ml volumetric flask. Then, the solution was mixed and diluted with mobile phase to prepare a final mixed stock standard solution containing 400 µg/ml of saquinavir, 200 µg/ml of ritonavir, and 300 µg/ml of amprenavir. Calibration standards in the range of 40–200 µg/ml saquinavir, 20–100 µg/ml of ritonavir, and 30–150 µg/ml of amprenavir were prepared by aptly diluting the stock standard solution with mobile phase. For method validation study, working standard solution at a concentration of 120 µg/ml, 60 µg/ml, and 90 µg/ml of saquinavir, ritonavir, and amprenavir, respectively, was prepared from stock solution by apt dilution with mobile phase.
Calibration curve
Calibration standard solutions at five concentration levels (saquinavir - 40, 80, 120, 160, and 200 µg/ml; ritonavir - 20, 40, 60, 80, and 100 µg/ml; and amprenavir - 30, 60, 90, 120, and 150 µg/ml) were injected into the HPLC system. The peak area response of studied drugs at each concentration level was determined using described chromatographic conditions. Calibration curves were prepared by plotting the peak area of each drug versus nominal concentrations of
drugs using a 1/χ2 weighted linear least-squares regression model.
Analysis of saquinavir, ritonavir, and amprenavir laboratory prepared mixture
Mixed standard solution at a concentration of 120 µg/ml, 60 µg/ml, and 90 µg/ml of saquinavir, ritonavir, and amprenavir, respectively was prepared in mobile phase by apt dilution of stock solution. The procedure described under “Calibration curve” was applied. The percentage of studied drugs in the mixture prepared was calculated either using the corresponding calibration curve or regression equation.
Forced degradation studies
Forced degradation studies demonstrate the variation of quality of a drug substance under the influence of a variety of environmental factors (light, temperature, humidity, etc.) and helps to establish recommended drug storage conditions. Forced degradation studies were carried out, according to International Conference on Harmonization guidelines [10], on the saquinavir, ritonavir, and amprenavir standard solution to reveal the inherent stability characteristics of the drug and also to assess the specificity and stability indicating nature of the proposed method.
Degradation in acidic condition
3.0 ml of stock standard solution (400 µg/ml - saquinavir, 200 µg/ml – ritonavir, and 300 µg/ml - amprenavir) was transferred to a 10 ml volumetric flask containing 3 ml of 1N HCl. The flask was heated at 60°C for 6 h followed by neutralization with sufficient volume of 1N NaOH. The volume of the flask was made up to 10 ml with mobile phase. The solution was filtered with 0.22 micron syringe filters and placed in vials for injection into the HPLC system.
Degradation in alkaline condition
3.0 ml of stock standard solution (400 µg/ml - saquinavir, 200 µg/ml - ritonavir, and 300 µg/ml - amprenavir) was transferred to a 10 ml volumetric flask and added 3 ml of 1N NaOH. The flask was heated for 6 h at 60°C, neutralized with an adequate volume of 1N HCl. Then, the volume was made up to 10 ml with mobile phase. The resultant solution was filtered with 0.22 micron syringe filters and placed in vials for injection into the HPLC system.
Thermal degradation
An appropriate amount of saquinavir (40 mg), ritonavir (20 mg), and amprenavir (30 mg) was separately weighed and placed in a Petri dish. The Petri dish was kept in a hot air oven maintained at 110°C temperature for 24 h. After the specified period of degradation, the cooled drug samples were dissolved in and diluted to 100 ml with mobile. A 3 ml of prepared solution was diluted to 10 ml with the same solvent. The prepared sample was filtered with 0.22 micron syringe filters and injected into HPLC system for analysis.
Oxidative degradation
3.0 ml of stock standard solution (400 µg/ml - saquinavir, 200 µg/ml - ritonavir, and 300 µg/ml - amprenavir) was mixed with 1 ml of 30% hydrogen peroxide in a 10 ml volumetric flask. The resulting solution was allowed to stand at room temperature for 15 min. The solution was diluted to 10 ml with mobile phase. The solution was filtered with 0.22 micron syringe filters and place in vials for injection into the HPLC system.
Ultraviolet (UV) degradation
About 40 mg of saquinavir, 20 mg of ritonavir, and 30 mg of amprenavir (30 mg) was separately weighed, placed in Petri dish and exposed to UV light in a UV Chamber for 1 h or 200 Watt-h/m2. The sample was cooled,
and the solution was prepared by dissolving in and diluted to 100 ml with mobile. A 3 ml of prepared solution was diluted to 10 ml with the same solvent. The prepared sample was injected into HPLC system and analyzed.
Degradation in neutral condition
3.0 ml of stock standard solution (400 µg/ml - saquinavir, 200 µg/ml - ritonavir, and 300 µg/ml - amprenavir) was diluted with 1 ml of distilled
water in a 10 ml volumetric flask. The contents of the flask were refluxed at 60°C for 1 h. Cool the solution to room temperature and dilute to 10 ml with mobile phase. The solution was filtered with 0.22 micron syringe filters and placed in vials for injection into the HPLC system.
RESULTS AND DISCUSSION Method optimization
Two different columns (Xterra C18 [4.6 mm × 150 mm, 5 mm) and Inertsil ODS-3 (4.6 mm × 100 mm, 5 mm]) were tried for chromatographic performance investigations. The second column, Inertsil ODS C18 (4.6 mm × 100 mm, 5 mm), was the suitable one as it gave well-defined symmetrical peaks with good resolution. Different ratios of methanol with water and 0.1 M phosphate buffer were tried. When methanol with water is used as mobile phase, only two peaks were eluted. The combination of methanol with 0.1 M phosphate buffer at the ratio of 30:70 (v/v) is the best in the resolution, number of theoretical plates and tailing factor. The effect of mobile phase flow rate effect on the separation of studied drugs peaks was studied. It was observed that flow rate of 1.0 ml/min was favorable for good separation within a short time. Different pH values of the mobile phase were investigated. The investigated pH values were 3.5, 4.0, and 4.5. At the pH of 3.5, symmetrical peaks of three drugs with short retention times were obtained. Hence, the same value was used. The saquinavir, ritonavir, and amprenavir solution prepared in mobile phase was scanned with wavelength changed from 200 to 350 nm. At the detection wavelength of 260 nm, the absorbance of saquinavir, ritonavir, and amprenavir was relatively high. Therefore, the suitable detection wavelength was 260 nm. Typical chromatogram of laboratory prepared mixture of saquinavir, ritonavir, and amprenavir under the optimized chromatographic conditions is shown in Fig. 2.
Method validation
The method validity was evaluated as per the ICH guidelines considering system suitability, linearity, limit of detection (LOD), limit of quantitation (LOQ), accuracy, precision, ruggedness, robustness, selectivity, and specificity [11].
System suitability
System suitability was performed by injecting standard mixture solution 6 times into the HPLC system, and the chromatographic parameters were calculated as stated by the USP [12]. The system suitability parameters including tailing factor, plate count, resolution, and relative standard deviation (RSD) of peak area response, and retention time of studied drugs were summarized in Table 1.
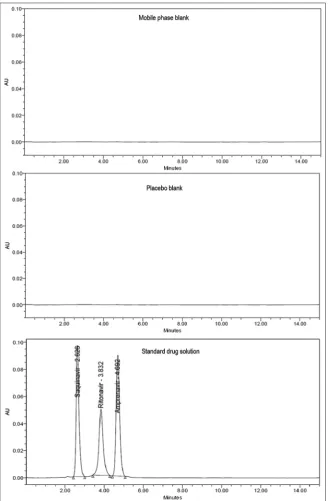
Selectivity
Method selectivity was evaluated by observing any interference from common tablets excipients and components of the mobile phase. For this purpose, chromatograms of placebo blank, mobile phase blank, and standard drug solution were compared. The chromatograms are shown in Fig. 3. No peaks were observed in the chromatograms of mobile phase and placebo blank at the retention time of drugs. Hence, it was concluded that the common tablet excipients and components of mobile phase did not interfere with the proposed method.
Linearity and range
Using the suggested experimental conditions, plotting the peak area response against the drug concentration in micrograms/milliliter resulted in a linear relationship. The calibration graphs were found to be linear over the concentration ranges are shown in Table 2. Linear regression analysis data resulted is also shown in Table 2. High values of the correlation coefficients (R2) of the regression equations, small
values of the intercept (c) and slope (c) indicated the linearity of the calibration graphs.
Limits of detection and quantification
The concentration (µg/ml) of studied drugs showing signal-to-noise ratios 3:1 and 10:1 was measured as LOD and LOQ, respectively. The LOD and LOQ were demonstrated for the sensitivity [13]. LOD and LOQ values of saquinavir, ritonavir, and amprenavir using the proposed HPLC method are cited in Table 2. The low values indicted the adequate sensitivity of the method.
Fig. 2: Typical chromatograms of laboratory prepared mixture of saquinavir (120 µg/ml), ritonavir (60 µg/ml) and amprenavir (90 µg/ml) Table 1: System suitability results for the determination of saquinavir, ritonavir, and amprenavir
Parameter Recommended limits Saquinavir Ritonavir Amprenavir
Mean* %RSD Mean* %RSD Mean* %RSD
Retention time %RSD≤2 2.623 0.268 3.833 0.261 4.695 0.253 Peak area %RSD≤2 934912 0.785 743187 0.338 1107995 0.772 Theoretical plates >2000 3910 0.883 4687 0.443 3374 1.018
Resolution >2 - - 3.945 0.616 2.878 0.262
Tailing factor ≤2 1.337 1.471 1.060 1.033 1.185 0.462
Precision
To assess system and method precision, six samples of working solutions with concentration 120 µg/ml (saquinavir), 60 µg/ml (ritonavir), and
90 µg/ml (amprenavir) were subjected to HPLC analysis. The results of precision studies were expressed as % RSD of peak area response (Table 3).
Fig. 3: Chromatograms of mobile phase blank, placebo blank and standard drug solution
Table 2: Linearity, LOD, and LOQ data for saquinavir, ritonavir, and amprenavir
Parameter Saquinavir Ritonavir Amprenavir
Linearity (µg/ml) 40–200 20–100 30–150
Regression equation (ya=m xb+c) y=7417 x+13062 y=12481 x+2264 y=11712 x+16603
Slope (m) 7417 12481 11712
Intercept (c) 13062 2264 16603
Correlation coefficient (R2) 0.9994 0.9992 0.9990
LOD (µg/ml) 0.19 0.17 0.16
LOQ (µg/ml) 0.64 0.57 0.53
Accuracy
Accuracy was established by the standard addition method through recovery study. Placebo blank solution was spiked with pure saquinavir, ritonavir, and amprenavir at three concentration levels (50%, 100%, and 150%). The mixtures were analyzed thrice. Percentage recoveries of studied drugs were calculated for each concentration level (Table 4). The obtained percentage recoveries for saquinavir, ritonavir, and amprenavir at the studied concentration levels indicated good accuracy
and the non-interference of common tablet excipients in the assay of the studied drugs.
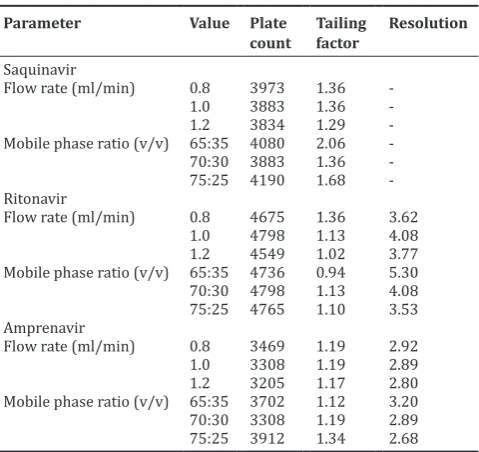
Robustness
To assess the robustness of the method, the mixed standard solutions (120 µg/ml - saquinavir; 60 µg/ml - ritonavir; and 90 µg/ml - amprenavir) were analyzed after deliberately changing chromatographic parameters in the developed method. The parameters studied were composition and flow rate of the mobile phase. The robustness study demonstrated that slight variations in the optimized chromatographic parameters have no significant effect on the plate count, tailing factor and resolution of three studied drugs using the proposed method (Table 5). This indicated the good robustness of the method.
Ruggedness
System-to-system and analyst-to-analyst variability study was conducted on two different HPLC systems, 2 different days and by different analysts under similar chromatographic conditions. Six mixed standard samples were prepared (120 µg/ml - saquinavir; 60 µg/ml - ritonavir; and 90 µg/ml - amprenavir) and analyzed using the proposed method. The percentage recoveries and percentage RSD of saquinavir, ritonavir, and amprenavir were calculated (Table 6). The results were found to be within the limits and indicated that the method is rugged for system-to-system and analyst-to-analyst variability.
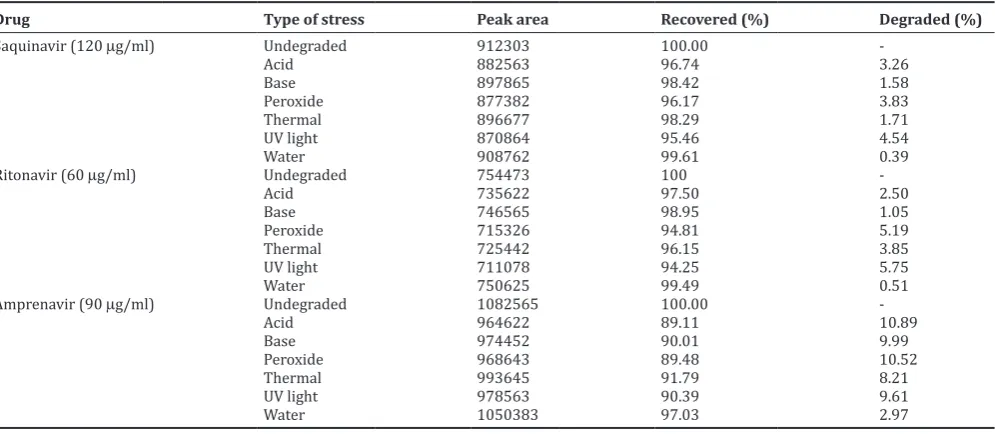
Specificity
A specificity study was carried out to demonstrate the effective separation of stress degradants from saquinavir, ritonavir, and amprenavir [14]. Mixed standard solutions were exposed to the stress conditions (acidic, alkaline, oxidative, thermal, photo, and neutral) to induce degradation. Stressed and unstressed samples were injected
Table 3: Precision data for the quantification of the studied drugs
Injection No. Saquinavir Ritonavir Amprenavir
System precision Method precision System precision Method precision System precision Method precision
1 937264 968448 740919 735275 1104576 1103822
2 931380 958282 742581 730510 1107721 1112642
3 933603 961820 746995 730667 1104044 1103264
4 930520 956833 745299 732869 1106798 1108829
5 928190 947579 742762 730284 1100210 1109231
6 948514 969544 740563 739543 1124622 1110379
Mean 934912 960418 743187 733191 1107995 1108028
%RSD 0.785 0.848 0.338 0.499 0.772 0.336
RSD: Relative standard deviation
Table 4: Accuracy data for the quantification of the studied drugs
Spiked
level (%) Amount of drug Spiked (µg/ml) Found* (µg/ml) % recovery
Saquinavir
*Mean value of three determinations
Table 5: Robustness data for the quantification of the studied drugs
Parameter Value Plate
count Tailing factor Resolution
Saquinavir
Flow rate (ml/min) 0.8 3973 1.36 -1.0 3883 1.36 -1.2 3834 1.29 -Mobile phase ratio (v/v) 65:35 4080 2.06 -70:30 3883 1.36 -75:25 4190 1.68 -Ritonavir
Flow rate (ml/min) 0.8 4675 1.36 3.62 1.0 4798 1.13 4.08 1.2 4549 1.02 3.77 Mobile phase ratio (v/v) 65:35 4736 0.94 5.30 70:30 4798 1.13 4.08 75:25 4765 1.10 3.53 Amprenavir
Flow rate (ml/min) 0.8 3469 1.19 2.92 1.0 3308 1.19 2.89 1.2 3205 1.17 2.80 Mobile phase ratio (v/v) 65:35 3702 1.12 3.20 70:30 3308 1.19 2.89 75:25 3912 1.34 2.68
into the HPLC system. The chromatograms were recorded (Fig. 4). The stress degradant peaks in all the applied stress conditions were resolved from saquinavir, ritonavir, and amprenavir peaks. The degradants did not show any interference at the retention time of saquinavir, ritonavir, and amprenavir. Degradation study results were shown in Table 7. From the percentage degradation values, it was observed that saquinavir and ritonavir are more sensitive to oxidative stress whereas amprenavir is more degraded in acidic conditions. All the three drugs are stable in neutral degradation condition applied when compared with other stress conditions applied.
CONCLUSION
For the first time, to the best of our knowledge, stability indicating RP-HPLC method was developed and validated for the simultaneous estimation of saquinavir, ritonavir, and amprenavir. The developed method satisfied all validation parameters such as system suitability, linearity, selectivity, precision, specificity, accuracy, ruggedness, and robustness. Furthermore, the method satisfied the forced degradation study. The results indicated that the proposed method is suitable for the simultaneous determination of saquinavir, ritonavir, and amprenavir in the presence of their stress degradants. Therefore, the method can be applied for the simultaneous estimation of saquinavir, ritonavir, and amprenavir in the regular analysis.
AUTHOR’S CONTRIBUTION
Author Mangamma Kuna done the literature survey, analysis of the study, and wrote the first draft of the paper. Author Gowri Sankar Dannana designed the study plan, corrected the first draft of the paper, and prepared the final manuscript for submission.
CONFLICTS OF INTEREST
The authors declare that there are no conflicts of interest in the present investigation.
REFERENCES
1. Saquinavir. The American Society of Health-System Pharmacists. Archived from the original on 2015-09-08; 2006. Available from: http://www.drugs.com/monograph/saquinavir.html. [Last retrieved on 2015 Sep 05].
2. Vella S, Floridia M. Saquinavir clinical pharmacology and efficacy. Clin Pharm 1998;34:189-201.
3. La Porte CJ. Saquinavir, the pioneer antiretroviral protease inhibitor. Expert Opin Drug Metab Toxicol 2009;5:1313-22.
4. Ritonavir. The American Society of Health-System Pharmacists. Archived from the original on 2015-10-17; 2013. Available from: https://www.drugs.com/monograph/ritonavir.html. [Last retrieved on 2015 Oct 23].
Table 6: Ruggedness data for the quantification of the studied drugs
Value Laboratory 1 Laboratory 1
Analyst 1 Analyst 2 Analyst 1 Analyst 2
Day 1 Day 2 Day 1 Day 2 Day 1 Day 2 Day 1 Day 2
Saquinavir (concentration taken 120 µg/ml)
Mean* 119.74 119.80 119.66 119.82 19.66 119.60 119.79 119.94
SD 0.38 0.30 0.38 0.35 0.39 0.47 0.59 0.31
%RSD 0.32 0.25 0.32 0.29 0.33 0.39 0.49 0.26
Ritonavir (concentration taken 60 µg/ml)
Mean* 59.80 59.87 59.63 59.83 59.65 59.38 59.62 59.57
SD 0.25 0.45 0.25 0.41 0.26 0.24 0.37 0.33
%RSD 0.42 0.75 0.41 0.69 0.43 0.41 0.62 0.57
Amprenavir (concentration taken 90 µg/ml)
Mean* 89.82 89.92 89.74 89.84 89.77 89.78 89.69 89.91
SD 0.36 0.29 0.39 0.39 0.38 0.39 0.26 0.23
%RSD 0.40 0.33 0.43 0.43 0.42 0.44 0.29 0.25
*Mean value of six determinations. SD: Standard deviation, RSD: Relative standard deviation
Table 7: Degradation data for the studied drugs
Drug Type of stress Peak area Recovered (%) Degraded (%)
Saquinavir (120 µg/ml) Undegraded 912303 100.00
-Acid 882563 96.74 3.26
Base 897865 98.42 1.58
Peroxide 877382 96.17 3.83
Thermal 896677 98.29 1.71
UV light 870864 95.46 4.54
Water 908762 99.61 0.39
Ritonavir (60 µg/ml) Undegraded 754473 100
-Acid 735622 97.50 2.50
Base 746565 98.95 1.05
Peroxide 715326 94.81 5.19
Thermal 725442 96.15 3.85
UV light 711078 94.25 5.75
Water 750625 99.49 0.51
Amprenavir (90 µg/ml) Undegraded 1082565 100.00
-Acid 964622 89.11 10.89
Base 974452 90.01 9.99
Peroxide 968643 89.48 10.52
Thermal 993645 91.79 8.21
UV light 978563 90.39 9.61
Water 1050383 97.03 2.97
5. Hull MW, Montaner JS. Ritonavir-boosted protease inhibitors in HIV therapy. Ann Med 2011;43:375-88.
6. Zeldin RK, Petruschke RA. Pharmacological and therapeutic properties of ritonavir-boosted protease inhibitor therapy in HIV-infected patients. J Antimicrob Chemother 2004;53:4-9.
7. Agenerase (amprenavir) capsules. Full Prescribing Information. Section Dosage and Administration (PDF). US Food and Drug Administration. GlaxoSmithKline and Vertex Pharmaceuticals Inc.; 2005. Available from: https://www.accessdata.fda.gov/drugsatfda_ docs/label/2002/21007s11,21039s10lbl.pdf. [Last retrieved on 2015 Nov 29].
8. Fung HB, Kirschenbaum HL, Hameed R. Amprenavir: A new human immunodeficiency virus Type 1 protease inhibitor. Clin Ther 2000;22:549-72.
9. Ishizawa M, Komatsu H. Pharmacological study and clinical effect of HIV protease inhibitor amprenavir. Nihon Yakurigaku Zasshi
2001;117:59-64.
10. International Conference on Harmonization (ICH) of Technical Requirements for the Registration of Pharmaceutical for Human use Stability Testing of New Drugs Substance and Products Q1A (R2); 2003. 11. International Conference on Harmonization (ICH) Harmonized Tripartite Guidelines, Validation of Analytical Procedures: Text and Methodology, Q2(R1), Parent Guidelines on Methodology dated November 6; 1996. 12. The United States Pharmacopoeia 34, the National Formulary 29. Vol.
II, III. Rockville, MD: US Pharmacopoeial Convention; 2011; p. 2445, 3782-4608.
13. Ravichandran V, Shalini S, Sundram KM, Harish R. Validation of analytical methods–strategies and importance. Int J Pharm Pharm Sci 2010;2:18-22.