Time-evolution of bubble formation in a viscous
liquid
Kou Yamada1, Hiroyuki Emori2, and Kiyoshi Nakazawa3
1Graduate School of Political Science, Waseda University, Nishiwaseda, Tokyo 169-8050, Japan 2Department of Business Management, Shumei University, Chiba 276-0003, Japan
3Department of Earth and Planetary Sciences, Tokyo Institute of Technology, Ookayama, Tokyo 152-8551, Japan
(Received September 11, 2007; Revised February 23, 2008; Accepted February 25, 2008; Online published July 4, 2008)
Time-evolutions of bubble vesiculation in viscous liquid are characterized by two stages, i.e., the bubble formation stage and the bubble coalescence stage. We have focused on the former stage of bubble vesiculation and investigated numerically bubble formation in decompressed viscous liquid. Bubble formation consists of nucleation and growth of bubbles due to the exsolution of volatile elements fromliquid. In order to describe the bubble formation processes, we have developed a theoreticalmodel, taking into account the bubble size distribution and the viscosity of liquid, on the base of the model proposed by Toramaru (J. Geophys. Res.,
100, 1913–1931, 1995). Numerical solutions show that the feature of bubble nucleation is significantly varied according to themagnitude of the liquid viscosity. In low viscosity cases, the growth of bubbles is mainly controlled by the diffusive flux of volatilemolecules to bubbles. The number density of bubbles is sensitive to the diffusivity of volatile element in liquid. On the other hand, bubbles hardly grow in the case of the extremely high viscosity. Therefore, bubbles continue to be formed in order to reduce the volatile oversaturation of liquid. In the case of the intermediate viscosity, bubbles grow to the large size slowly by the viscous resistance. After the nucleation of bubbles ceases, the Ostwald ripening occurs and leads to the dissolution of small bubbles. The number density of bubbles varies greatly with time. The time-evolutions of the bubble size distribution have been also caluclated. In the case of the low and extreme high viscosity, the bubble size distribution evolves as an unimodal size distribution. In the case of themoderate viscosity, the size distribution of bubbles shows the distribution with a wider dispersion. These characteristic time-evolutions of the number density and size distribution of bubbles would be useful in evaluatingmaterial quantities such as the diffusivity, the viscosity, and the surface tension of liquid fromexperimental results. Furthermore our results provide the number density and size distribution of bubbles just before bubble coalescence occurs.
Key words:Bubble, nucleation, growth, viscous, Ostwald ripening, size distribution.
1.
Introduction
The kinetics of phase change plays important roles in many fields of science and technology. Phase changes proceed through the nucleation and growth of new phase. Studies on the nucleation and growth are necessary to un-derstand various physical phenomena for example, bubble formation in ascendingmagmas and condensation of solid dusts in cooling gas. Theoretical or experimental studies have been done so far to describe the phase transition ki-netics (Lothe and Pound, 1962; Federet al., 1966; Kikuchi, 1971; Andersonet al., 1980; Adamset al., 1984; Dillmann and Meier, 1991; Yamamotoet al., 2001) and one can now sketch out how phase change proceeds in nucleation pro-cesses.
In general, phase change proceeds through three succes-sive stages. The first stage is the supersaturated state in which supersaturation rates ofmatters tomake a new phase are increased by change in thermodynamic conditions such as cooling of temperature, decompression, or chemical re-actions. The second stage is formation of new phase. Nuclei
Copyright cThe Society of Geomagnetismand Earth, Planetary and Space Sci-ences (SGEPSS); The Seismological Society of Japan; The Volcanological Society of Japan; The Geodetic Society of Japan; The Japanese Society for Planetary Sci-ences; TERRAPUB.
of new phase come out in the interior of parent phase. After this stage, as the third stage, the growth of nuclei proceeds. In the growth stage, interactions between nuclei are negli-gible due to smallness of nuclei. Then, a nucleus grows by the attachment of new phasemolecules or expands by dif-ference between its internal and external pressure. In latter stage, interactions between nucleimay be important. Nuclei grow to the large size via the coalescence between nuclei. Then, the relative velocity and the distance between nuclei which are related to the number density and size distribution of nuclei are important factors controlling the coalescence efficiency.
The nucleation and growth of nuclei have been theoreti-cally investigated bymany authors on the basis of the clas-sical nucleation theory (Johnson and Mehl, 1939; Avrami, 1939, 1940, 1941; Yamamoto and Hasegawa, 1977; Tora-maru, 1989, 1995; Pradell et al., 1998; Yamada et al., 2005). They constructed theoreticalmodels to deduce total volume, final number density, or size distribution of pop-ulation. As a result, in these studies, physical conditions ormaterial quantities are estimated by the comparison with population of new phase observed in natural samples, for example, pyroclastic rocks (e.g., Toramaru, 2006) orm ete-orites (e.g., Tanakaet al., 2002).
Bubble dynamics is one of important problems because the coexistence of gas bubbles with liquid remarkably changes properties of flow. Such two-phase flow is usually calledmultiphase flow. For example,magma ascending in conduit or rapid flow over a submerged body are observed asmultiphase flow. The specific volume ofmatter ismuch larger in gas phase than in liquid phase. So, increase in the volume ratio of gas phase results in acceleration of the flow under gravity even if themass ratio of gas is small (Papale, 2001). Besides, as another example, the drag coefficient inmultiphase flow generally depends on the volume ratio of gas (Batchelor, 1967). In this paper, we will focus on bubble formation processes, that is, the bubble nucleation stage and the single growth stage. We will develop a the-oreticalmodel on the nucleation and growth of bubbles in a viscous liquid containing a volatile component to exam -ine time-evolutions of the bubble size distribution and the bubble number density, which are used to speculate bubble vesiculation processes happened actually fromnatural sam -ples (e.g., Proussevitchet al., 2007a, b). Our study will pro-vide useful informations on initial conditions of the bubble coalescence stage.
In studies for condensation, Yamamoto and Hasegawa (1977) derived the equations describing the formation and growth of grains in cooling vapor composed of one species, taking into account the grain size distribution. They solved the equations analytically and obtained the number density of grains and the final grain size as a function of physical parameters such as the cooling rate and the surface energy of grain.
Quantitative description of the nucleation process in a viscous liquid was originally provided by Toramaru (1995). He constructed the bubble nucleationmodel in decom press-ing viscous incompressiblemagmas, taking into account the time-evolution of H2O concentration inmagma. He num
er-ically calculated the number density of bubbles and the su-persaturation pressure at which bubble nucleation is virtu-ally triggered. Further, he derived empirical expressions for the bubble number density and the duration time of nucle-ation by the usage of their numerical results. However, he assumed that all bubbles have equal size ignoring the bubble size distribution.
On the basis of Toramaru’smodel (1989, 1995), Yamada et al. (2005) developed the nucleation model in magmas with the low viscosity taking into account the size dis-tribution of bubbles and derived approximate solutions to the bubble number density and the supersaturation pressure based on the analyticalmethod of Yamamoto and Hasegawa (1977). Their results are as follows: The analytical solution provides number densities reproducing well the numerical values within a factor of 2 in wide ranges of parameters. The values of the bubble number density agree with those given by Toramaru (1995) within a factor of 10. In the case of the small viscosity, the size distribution of bubbles shows an unimodal distribution with the narrow dispersion. Since the assumption that all bubbles are equal in size is valid, the discrepancy between our results and those of Toramaru (1995) is observed within one order ofmagnitude.
As for bubble formation inmagma,many laboratory ex-periments of vesiculation have been performed as well as
theoretical studies (Hurwitz and Navon, 1994; Gardneret al., 1999, 2000; Gardner, 2007; Mangan and Sisson, 2000; Manganet al., 2004a, b; Mourtada-Bonnefoi and Laporte, 1999, 2002, 2004). The experiments provided data on vesiculation parameters such as the time-evolution of the number density of bubbles, the bubble size distribution, and the supersaturation pressure. Yamada et al. (2005) indi-rectly estimated the surface tension at water-rhyoliticmelt interface and the H2O diffusivity in rhyoliticmelt fromthe
comparison between their model and some experiments. The indirect estimates are consistent with the availablem ea-surements of the surface tension of themelt (Epel’baumet al., 1973; Khitarovet al., 1979; Bagdassarovet al., 2000) and the water diffusivity in themelt (Nowak and Behrens, 1997; Zhang, 1999; Zhang and Behrens, 2000).
In themodel of Yamadaet al.(2005), the effect of the viscosity on the bubble growth is assumed to be negligible. As pointed out by previous studies (Sparks, 1978; Prousse-vitchet al., 1993; Toramaru, 1995; Proussevitch and Saha-gian, 1998), however, the growth of bubbles is controlled by the viscosity in high viscousmelt and bubble nucleation is sensitive to the viscosity through the bubble growth. Hence, in this paper, we will investigate the non-equilibrium exso-lution of gas in a decompressing viscous liquid. In order to describe the nucleation and growth of bubbles, we will develop a theoretical model, taking into account the size distribution of bubbles.
Our main aim of this paper is to examine how tim e-evolution of the bubble number density and size distribution of bubbles depend onmaterial parameters including the sur-face tension, the volatile diffusivity, and the viscosity. This kind of study is fundamentally important for following rea-sons: (1) Quantitative relationships between observations (e.g., the bubble number density and the bubble size distri-bution) and unknownmaterial parameters can be powerful tools to studymaterial quantities and physical conditions fromnatural samples or experiments. (2) Once we obtain informations on time-evolutions of the bubble number den-sity and bubble size distribution, we can easily incorporate themas initial conditions on the latter bubble vesiculation process, namely, bubble coalescence stage.
In Section 2, we will describe the basic equations, taking the bubble size distribution into account, where we basically follow the study of Toramaru (1995). In Section 3, we will show the simulations of the time-evolution of bubble for-mation and the behavior of the bubble number density. We will adopt parameter ranges similar tomagmatic parameters to compare our results with those of Yamadaet al.(2005) and Toramaru (1995). We will see the time-evolution of the bubble size distribution and check the validity of the assumption of equal bubble size in themodel of Toramaru (1995). In Section 4, the conclusions of our study will be presented.
2.
Ba
s
ic Equation
s
Governing Nucleation and
Growth of Bubble
s
2.1 Nucleation and growth of bubbles
of liquid is generally large, this assumption is valid for the case that the gas to liquidmass ratio is small. In this study we also assume that the surface tension, the viscosity, and the volatile diffusivity in liquid are constant.
We define the concentration of a volatile component ex-pressed byC as the number of volatilemolecules per unit fluid volume. The activity of volatile species plays an im -portant role in controlling the degree of supersaturation in fluid. The activity ofmixture that contains a volatilem ate-rial has been experimentally and theoretically examined by many studies in volcanology (Burnham, 1975; Ghiorsoet al., 1983; Fogel and Rutherford, 1990; Papale, 1999). Ac-cording to their results, the activity is proportional to the m-power of volatile concentration, namelyCm. The expo-nentmdepends on a volatile species. In the case that the volatile is H2O,m = 2 and in the case of CO2 for silicic
magma,m=1.
Let us derive the equilibrium concentration Ceq of a
volatile component in liquid at the pressure P from the chemical equilibriumcondition. In an isothermal state, the equilibriumconcentration is given, in terms of a concentra-tionC0 and the pressure P0at a reference saturation state,
by (e.g., Toramaru, 1989, 1995)
wherevl is the volatile molecular volume in liquid, T is
the temperature, and kB is the Boltzmann’s constant. In
deriving above equation, the volatilemolecular volumevlis
set to be constant and the gas phase is assumed to be ideal. We introduce the saturated concentration of a volatile componentCin equilibrated with a spherical bubble. The
internal pressure in a bubble is different fromthe pressure in surrounding liquid due to the surface tension in the case where a bubble and liquid contact through a curved inter-face. Since liquid with the concentrationCinand the
pres-sure P keeps the chemical equilibriumstate with a bubble in which the internal pressure isPgas, the saturated
concen-tration is given by
We set a reference concentrationC0to be the initial value
of volatile concentration in fluid and assume that the fluid is saturated att =0 (i.e.,P= P0). Under the perfect thermal
equilibrium condition, bubbling of a volatile component begins just at the equilibriumpressure P0. In real systems,
however, the surface energy at an interface between liquid and gas suppresses the nucleation of bubbles and the fluid remains in the super-saturated state for a long period of time. Then, we introduce the supersaturation ratio defined by
S= C Ceq
. (3)
The equilibriumconcentration decreases with decom pres-sion. It is noted that S is greater than unity in super-saturated liquid.
In the super-saturated state, nucleation of new phase pro-ceeds through the formation of nuclei whose radius is larger
than that of a critical nuclei. This nucleation of bubbles in ametastable phase is controlled by thermodynamic fluctu-ations. According to the classical nucleation theory (Feder et al., 1966; Lifshitz and Pitaevskii, 1981), the nucleation rate is given by
whereDis the diffusion coefficient of a volatile component in liquid,γ is the surface tension, andRcris the radius of a
critical nucleus given by
Rcr=
2γ
P(Sm−1). (5)
Decompression leads to the increase in the supersatura-tion ratio and the formation of bubbles. Then, in hom o-geneous liquid, bubbles are uniformly distributed, namely the distance froma bubble to neighboring bubbles is ap-proximately equal. At the former stage, interactions be-tween bubbles are negligible because the radius of a bubble ismuch smaller than themean distance between bubbles. However, at the later stage, when bubbles grow enough, bubble coalescence would occur and as a consequence the size distribution of bubbles changes. We principally con-sider the nucleation and growth stage of bubbles before bub-ble coalescence occurs.
The growth of a nucleated bubble is controlled by the dif-fusion of volatilemolecules in super-saturated liquid. We derive an equation describing the time variation of the num -ber of volatile molecules in a single bubble,n. Since the number of volatilemolecules in a bubble increases by the diffusive flux toward its surface in super-saturated liquid, its time-evolution is given by
dn(t,t) dt =4πR
2I, (6)
whereRis the bubble radius andI is the diffusive flux to-ward the bubble. Note that R andn are dependent on the timet indicating when the bubble was nucleated as well as present timet. Assuming a steady state, the spherically symmetric distribution round a bubble of radius Ris given by the solution of the diffusion equation with boundary con-ditions that the concentrations are equal toCandCinat
in-finity and the bubble surface, respectively. Using the so-lution, the diffusion flux is given as I = D(C−Cin)/R.
Proussevitchet al.(1993) indicated that gradient of volatile concentrations at a bubble-liquid interface changes from steep at the early time to flat at the late time. Actually, the volatile concentration in liquid varies with time and the spa-tial gradient of volatile concentration surrounding a bubble does not become linear but hyperbolic (Proussevitchet al., 1993). In the diffusive flux derived here, the bubble radius Ris used as the characteristic diffusion length andC−Cin
time evolving diffusive flux on the bubble-liquid interface (Yamada, 2005). Substituting the stationary solution of the diffusive flux into Eq. (6), we obtain
dn(t,t)
dt =4πR D(C−Cin) . (7) In this study, we simply apply themean-field approxi-mation to evaluate the spatial volatile concentration within liquid (e.g., Pradellet al., 1998). Under themean-field ap-proximation, the volatile concentration in liquid surround-ing bubbles is deduced fromthe conservation of the total number of volatilemolecules as (Yamamoto and Hasegawa, 1977)
C(t)=C0−
t
0
n(t,t)J(t )dt. (8)
Decompression causes the pressure difference between liquid and gas which leads to the expansion of gas bub-bles. The pressure difference balances with the viscosity, the surface tension, and the inertial force (Proussevitchet al., 1993; Toramaru, 1995; Lyakhovskyet al., 1996; Prous-sevitch and Sahagian, 1998; Lenskyet al., 2001):
Pgas= P+
2γ
R +
4η R R˙+ρl
2R˙2+RR¨ (9) In Eq. (9),ρlis the liquid density. The above equation was
derived by many investigators with the assumption of the liquid incompressibility. Furthermore, the applicability of Eq. (9) to the bubble growth in compressible liquid was rigorously verified by Yamadaet al.(2006). In the case that the expansion rate of bubbles, R˙, is considerably smaller than the sound velocitycs, the last two terms on the right
hand side of Eq. (9) can be omitted. These terms, which we call the inertial termhenceforth, have an order ofρlR˙2
while the pressure termis aboutρlc2s. For rough estimation,
putting appropriate values (R˙ 1×10⁻⁴ cm/s andc s
1×105cm/s) into the inertial term, the ratio of the inertial
termto the pressure term, which corresponds to the Mach number, ismuch smaller than unity. Thus, neglecting the inertial term, the time variation of the bubble expansion is given by (Proussevitch et al., 1993; Toramaru, 1995; Proussevitch and Sahagian, 1998)
dR dt =
R 4η
Pgas−P−
2γ R
. (10)
The internal pressure in a bubble is related to R andn through the equation of state of ideal gas:
4π 3 R
3P
gas=nkBT (11)
The growth of bubbles is described by Eqs. (7) and (10). Assuming that a critical nucleus is in equilibriumchem i-cally andmechanically with surrounding liquid, the internal pressure in the critical nucleus is brought fromEq. (10) as
Pgas= P+
2γ Rcr.
(12)
We integrate Eqs. (7) and (10) with the initial conditions, R(t,t)=Rcr, and Eq. (12).
t’
t
t’
t’
t’
1 2 iR
(
t,t’
)
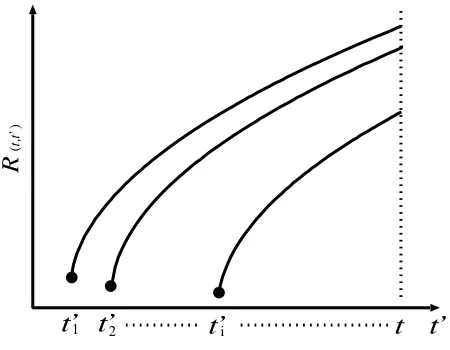
Fig. 1. Schematic time-evolution of the radius of bubbles which are nucleated att =ti.
Bubbles nucleated earlier grow larger than those nucle-ated later. Figure 1 shows schematic time-evolutions of radii of bubbles nucleated at different time t. The size distribution of bubbles arises fromthe varieties of the nu-cleation time among bubbles. As seen in Eq. (8), accurate information on the bubble size distribution is required to calculate the time-evolution of volatile concentration. In the numerical calculation by Toramaru (1995), he used a further simplified equation, in which bubbles have only onem ono-tonic size. On the other hand, we directly solve Eq. (8), tak-ing into account the size distribution of bubbles. The bubble nucleation process is described by Eqs. (1)–(5), (7), (8), and (10). In our simulations, bubbles with various sizes can be observed at timet. Then, in some cases, bubbles become smaller than the critical radius. We regard these bubbles as bubbles dissoluting to liquid and the number density of smaller bubbles than the critical radius is set to be zero.
The decline in the supersaturation ratio strongly reduces the nucleation rate and as a result bubble nucleation ceases. The number density of bubbles at timetis given by
N(t)=
t
0
J(t)dt. (13)
In addition we introduce the cumulative number density of bubbles defined by
N(>R)=
∞
R
F(R)dR, (14)
whereF(R)is the size distribution of bubbles defined by
FR(t,t ),t=J(t )))))dR(t,t) dt
))
))−1. (15)
2.2 Non-dimensional forms
For the later convenience, we transform the basic equations mentioned in previous subsection into non-dimensional forms. In this study, we consider the case where decompression proceeds at a constant rate. Then, the pressure of liquid with a constant decompression rate is given byP =P0− ˙Pt. We introduce non-dimensional time
Now, we introduce the non-dimensional volatile concen-trationC˜, the pressure P˜, and the bubble radiusR˜, defined
respectively, wherer1is themean distance between
neigh-boring volatilemolecules in a bubble defined by
4π
respectively. Note that C˜in and P˜gas denote the
non-dimensional forms of the interfacial concentration and the internal pressure in a bubble, respectively. The parameters
α,,γ˜, andin the above equations are defined as ratio of the volume occupied by a single volatilemolecule in the gas phase to that in the liquid phase, the ratio of the decompression time to the diffusion time for the distancer1,
the ratio of the surface energy of a hypothetical surface be-longing to one volatilemolecule to the thermal energy, and
the ratio of the decompression time to the viscous relaxation time given byη/P0, respectively. Furthermore,J˜(x)is the
non-dimensional nucleation rate written by
˜
whereR˜cr is the non-dimensional radius of the critical
nu-cleus. Then, the supersaturation ratio is also expressed as
S(x)= ˜C(1−x)−1/mexp
whereβ is the ratio of the volume occupied by a single volatilemolecule in the gas phase to itsmolecular volume in the liquid phase defined by
β = 3vl
4πr13. (30)
In addition, noted that the dimensionless number density of bubbles is
The basic equations include two differential equations and one integral equation. As for our numerical sim u-lation, Eqs. (21) and (22) are integrated by the second-order Runge-Kutta method with the initial conditions,
˜
R(x,x)= ˜Rcr(x)andP˜gas= ˜P+2γ /˜ 3R˜cr. The
integra-tion of Eq. (23) is calculated according to the trapezoidal rule. The governing equations contain six parametersα,β,
,,γ˜, andm. Themain notations used in this paper are listed in Table 1.
The bubble radius and a number of volatile molecules within bubbles are functions of t andt. To obtain accu-rately the size distribution of bubbles, we have to calculate the growth of bubbles nucleated at differentt as shown in Fig. 1. In calculations, the timet is discretely given such ast = {t1,t2,· · ·,ti,· · ·,t}, wheret1 <t2 <· · · < ti <
· · · < t. Then, a time step betweenti−1 andti is chosen
small enough to carry out a stable calculation. In this study, we set it to be less than 1/3αand 4/. The dim ension-less parameters 1/3αand 4/correspond to the typical diffusive growth time and expansion time of bubbles in vis-cous liquid, respectively. The time step is usually given by 1/3α. As known later,is an order of 106–8. Then, the
Table 1. Main notation list.
Parameter Definition
a Dimensionless parameter defined by Eq. (37).
b Dimensionless parameter defined by Eq. (40).
C Volatile concentration in liquid, number/m3. ˜
C Dimensionless formofC,C/C0.
Ceq Equilibriumconcentration at the pressureP, number/m3.
Cin Equilibriumconcentration at liquid-spherical bubble interface, number/m3.
˜
Cin Dimensionless formofCin,Cin/C0.
C0 Initial concentration in liquid, number/m3.
D Volatile diffusivity in liquid,m2/s. J Nucleation rate, number/m3/s.
˜
J Dimensionless formofJ,J tP/C0.
˜
J0 Dimensionless formof the zero-th order nucleation rate given by Eq. (36).
m Exponent of the activity.
N Number density of bubbles, number/m3.
N(>R) Cumulative number density of bubbles whose size is larger thanR, number/m3.
n Number of volatilemolecules in a bubble, number.
P Pressure, Pa.
˜
P Dimensionless formofP,P/P0.
Pgas Internal pressure in a bubble, Pa.
˜
Pgas Dimensionless formofPgas,Pgas/P0.
P0 Initial pressure, Pa.
˙
P Decompression rate, Pa/s.
R Bubble radius,m.
˜
R Dimensionless formofR,R/r1.
Rcr Radius of the critical bubbles,m.
˜
Rcr Dimensionless formofRcr,Rcr/r1.
r1 Scaling constant defined by Eq. (20).
S Supersaturation ratio,C/Ceq.
T Temperature, K.
t Actual time, s.
t Time at which a bubble is nucleated, s.
tP Decompression timeP0/P˙, s.
vl Volume of a single volatilemolecule in liquid,
m3.
x Dimensionless time oft,t/tP.
α Dimensionless parameter defined by Eq. (24). β Dimensionless parameter defined by Eq. (30).
Relation betweenβand the parameterα2
used in Toramaru (1995):α2=β.
γ Surface tension of liquid, N/m.
˜
γ Dimensionless parameter defined by Eq. (26). α1(Toramaru,1995)=4γ˜3/27.
η Viscosity of liquid, Pa·s.
Dimensionless parameter defined by Eq. (27). α4(Toramaru,1995)=/4.
Dimensionless parameter defined by Eq. (25). α3(Toramaru,1995)=9α/4γ˜2.
Bubble
(
a
)
(b)
Bubble
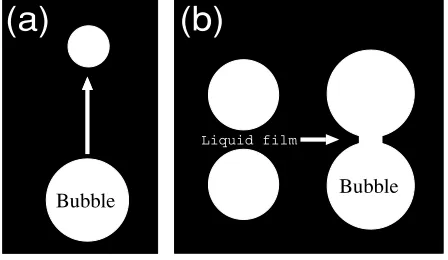
Fig. 2. Schematic bubble coalescence. In Panel (a), the collision of binary buoyant bubbles with the relative velocity is shown. Panel (b) shows the coalescence of expanding bubbles. As bubbles expand owing to decompression and approach each other, liquid filmbetween themis thinning and two bubbles coalesce.
the bubble growth process. Then, there are two types of bubble coalescence namely, the collision of buoyant bub-bles with the relative velocity (see Fig. 2(a)) or the coales-cence as a result of the expansion of neighboring bubbles (see Fig. 2(b)).
Let us consider the first case. The drag is exerted on buoyant bubbles as theymove through viscous liquid. Us-ing Stokes’ formula (Landau and Lifshitz, 1987), the veloc-ity ofmoving bubblesubin liquid is given by
ub=6×10⁻⁸μm/s
R 1μm
2 η
1×10⁵Pa·s
−1 , (32)
where we used the value of silicicmagma for the viscosity and the liquid density is assumed to bemuch larger than the gas density within bubbles. As seen later, the typical size of nucleated bubbles ranges from0.1 to 1μm. Hence even if the relative velocity and themean distance between two bubbles are almost equal toubandR, respectively, the
collision time ismuch longer than the decompression time which is on the order of a few hundreds second. This im -plies that collision between small bubbles would be negli-gible.
3.
Numerical Re
s
ult
s
3.1 Behavior of bubble formation
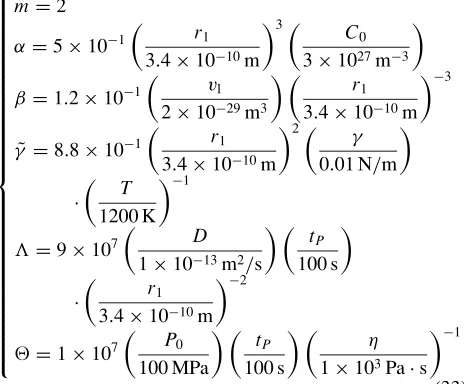
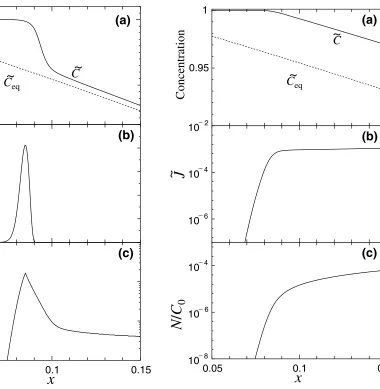
To observe the behavior of bubble formation, we num er-ically solve the basic equations in the case with following parameters: We call above values as reference values. In Fig. 3, tim e-evolutions of the volatile concentration (a), the nucleation rate (b), and the bubble number density (c) are illustrated.
Initially (at x = 0), the equilibrium concentration is equal to the initial concentrationC0 andmonotonously
de-creases with time, whereas the volatile concentrationm ain-tainsC0 until bubble nucleation occurs. After bubble
nu-cleation ceases, the volatile concentration significantly de-creases owing to the bubble growth and tends to an equi-librium value. In Fig. 3(b), the nucleation rate attains amaximumwhen the concentration decreases slightly (at x =7.4×10⁻²). The ratio of the duration time of
nucle-ation (the half-value width of J(t)) to the decompression time is approximately 4×10⁻³. This small ratio means
that the nucleation proceeds at an instant. We can see from Fig. 3(c) that the non-dimensional number density of bub-bles increases until x = 7.4×10⁻² and attains am axi-mumvalue, 3.1×10⁻⁹ atx = 7.4×10⁻². After that, it slightly decreases. The supersaturation ratio decreases after x = 7.4×10⁻² through the decrease in the volatile
con-centration. Then, the critical radius increases (see Eq. (5)) and some bubbles become smaller than the critical radius again. Such bubbles are unstable and dissolve in liquid. As a result, the number density of bubbles decreases. This phe-nomenon is the Ostwald ripening (Lifshitz and Pitaevskii, 1981).
Let us see the behavior of bubble formation in the case of the medium viscosity. In Fig. 4, the parameter is 2×10⁴. Note that the values of other parameters are same
as reference values. Time-evolutions of the volatile con-centration (a), the nucleation rate (b), and the number den-sity of bubbles (c) are shown in Fig. 4. It is found from Fig. 4(b) that the nucleation rate has a sharpmaximumat x = 8.5×10⁻². The time when the nucleation rate at-tains amaximumis later than that in Fig. 3, in this case. A reason for this delay is that the growth of bubbles is sup-pressed by the viscosity. Then, the number density of
nu-Fig. 3. Time-evolutions of the volatile concentration (a), the nucleation rate (b), and the number density of bubbles (c) in the case of reference values (m=2,α=0.5,β=1.2×10⁻¹,γ˜=8.8×10⁻¹,=9×10⁷,
and= 1×10⁷). This corresponds to the low viscosity system. In
Panel (a), the solid and dotted lines indicate the volatile concentration
Cand the equilibriumvalueCeq, respectively.
cleated bubbles is larger than that in Fig. 3. Consequently, the supersaturated liquid rapidly tends to the equilibrium state after the nucleation (see in Panel (a)). In Fig. 4(c), the number density of bubbles considerably decreases after it attainsmaximum. In highly viscous liquid, smaller bubbles cannot grow rapidly and they disappear due to the Ostwald ripening. Toramaru’s model, in which all bubbles are as-sumed to have the same size, cannot observe the decrease in the bubble number density due to the Ostwald ripening. The disappearance of some small bubbles can be described because our study takes the size distribution of bubbles into account.
Fig. 4. Time-evolutions of the volatile concentration (a), the nucleation rate (b), and the number density of bubbles (c) for = 2×10⁴.
This corresponds to themediumviscosity system. Other parameters are equal to reference values. In Panel (a), the solid and dotted lines indicate the volatile concentrationCand the equilibriumvalueCeq, respectively. The volatile concentration decreases after the nucleation of bubbles (at
x=8.5×10⁻²) and rapidly approaches to the equilibrium
concentra-tion. The bubble number density considerably decreases owing to the Ostwald ripening after the nucleation.
However, it should be noted that the nucleation rate be-comes larger than former two cases. Another difference is that bubble nucleation never ceases even if the volatile con-centration decreases. The high viscosity hinders the bub-ble growth. As a consequence, volatilemolecules in liquid are consumed only by the nucleation of bubbles. It is con-cluded that bubble nucleation in liquid with the high vis-cosity evolves as keeping the large supersaturation ratio to some extent.
Time-evolutions of the nucleation rate in the case of
=1×10⁴(a), 2.5×10³(b), and 1×10³(c) are shown in Fig. 6. As seen in Fig. 6, the duration time of nucleation is prolonged with decreasing. The higher viscosity pre-vents bubbles fromgrowing. The prohibition of the bubble growth leads to the slight decrease in the volatile concen-tration. Therefore, the supersaturated state is predominately released by the nucleation of bubbles. When bubbles grow
Fig. 5. Time-evolutions of the volatile concentration (a), the nucleation rate (b), and the number density of bubbles (c) for=1×10². This
corresponds to the high viscosity system. Other parameters are same as reference values. In Panel (a), the solid and dotted lines indicate the volatile concentration Cand the equilibriumvalueCeq, respectively. The volatile concentration begins to decrease aroundx =0.09. How-ever, the nucleation rate slowly increases and the number density of bubbles also increases with time.
to the large size, they lead to the considerable decrease in the volatile concentration. As a result, the nucleation rate tends to zero and bubble nucleation stops.
3.2 The Ostwald ripening
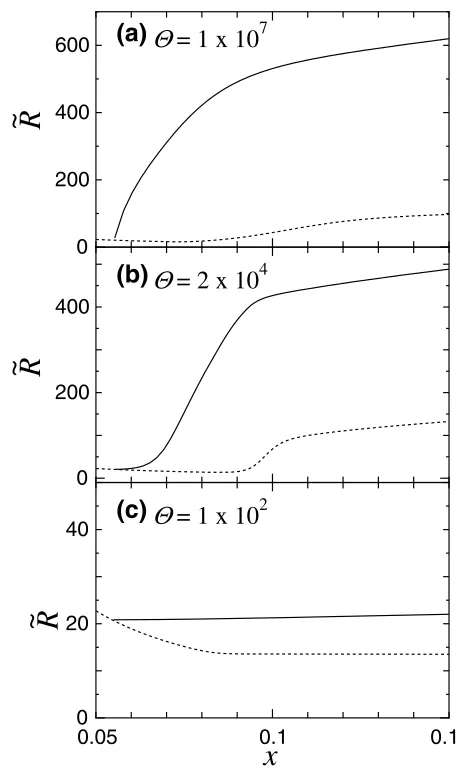
Let us consider how the liquid viscosity influences the bubble growth. Time-evolution of the radius R˜ of a bub-ble nucleated atx =5.5×10⁻² is presented in Fig. 7(a),
(b), and (c) for the cases of = 1×10⁷, 2×10⁴, and
1×10², respectively. As shown in Fig. 7(a), bubble can
Fig. 6. Time-evolutions of the nucleation rate for = 1×10⁴ (a), 2.5×10³(b), and 1×10³(c). Other parameters are same as reference
values. Panels (a), (b), and (c) correspond to the low,medium, and high viscosity systems in region II which is explained in Subsection 3.3, respectively. As smaller(larger the viscosity), longer the duration time of nucleation.
large pressure difference between liquid and gas within a bubble. As bubbles grow enough, the pressure difference between liquid and a bubble becomes small. Then, the bub-ble growth becomes the diffusive growth. It is found from Panels (b) and (c) that the liquid viscosity has a significant effect on the delay time of the bubble growth. As indicated in Fig. 7(c), extreme high viscous liquid prohibits the bub-ble growth. According to which parameter does control the bubble growth, the behavior of growth is different. Our re-sults agree with the behavior of the bubble growth presented in Toramaru (1995).
The dissolution of bubbles, that is, the Ostwald ripening, occurs when the bubble radius becomes smaller than the critical radius. Time-evolutions of the radius of bubbles nucleated atx =5.5×10⁻², 6.5×10⁻², and 7.8×10⁻² are shown in Fig. 8 for the case of=2×10⁴. As found
in Fig. 8, bubbles nucleated earlier can grow to the larger size and they make a major contribution to the decrease
Fig. 7. Time-evolutions of the radius of bubbles for= 1×10⁷ (a),
2×10⁴(b), and 1×10²(c), respectively. Panels (a), (b), and (c)
cor-respond to the low,medium, and high viscosity systems, respectively. Other parameters are same as reference values. The solid and dotted lines indicate the radius of bubbles nucleated atx =5.5×10⁻²and the
critical radius, respectively. In liquid with the high viscosity, the bub-ble growth is restrained strongly. By exhibiting the growth of bubbub-bles nucleated atx =5.5×10⁻², one can clearly understand the effect of the liquid viscosity on the bubble growth before the Ostwald ripening occurs.
Fig. 8. Time-evolution of the radius of bubbles nucleated at different times for=2×10⁴. Other parameters are same as reference values. The solid, dashed, and dot-dashed lines represent the time-evolutions of the radius of bubbles nucleated atx = 5.5×10⁻², 6.5×10⁻², and
7.8×10⁻², respectively. Alternatively, the dotted line corresponds to
the critical radius. The size of bubbles nucleated atx =7.8×10⁻²
becomes smaller than the critical radius beforex = 0.1. Therefore, these bubbles dissolve again and disappear. Noted that bubbles with the smaller radius than the critical radius are removed fromour numerical simulations. So, their time-evolutions after the Ostwald ripening are not calculated in order to save the CPU time.
3.3 Dependency of viscosity, diffusion coefficient, and surface tension on the number density of bubbles
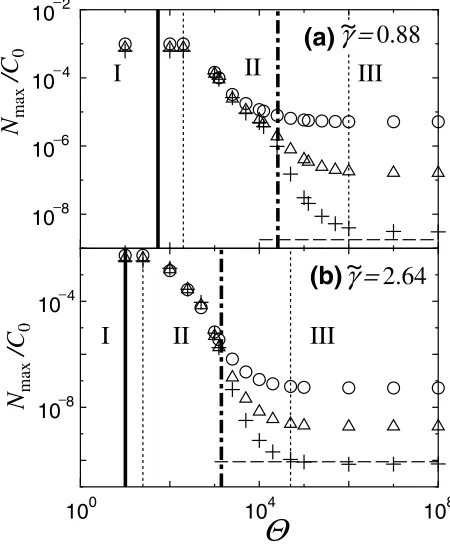
Although the number density of bubbles changes with time owing to the Ostwald ripening after bubble nucleation ceases, it is helpful that we first see the maximumnum -ber density of bubbles in order to investigate the effect of the volatile diffusivity, the liquid viscosity, and the surface tension on bubble formation. The numerical results of the maximumnumber density are shown for, , and γ˜ in Fig. 9. Panels (a) and (b) correspond toγ˜ =0.88 and 2.64, respectively. As seen fromFig. 9(a) and (b), the behavior of bubble formation is divided into three regimes. Hence-forth, we call each region as region I, II, and III. In the low range ofcalled region I where corresponds to the high liquid viscosity, themaximumnumber density does not de-pend onbut itmarginally depends on. On the other hand, in the high range ofcalled region III where cor-responds to the low liquid viscosity, themaximumnumber density mostly depends on . In the middle range of called region II, where corresponds to themiddle viscosity, themaximumnumber density is predominantly sensitive to
. Regions II and III correspond to the viscosity-controlled and diffusion-controlled regime found by Toramaru (1995). On the other hand, region I is newly presented by our study. The solid and dot-dashed lines show the border lines be-tween regions I and II and regions II and III, respectively. They are provided by the analytical expressions described later. The value ofon each border line between regimes is named asI/IIandII/III. Two dotted lines correspond to
the border lines between regions I and II and regions II and III speculated fromnumerical results. In our study, each regime is distinguished on the basis of the analytical ex-pressions although the analytical results diverge fromthe numerical ones owing to the approximation in the analyti-cal conditions.
Fig. 9. Themaximum number densities for = 9×10⁵ (circles),
9×10⁶(triangles), and 9×10⁷(crosses) are plotted as a function of
. Panels (a) and (b) correspond toγ˜ = 0.88 and 2.64, respectively. The vertical thick solid and dot-dashed lines represent the border line between regions I and II and regions II and III, respectively, in the case of=9×10⁷. Noted that the values of the threshold between regions I
and II and regions II and III are given by Eqs. (50) and (49), respectively, in the case of=9×10⁷. On the other hand, the dotted lines between
regions I and II and regions II and III are settled by the numerical results. In addition, the dashed line represents the approximate number density of bubbles given by Yamadaet al.(2005), that is, Eq. (47), for =9×10⁷.
In region I, themaximumnumber density of bubbles is constant regardless of themagnitude of the viscosity be-cause their growth is suppressed by the viscous resistance of liquid during the decompression time. As shown in Fig. 9, the calculatedmaximumnumber densities of bubbles are 6.1 ×10⁻⁴, 7.6 ×10⁻⁴, and 9.9 ×10⁻⁴ in the case of
˜
γ = 0.88 and = 1×10 for = 9×10⁷, 9×10⁶,
and 9×10⁵, respectively, and 3.3×10⁻³, 4.2×10⁻³, and
5.5×10⁻³ in the case ofγ˜ = 2.64 and = 1×10 for = 9×10⁷, 9×10⁶, and 9×10⁵, respectively. The
weak dependence ofmaximumnumber density on orig-inates fromthe preexponential factor of the nucleation rate (see in detail in Appendix A). Since the bubble size is al-most equivalent to the critical size, themaximumnumber density of bubbles is given by
NmIax 3φ 4πR3
cr
, (34)
Fig. 10. The regime of the bubble formation process as function of two parameters,γ˜andfor=9×10⁷. Two solid lines indicate the boundary lines between regions I and II and regions II and III. The boundary line between regions II and III, which is labeled asII/III, is
decided by the analytical expression (Eq. (49)) and the boundary line between regions I and II, which is labeled asI/II, by the analytical
expression (Eq. (50)). The circles represent the values ofat which the maximumnumber density begins to vary with, whereas the squares correspond to the values offromwhich themamimun number density is constant against. These are predicted on the basis of numerical results. Two dotted lines are lines optimized fromdata of circles or squares. The gradient of each dotted line is given on the basis of the analytical expression. The dotted line through circles is given as log10 = −3 log10γ˜ +5.8 and the dotted line through squares as
log10= −1.5 log10γ˜+2.3. The dashed part ofII/IIIindicates that
the assumption of smallxJ, which is used in deriving Eq. (49), is rough
and the analytical expressionmay be inappropriate.
In region II, themaximumnumber densities depend on only. In this regime, themaximumnumber density dra-matically decreases as increases. In region II, the de-pendence only on is caused fromthe fact that the vis-cosity has a significant effect on the bubble growth (see Fig. 7(b)). On the other hand, in region III, themaximum number density changes as Nmax ∝ −3/2and this
depen-dence is caused fromthe fact that the bubble growth is con-trolled by the diffusion and reproduced by the approximate solution in Yamadaet al.(2005). In addition, there is a tran-sition area where themaximumnumber density of bubbles changes according to not onlybut alsobefore region II. Such dependence of the bubble number density on the vis-cosity and the volatile diffusivity is qualitatively indicated by Toramaru (1995).
As compared with Fig. 9(a), the range of region III in Fig. 9(b) is wider for a given. In other words, region III shifts to the lower range ofas the surface tension is larger. The dependence of the area of each regime onγ˜, which is presumed as the surface tension, is demonstrated in Fig. 10 for =9×10⁷. As found in Fig. 10, the values of
I/II
andII/III decrease by about a factor of 5 and an order of
10, respectively, asγ˜ increases threefold. Thismeans that the area of region II is narrower as the largerγ˜. Bubble for-mation is basically controlled by the viscosity in the smaller range ofthanII/III, whereas it ismainly controlled by
the diffusion in the larger range ofthanII/III. Actually,
as found fromnumerical results (see in Fig. 9), the influ-ence of the viscosity on the nucleation process of bubbles
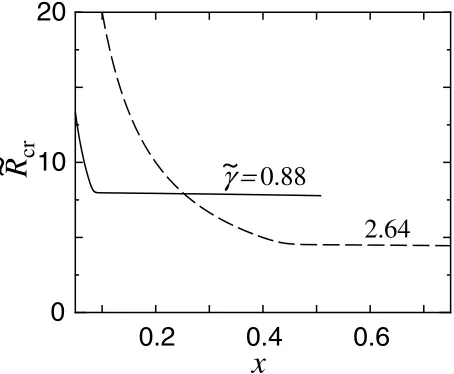
Fig. 11. Time-evolutions of the critical radius in the case ofγ˜ = 0.88 (solid line) and 2.64 (dashed line). The parameteris 1×10 and other parameters are equal to the reference values. In the case ofγ˜=0.88, the numerical simulation ends since the void ratio becomes 0.3 atx0.5. Thus, the solid line terminates there.
gradually appears fromthe smaller range ofin region III. Consequently, themaximumnumber density depends on and before the border line ofII/III. Furthermore,
re-gion I also begins fromthe larger range ofthanI/II. In
Fig. 10, two dotted lines are numerically determined. It is, then, noted that the gradient of lines is given by a simple formof analytical expressions, as described later.
All values of parameters used in this study do not cover the range of realisticmagma parameters. Especially, the surface tension is smaller than that for water vapor and sili-cicmelt interface, which is approximately 0.1 N/m accord-ing to Bagdassarovet al.(2000). Given the realistic value of the surface tension, bubble formation is expected to pro-ceed in a similar way as that in region III for any viscosity of silicicmelts at the high temperature (Hess and Dingwell, 1996; Zhanget al., 2007).
The larger surface tension suppresses bubble nucleation. It is found fromFig. 9(b) that the number density of nucle-ated bubbles is small compared to that in Fig. 9(a) in region III for a given. When the number density of bubbles is smaller, each bubble can grow larger. On the other hand, the number density of bubbles is larger in region I in the case of Panel (b) than Panel (a) for a given. The larger supersat-uration ratio is needed to trigger the nucleation in the case of the larger surface tension. This implies that the critical radius is smaller. Therefore, the number density of bubbles increases in region I. Figure 11 shows the time-evolutions of the critical radius in the case ofγ˜ =0.88 and 2.64. The parameteris 1×10 and other parameters are set to be the reference values. As seen in this figure, the critical radius actually settles down at the lower level in the case of the larger surface tension.
Fig. 12. The ratio of themaximumnumber density of bubbles to the final number density of bubblesNfin/Nmaxfor=9×105(circles), 9×10⁶
(triangles), and 9×10⁷(crosses) are plotted as a function of. Panels (a) and (b) correspond toγ˜=0.88 and 2.64, respectively. The vertical solid and dot-dashed lines represent the border line between regions I and II and regions II and III in the case of=9×10⁷, respectively. The
dotted lines correspond to boundaries between each regime determined fromnumerical results.
the number density of bubbles obtained at the end of our numerical simulations the final number density of bubbles. The ratios of the final number density of bubblesNfinto the
maximumnumber density of bubblesNmaxare represented
for,, andγ˜ in Fig. 12. Then, the values ofγ˜ are 0.88 and 2.64 in Panels (a) and (b), respectively. It can be seen fromFig. 12 that the ratio Nfin/Nmax is equivalent to unity
in region I and the final number density of bubbles slightly diminishes fromthemaximumnumber density in region III. In region II, the ratio decreases greatly. For example, it falls below 1×10⁻²in both Panels (a) and (b) in the case
of = 9×10⁷. Smaller N
fin/Nmax is brought as larger
the diffusion coefficient. When the diffusion coefficient is large, bubbles nucleated at the early time can rapidly gather many volatile molecules in liquid. From our numerical results, it is concluded that almost all of nucleated bubbles can survive in regions I and III. On the other hand, in region II, small bubbles nucleated at the late time disappear due to the Ostwald ripening.
One can wonder about the dependency of the surface ten-sion, the diffusion coefficient, and the viscosity on theNmax
toNfinratio. For example, when the surface tension is large,
region III extends toward the range of lowerand the drop rate ofNfin/Nmaxappears to be very steep, whereas them
in-imumvalues ofNfin/Nmaxmay be insensitive to the surface
tension. It is, however, difficult to analytically clarify the relation between the ratio and thematerial parameters such as the diffusion coefficient, the viscosity, and the surface
10 8
10 6
10 4
10 2
100 104 108
108
104
(a)
(b)
γ =
0.88
γ =
2.64
Θ
N /C
0
N /C
0
~
~
I
II
III
I
II
III
−
−
−
−
−
−
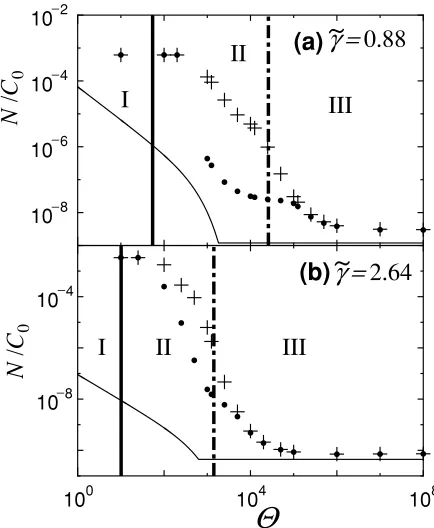
Fig. 13. The number densities againstin the case ofγ˜ = 0.88 (a) and 2.64 (b) for=9×10⁷. The cross, the circle, and the solid line
correspond to themaximumnumber density of bubbles,Nmax, the final
number density of bubbles,Nfin, and the results presented by Toramaru (1995), respectively. In the large range of, results of bothmodels are consistent within one order of themagnitude. The results of Toramaru (1995) are whollymuch smaller thanNmaxand somewhat smaller than Nfin.
tension. Our study is in progress to determine which range of parameters leads to the large decrease in bubble number density due to the Ostwald ripening.
Toramaru (1995) presented the viscosity and diffusion controlled regime, which correspond to regions II and III in our paper, respectively, for the nucleation and growth processes and derived the empirical expression of the fi-nal number density of bubbles fromhis numerical results. Themaximumnumber density of bubbles, the final num -ber density of bubbles, and the results presented by Tora-maru (1995) are shown in Fig. 13(a) and (b) in the case of
˜
γ =0.88 and 2.64, respectively, for=9×10⁷. As seen
in Fig. 13, our results are greater than ones by Toramaru’s empirical expression and begin to increase at the larger than Toramaru’s result. The size distribution of bubbles is taken into account in our study. On the other hand, Tora-maru (1995) assumed all bubbles to have an equal size. The number density of bubbles is basically governed by small bubbles nucleated at the late time. The growth process of small bubbles is easy to be influenced by the viscosity. Hence, the effect of the size distribution yields the discrep-ancy in the behavior of the bubble number density between both studies.
3.4 Analytical expression for boundary between
re-gionsII and III
II and III, the influence of the diffusivity and the viscosity upon bubble formation switches. So, this border line is the important line. Each region is basically defined by the be-havior of themaximumnumber density of bubbles. Hence, an analytical expression of the maximumbubble number density is necessary to see its dependence onmaterial quan-tities. In order to do so, let us derive approximate solutions to themaximumnumber density of bubbles in the case of region II in the samemanner used in Yamadaet al.(2005). In the analytic procedure, we assume that non-dimensional time x and |1 − ˜C| are small as compared with unity. Therefore, we assume that C˜ can be replaced with unity on the right hand side of basic equations. Here-after, let us call this assumption as the zero-th order approx-imation. The non-dimensional equilibriumconcentration is given in the zero-th order approximation by
˜
Ceq=1−(1−β) x
m, (35)
where the second and higher order terms ofxare neglected. Then, the non-dimensional formof the zero-th order nucle-ation rateJ˜0is to evaluate the time-evolution of the volatile concentration
˜
C(x). To derive the approximate expression of the bub-ble radius, the interfacial concentration is set to be the ini-tial concentration because the internal pressure is high for a small bubble in the case of the high viscosity. Replac-ingC˜in with unity in Eq. (2), the internal pressure P˜gas is
given as 1−βx. Integrating Eq. (22) in the zero-th order approximation, we have (see Appendix B in detail)
˜
As seen fromEq. (38), bubbles exponentially expand when the growth is controlled by the viscosity.
Substituting Eqs. (36) and (38) into Eq. (23), it is, in the zero-th order approximation, written as
1− ˜C(x)= 3α
The exponential function in the integrand has amaximum at x = √a/b. Henceforth we define√a/b as x0. This
implies that bubbles nucleated around x = x0 govern the
total volume of bubbles.
Because of the strong sensitivity of the exponential factor tox, we can expand the exponential factor in the integrand aroundx = x0. Performing the integration, we obtain the
volatile concentration as
nucleation rate has itsmaximumis given by the solution dS/dx=0. Using Eqs. (3) and (42), we have the following
Fig. 4. Noted that the derivation of Eq. (43) is described in detail in Appendix C.
Because of the exponential dependence of the nucleation rate onx, it can be expanded around x = xJ. Note that
this expansion is valid only when the nucleation rate has a sharp maximumlike Fig. 6(a). Then, using Eq. (42), the approximate expression of the nucleation rate is given by
˜ Substituting Eq. (44) into Eq. (31), we have for them axi-mumnumber density of bubbles
Substituting the values used in Fig. 4 into Eq. (46), the ap-proximatemaximumnumber density is 2.4×10⁻⁶, whereas
the numerical value is 1.6×10⁻⁶. Noted that the difference
According to Yamada et al. (2005), the approximate
condition that themaximumnumber density of bubbles in region II is equal to that in region III. Although them ax-imumnumber density diverges from NIII
max in the proxim
-ity ofII/III, the bubble formation process in region III are
mostly governed by the diffusive growth of bubbles. There-fore, it is still available to determine analytically the value ofII/III. Equating Eq. (46) to Eq. (47), the threshold of the
transition fromregions II to III is given by (see Appendix D in detail)
Putting reference values other than into this equation,
II/III is approximately estimated as 3×10⁴. In Fig. 9,
the vertical dot-dashed line represents the value ofII/III.
Yamadaet al.(2005) obtained a2/x2
J = 2.5 ln+lnB1
as an approximate estimation of Eq. (48), where B1 is α2.5(γ /˜ 3)5.5(3/m)1.5/2π/(1−β)2.5. Substituting this
ap-proximate evaluation into Eq. (49), we find that the pa-rameterII/IIIlogarithmically depends on the diffusion
co-efficient and inversely on the surface tension through a2
(∝ ˜γ3).
In Eq. (38), replacing x with xJ and since x is com
-parable to xJ immediately after the nucleation, the
expo-nent of the expoexpo-nential function is approximately given by 2b2xJ(x −xJ)/3. Thus, the expansion time of
bub-bles is typically given as 3tP/2b2xJ. On the other hand, (√2x3J/a2)tPcorresponds to the duration time of nucleation
in the case that the bubble growth is governed by the diffu-sivity (see Yamadaet al.(2005)). Hence, Eq. (49) implies that the effect of the viscosity on bubble formation is sig-nificant when the expansion time of bubbles is longer than about 0.6 times duration time of nucleation.
3.5 Analytical expression for boundary between
re-gionsI and II
Let us derive an analytical expression ofI/II. In region
I, the bubble growth does not proceedmuch owing to the viscous resistance. In other words, region I is character-ized by the fact that the typical growth time of bubbles is longer than the decompression time. Asmentioned pre-viously, the typical growth time of bubbles, which is con-trolled by the viscosity, is roughly estimated as 3tP/2b2x.
Therefore, since the typical growth time is equivalent to the decompression time at the boundary between regions I and II, we obtaintP =3tP/2b2x.
We now consider the characteristic value ofxin region I such asxJ described above. In region I, the nucleation rate
continues to increase. As described in Appendix A, there is a turning point that the nucleation rate changes fromthe rapid increase to the slow increase (see in Fig. 5). The time, x1, corresponding to the turning point is evaluated as the
analytical formin Appendix A. We regard the growth time of bubbles nucleated atx = x1 as a characteristic growth
time of bubbles in region I. Accordingly, replacingx with x1and using Eq. (40), we have
I/II=
4
(1−β)x1
, (50)
wherex1is given by Eq. (A.4). In order to understand the
relation betweenI/IIand each parameter, we consider an
analytical expression ofx1assuming thatβx1 1. Under
this assumption,x1is approximately given by
x12exp
The variation of the preexponential function on the left hand side of Eq. (51) is less drastic than that of the ponential function. Hence, we obtain the first-order ex-pression of x1 as x1 = a/
sensitive to logarithmicallyand inverselyγ˜3/2througha.
3.6 Thesize distribution of bubbles
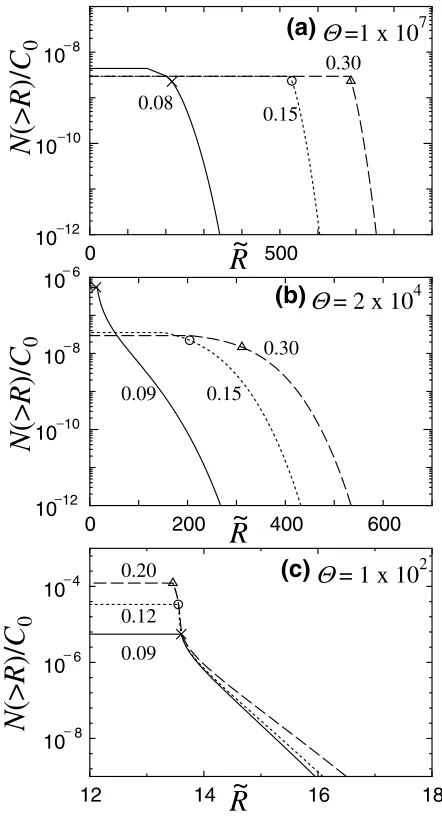
In this subsection, we see the time-evolution of the cum u-lative number density of bubbles. In Fig. 14, the cumulative size distributions are provided for the case of=1×10⁷
(a), 2×10⁴(b), and 1×10²(c), respectively. In Panel (a), the
cumulative number densities of bubbles atx =0.08, 0.15, and 0.3 are presented. It is shown in this figure thatmost of bubbles are distributed to a relatively narrow size range. When the bubble growth is controlled by the diffusivity, the growth rate of small bubbles is larger than that of large bub-bles. Thus, the dispersion in the bubble size distribution becomes smaller as bubbles grow larger. Of course, such unimodal size distribution means that most bubbles have similar size.
In Panel (b), the solid, dotted, and dashed lines corre-spond to the cumulative number density of bubbles atx = 0.09, 0.15, and 0.3, respectively. It is seen fromFig. 14(b) that the cumulative number density of bubbles just after the nucleation stops (atx = 0.09) has a broader distribution than that in Fig. 14(a). Asmentioned previously, the growth rate of bubbles immediately after the nucleation is approxi-mately given by 3/2b2x
J. This sole growth ratemeans that
Fig. 14. Cumulative number densities of bubbles for= 1×10⁷(a),
2×10⁴(b), and 1×10²(c), respectively. Panels (a), (b), and (c)
cor-respond to the low,medium, and high viscosity systems, respectively. Other parameters thanare equal to reference values. In Panel (a), the solid, dotted, and dashed lines represent the cumulative number densi-ties of bubbles atx=0.08, 0.15, and 0.30, respectively. In Panel (b), the solid, dotted, and dashed lines represent the cumulative number den-sities of bubbles atx=0.09, 0.15, and 0.30, respectively. In Panel (c), the solid, dotted, and dashed lines represent the cumulative number den-sities of bubbles atx =0.09, 0.12, and 0.20, respectively. The cross, circule, and triangle on each curve indicate the size of bubbles at which the size distribution of bubbles in the normal style, F(R), attains the maximumvalue.
dispersion at the same time. Noted that one can confirmin Fig. 14(b) that the cumulative number density in the small range of bubble size (R˜ ≤50) decreases with time owing to the Ostwald ripening.
Bubble formation significantly depends on the size distri-bution of bubbles through the time-evolution of the volatile concentration. In the case that the size distribution of bub-bles is an unimodal distribution with a small dispersion, bubbles with the average size have most of total volume of the gas phase. This case can be reproduced by Tora-maru’smodel (1995). However, the size distribution like
Fig. 14(b) cannot be regarded as an unimodal distribution. Hence this causes the difference in the time-evolution of the volatile concentration between our model and Toramaru’s model (1995) at the early stage.
The time-evolution of the cumulative number density of bubbles in the case of the extreme high viscosity is shown in Fig. 14(c). The solid, dotted, and dashed lines correspond to the cumulative number density of bubbles atx = 0.09, 0.12, and 0.20, respectively. In the case of the extreme high viscosity, the cumulative number density of bubbles shows a rapidly decreasing function against the bubble size. Since liquid with the high viscosity hinders the bubble growth, a large number of bubbles are formed within the small size range.
4.
Di
s
cu
ss
ion and Conclu
s
ion
s
We investigated bubble formation in a viscous com press-ible liquid under decompression. Our results are useful in deriving informations fromdata of bubble vesiculation in experiments. This study is summarized as follows.
1) The effect of the Ostwald ripening on the bubble num -ber density was explained clearly by taking into ac-count the size distribution of bubbles. This study obvi-ously pointed out the possibility that the number den-sity of bubbles decreases in a different way from bub-ble coalescence. In region II, the Ostwald ripening leads to the considerable decrease in the number den-sity of bubbles after bubble nucleation ceases. On the other hand, in region I, since the liquid viscosity pre-vents bubbles from growing, the number density of bubbles continues to increase. The volatile element in liquid is consumed only by bubbling. The Ostwald ripening does not have a serious effect on the tim e-evolution of the bubble number density in region III because bubbles can rapidly grow to the large size. 2) We derived analytical solutions to the threshold
be-tween regions II and III,II/III, by using the
analyt-icalmethod of Yamada et al.(2005). The transition fromregions III to II occurs when the expansion time of bubbles extendsmore than 0.6 times duration time of nucleation. Then, the threshold parameter II/III,
which is given by Eq. (49), is weakly sensitive to the diffusion coefficient and strongly to the surface ten-sion. It is approximately proportional toγ˜−3. In
ad-dition, analytical expression of the threshold between regions I and II, I/II, was derived and is given by
Eq. (50). In region I, the typical growth time of bub-bles is large compared with the decompression time. The threshold parameter,I/II, depends on weakly the
diffusion coefficient and directly the surface tension. It is approximately proportional toγ˜−1.5.
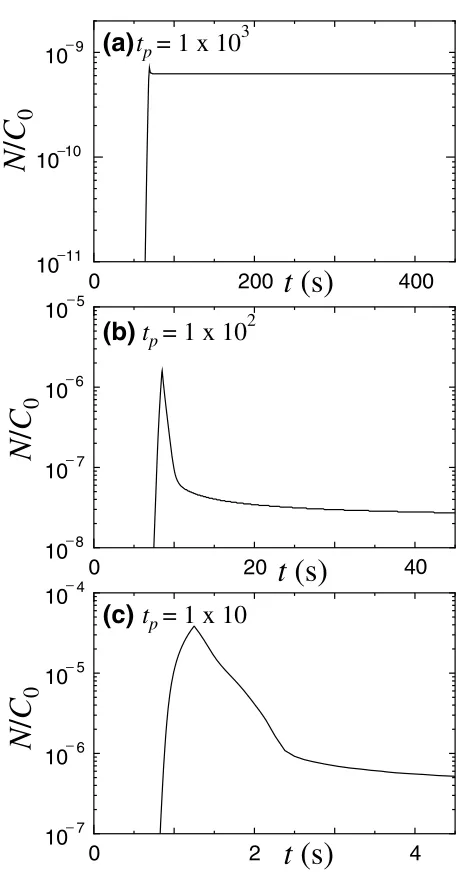
Fig. 15. Time-evolutions of the bubble number density fortP=1×10³s
(a), 1×10²s (b), and 1×10 s (c), respectively. Note that the abscissa
axis in this figure is not normalized. The viscosity is 5×10⁵Pa·s and
the diffusion coefficient is 1×10⁻¹³m2/s. Other parameters are equal
to the reference values. In the case of the high decompression rate, the Ostwald ripening occurs and causes the larger decrease in the bubble number density.
indicated by Eq. (38). Even at the later stage, the size distribution has a wide dispersion. In the case of the extreme high viscosity, the bubble growth is prohibited by the viscosity and the size distribution of bubbles also becomes unimodal. Then, the radius of bubbles is as small as the critical radius and only the number density of bubbles increases with time. Fromthese re-sults, the size distribution of bubbles would become an unimodal size distribution when the void ratio approx-imately attains to 0.3, except themiddle range of the liquid viscosity. Under an unimodal size distribution, the relative velocity between bubbles is small and the bubble collision would scarcely occur in a hydrostatic state. Thus, the coalescence of bubbles is likely to take
place owing to the breakup of liquid filmwhen bubbles grow enough.
Since we focused the dependency of the diffusion coeffi-cient and the viscosity on bubble formation, we regarded the variation ofandas that of the viscosity and the diffu-sion coefficient. However, noted that this variation of non-dimensional parameters can be reread as the variation of the decompression rate which is a key parameter. In exper-iments, the decompression rate is one of freely controlled parameters. Hence, it is useful to show explicitly the num er-ical results of bubble formation for various decompression rates. The time-evolution of the bubble number density is shown in Fig. 15(a), (b), and (c) fortP =1×10³s, 1×10²
s, and 1×10 s, respectively. The viscosity and the diffu-sion coefficient are fixed as constant. As seen in Fig. 15, the bubble number density decreases after the number den-sity of bubbles attainsmaximum. When the decompression rate is small (ortP is large), a number of nucleated
bub-bles is small and bubbles have the growth time enough be-fore a super-saturated state is released. Therebe-fore, the Ost-wald ripening rarely occurs. The decompression rate plays a same role as the viscosity in the time-evolution of bubble nucleation.
In this study, we neglect the coalescence between bub-bles. However, it is pointed out fromthe decompression ex-periments that the coalescence between bubbles leads to the decrease in the bubble number density (Larsen and Gard-ner, 2000; Larsenet al., 2004). In addition, the interac-tion between bubbles such as bubble coalescence signifi-cantly influences the time-evolutions of the size distribution (Gaonac’het al., 1996). Thus, it is expected that bubble co-alescence will change the size distribution of bubbles and the bubble number density at the later time. This problemis still remained. It is needed to quantitatively investigate the behavior of bubble coalescence in the future.
Acknowledgments. We wish to thank H. Tanaka and A.
Tora-maru for useful discussions and helpful comments. We also have benefited fromcomments by S. Takeuchi and S. Okumura. We thank A. Proussevitch and an anonymous reviewer for their insight comments that greatly improved themanuscript.
Appendix A. Derivation of the Analytical Expre
s
-s
ion of the Maximum Number
Den-s
ity of Bubble
s
in Region I
In the case of bubble nucleation in highly viscous liq-uid, the nucleation rate increases slowly after bubbles are formed to some extent. Thismeans that the critical radius hardly varies. First we introduce the timex1 when the
in-crease speed of the nucleation rate begins to slow down. The problemaddressed here is to determine the timex1
fromwhichmost bubbles begin to be formed in liquid with the extreme high viscosity. As found fromFig. 5, the behav-ior of the nucleation rate in the case of the high viscosity is divided into two phases, that is, the rapid increase phase and the slow increase phase of the nucleation rate. In order to derive an approximate expression, we assume that the nu-cleation rate in the rapid increase phase is given by J˜0(x),
Fig. A.1. Time-evolution of the nucleation rate in the case of=1×10². The other parameters are equal to reference values. The solid line represents the numerical result which is same as that of Fig. 5(b). As found from this figure, there are two phases that the nucleation rate increases rapidly and slowly. The rapid increase phase and the slow increase phase correspond to the period before and after the timex1, respectively. In the rapid increase phase, the numerical result of the nucleation rate is approximately produced byJ0˜(x)(dotted line), which is given by Eq. (36). On the other hand, it is represented as the constant valueJ0˜(x1)(dashed line) in the slow increase phase. Since the slow increase phase ismuch longer than the rapid increase phase, many bubbles are formed in this phase. The timex1 is given by Eq. (A.4) and displayed by the vertical solid line.
derive the expression ofx1, wemake use of the analytical
method of Yamadaet al.(2005).
In highly viscous liquid, the bubble growth does not pro-ceedmuch. So, it is reasonable that the radius of bubbles is assumed to be equal to the critical radius. Then, Eq. (23) is approximately expressed by
dC˜
At the beginning of nucleation, the decrease in the volatile concentration is small. Therefore, we can assume that|1− ˜C| 1. Using this assumption, we obtain from
In this analytical method, the assumption that x 1 is needless.
In region I, the significant feature of the time-evolution of nucleation is that there are the rapid(x < x1)and slow
Substituting Eq. (3) into Eq. (A.3) and using Eq. (A.2), the approximate expression ofx1is provided by
αγ˜2
Bubbles nucleated atx > x1 have a great effect on the
number density of bubbles and the void ratio. Therefore, the number density of bubbles is approximately given as the analytical formin region I by
N(x) C0
˜J0(x1)(x−x1). (A.5)
On the other hand, the void ratioφis defined by
φ=α
x
0