Volume 2009, Article ID 261815,10pages doi:10.1155/2009/261815
Research Article
The Performance of Relay-Enhanced Cellular OFDMA-TDD
Network for Mobile Broadband Wireless Services
Kyungmi Park,
1Hyun S. Ryu,
1Chung G. Kang,
1Daeyoung Chang,
2Seungho Song,
2Jongguk Ahn,
2and Jongtae Ihm
21School of Electrical Engineering, Korea University, Seoul 136-701, South Korea 2SK Telecom Access Network R&D Center, Seoul 100-999, South Korea
Correspondence should be addressed to Chung G. Kang,[email protected]
Received 7 January 2009; Revised 20 April 2009; Accepted 20 May 2009
Recommended by Dmitri Moltchanov
A multihop relay (MR) and repeater are useful means for improving system throughput and coverage in a cellular mobile packet access system, as the carrier-to-interference ratio can be improved when deploying them in a heavily shadowed region. In this paper, we report on our investigation of bandwidth efficiency and the associated service outage performance for different relay scenarios, using system level simulation for a cellular Orthogonal Frequency Division Multiple Access-Time Division Duplexing (OFDMA-TDD) system. We have demonstrated that network throughput gain by typical optical repeaters, which have a simple amplify-and-forwarding capability in a full-duplexing mode, could be minimal in open space subject to cochannel interference from all repeaters in the neighboring cells. This is true, even though they are generally useful for warranting the outage performance with a multiple order of combining gain, especially in the destructive area, for example, basements or indoors with heavy wall attenuation, that naturally shields interference. Meanwhile, we show that multihop relays increase the average system capacity (almost doubling the system throughput) by fully reusing the frequency in every relay station, while improving the per-user data rate in the cell edges or improving the outage performance in the heavily shadowed areas.
Copyright © 2009 Kyungmi Park et al. This is an open access article distributed under the Creative Commons Attribution License, which permits unrestricted use, distribution, and reproduction in any medium, provided the original work is properly cited.
1. Introduction
MultiHop relay systems are considered as a useful means to enhance coverage, throughput, and capacity of mobile wire-less broadband, for example, IEEE 802.16e mobile wirewire-less MAN (also known as Mobile WiMAX) [1]. The gains in coverage and throughput can be leveraged to reduce the total deployment costs for a given system performance require-ment and thereby improve the economic viability of those systems. The IEEE 802.16j MultiHop relay (MR) task group is one example of standardization activities toward relay-enhance cellular system (RECS). This group enables exploita-tion of such advantages, specifying an OFDMA physical layer and medium access control layer enhancements to the IEEE 802.16 standard for licensed bands to facilitate the operation of relay stations [2]. Furthermore, the MultiHop relay is considered an essential system element in the emerging IMT-Advanced standard of ITU-R for next generation mobile communication, including the 3GPP Long Term-Evolution (LTE-)Advanced standard and IEEE 802.16m standard. In
the current development of standard specification, initial efforts are required to understand the impact of relay nodes on the system performance and furthermore, to identify their advantages over the conventional repeaters [3].
division multiple access) CDMA. However, a portion of the radio resource must be dedicated to the relay link in a MR system; this naturally reduces the capacity of its access link. This particular aspect becomes critical as the number of relay stations connected to the base station (MR-BS) increases. That is, there exists an obvious trade-offbetween the frequency reuse gain and capacity loss associated with the additional links between the MR-BSs and RSs.
In the case where radio resource is fully reused by all the RSs, all subcells associated with the RSs are subject to performance outage due to other cell interference around the subcell edges. That is, a level of modulation and the coding set (MCS) for the subscribers located in the cell edge can be favorably boosted around relay stations. Meanwhile, all subcells are subject to co-channel interference that results in additional cellular outages. Conversely, a radio resource can be also orthogonally allocated among all the RSs without any frequency reuse, completely avoiding co-channel interfer-ence in the same cell, while limiting co-channel interferinterfer-ence from adjacent cells only to some data regions. However, for orthogonal allocation, the radio resource efficiency can be significantly reduced without fully exploiting the reuse gain of the relay system.
The nature of co-channel interference and resource allocation must be properly taken into consideration to assess the enhancement of system throughput and economical feasibility by employing the different types of relay systems, namely the optical repeater and MR. In this paper, we report on our investigation of the bandwidth efficiency achieved by the frequency reuse capability of a MR system and the associated service outage performance, using system level simulation for the cellular OFDMA-TDD system. Further-more, the performance of optical repeater and MultiHop relay is compared. We note that improvement of throughput performance in the downlink with the MultiHop relays has been demonstrated for CDMA and hybrid TDMA/FDMA systems in [4,5], respectively. However, no explicit compari-son between the repeater and relay systems has been made, especially for the cellular OFDMA system that employs adaptive modulation and coding schemes, in any of the previous studies.
This paper is organized as follows. Section 2 presents an overview of the cellular system with MultiHop relays and conventional repeaters. Its system-level models and simulation scenarios are detailed in Section 3. System-level simulation results are given in Section 4, providing the comparative analysis on throughput and outage performance for the MultiHop relay and optical repeaters under varying system conditions. Finally, concluding remarks are given in
Section 5.
2. System Overview: Multirelay
versus Repeater
2.1. A MultiHop Relay (MR) System. As shown inFigure 1,
a typical MR system consists of three station types: a base station for MultiHop relay (MR-BS), a fixed relay station (RS), and a mobile station (MS). The MS can communicate with an MR-BS either directly or over a 2-hop via the
MR-BS
RS1
RS2 MS1
MS3
RS3 MS2
Figure1: MultiHop relay-enhanced system.
RS. Even though more than two hops can be exploited via multiple RSs, we consider a simple relay with two hops by means of a single RS in the current analysis. The direct links between the MS and the MR-BS and between the MS and the RS are referred to as an access link, while the link between the RS and the MR-BS is referred to as a relay link. An RS implements a decode-and-forward (DF) function. A signal from the MR-BS is decoded first and then forwarded toward the MS and vice versa. As opposed to the amplify-and-forward (AF) relay type, adaptive modulation and coding (AMC) may be applied by taking the link condition between the RS and MS that allows full exploitation of the bandwidth by opportunistic scheduling between multiple users. Furthermore, bandwidth assignment can be controlled centrally by a packet scheduler in the MR-BS. As the bandwidth assignment results are broadcast to all RSs and MSs via a MAC management message, for example, the MAP message in the IEEE 802.16 standard, each RS can selectively serve the MSs only within its own coverage. This reduces co-channel interference from the neighboring cells.
Depending on whether a broadcast control signal, for example, MAP message, can be always reliably received within the coverage area, the relay operation is classified in two different modes: transparent and nontransparent [2]. For the nontransparent mode, all MSs served by an RS can receive the MAP message only via the RS, not directly from the MR-BS. As it can serve as a usage mode of coverage extension, it provides a most flexible relay function. Meanwhile, the transparent mode will serve only as a usage model of throughput enhancement, as it must operate under the condition that the downlink signal is always reachable to every MS within the coverage.
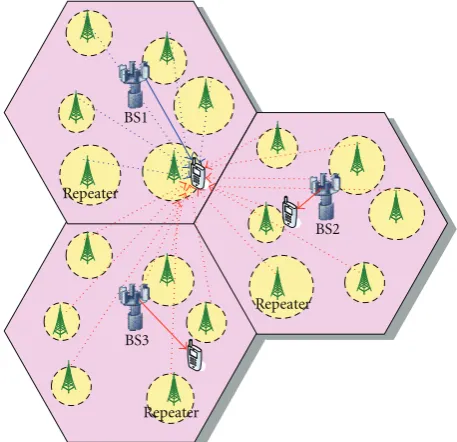
2.2. Optical Repeater. Carrier-to-interference and noise ratio
Repeater
BS1
Repeater
BS3
Repeater
BS2
Figure2: Co-channel interference from an optical repeater from neighboring cells.
with full duplex capability. It blindly amplifies the signal received from the MR-BS or vice versa, as illustrated in
Figure 2, as opposed to a selective decode-and-forwarding feature of the MR. In general, it is not known which MS is served by each repeater. This makes it clear that a frequency cannot be reused among the repeaters. Therefore, all repeaters without a selective forwarding feature can be a source of interference toward neighboring cells, reducing overall system throughput. Meanwhile, an optical repeater can use an entire radio resource for an access link, since a relay link is provided by a wire line. This implies that there must be proper trade-offinvestigations on throughput loss due to co-channel interference originated by the optical repeater, and reduction in radio resource dedicated to the relay link of the MR in the repeater-enhanced and MR-enhanced cellular systems, respectively.
3. Simulation Scenario and Modeling
In this paper, we report on our evaluation of the system-level performance of an OFDMA/TDD-based mobile wire-less broadband access system [6], enhanced with different types of relays: MultiHop relay stations and repeaters. Using system-level simulation, we derived insights toward understanding throughput and outage performance with a MultiHop relay system in a mobile wireless broadband network [7].
3.1. Frame Structure. We consider a frame structure, one
especially designed for a two-hop scenario with a single FA, corresponding to IEEE 802.16j. The frame structure varies with two operational modes, but we focus on the nontransparent mode. Figure 3illustrates the frame struc-ture for the nontransparent mode, seen from the individual
stations. In the nontransparent mode, each TDD frame is divided into downlink and uplink intervals, each of which is further divided into an access link interval for the MS (i.e., used for the BS-to-MS and RS-to-MS links) and a relay link interval for the RS (i.e., used for the BS-to-RS link) [8]. A characteristic of this particular frame structure is that its access link interval is shared with all MSs that are communicating directly with the BS, or indirectly via the RSs. For a nontransparent case, in which some of the MSs might not be able to directly receive the MAP message, bandwidth allocation results must also be relayed. Therefore, two different MAPs for the MS must be transmitted in the downlink, one for the MS directly served by the BS and the other for the MS served by the RS. Furthermore, there must be another MAP for the relay link, as it is orthogonally shared by multiple RSs.
3.2. Resource Allocation Schemes. In this paper, we consider
BS MS Downlink Uplink
Listen
Access zone Relay zone Access zone Relay zone
RS MS (BS RS)Listen RS BS
MS BS/RS Null
Figure3: Frame structures for IEEE 802.16j MultiHop relay network [5].
3.3. Carrier-to-Interference and Noise Ratio (CINR). In the
current analysis, we consider a diversity mode that forms the subchannels through a given pattern of subcarrier permutation. Thus, a CINR of each MS is determined by taking the average of all subcarriers assigned to it. LetCtotal,k
denote a received signal power of subcarrier k within the subchannels assigned to the MS and let Itotal,k denote the
corresponding interference. Then, the average CINR for each MS can be represented by taking the average of all subcarriers used by them, as follows:
C
where N0 and NF denote the thermal noise power and noise figure, respectively, while Nused denotes the number of subcarriers used by the MS. In a cellular system, without employing any type of relay, an MS is interfered with only by the neighboring BSs. Therefore, the total interference for the subcarrier kcan be determined by subtracting a total received signal power from a received signal power for serving the BS for the corresponding subcarrier as follows:
Itotal,k=
receiveddenotes the received signal power for subcar-rierkof a subchannel assigned to the MS served by the BS j.NSis the number of the BSs. In the sequel, we present the
C/I models for the MultiHop relay-enhanced and the optical repeater-enhanced cellular system.
3.3.1. The MultiHop Relay-Enhanced Cellular System. In this
case, Ctotal,k and Itotal,k vary with resource allocation type.
The overlapped allocation exhibits intracell interference between the access links (BS-MS links and RS-MS links), as well as other cell interference from all the BSs and RSs. The corresponding interference for the subcarrier kof the
subchannels assigned by serving the BSican be represented as follows:
receiveddenote the received signal power for the subcarrierk served by BSjand the received signal power for the subcarrier k served by the RSrassociated with BSj, respectively, whileNrj is the number of RSs associated with BS j. The first term in (3) represents the other cell interference, while the next two terms represent intracell interference among the access links.
Conversely, no intracell interference exists in orthogonal allocation. Other than a BS-MS link, only one of the RS-MS links in the neighboring cells is accounted for the other cell interference in each OFDM symbol. The level of interference from an RS-MS link in the other cell depends on which RS is activated by the bandwidth assignment in the same data region. In the current analysis, we simply take the average of the potential interference from all the RSs in the neighboring cells, assuming bandwidth is randomly assigned among all RSs, to reduce the simulation complexity. Letα(jk) andβ
(k)
j,r
denote the probability that the subcarrierkis allocated to the MS served by BSjand the probability that the subcarrier kis allocated to the MS served by RSr associated with BS j, respectively. Then, the average interference from all other cells can be represented by
Itotal,k=
RS serves the same number of MSs. In (4), we setα(jk) =
β(jk,r)=1/(Nr+ 1), assuming that radio resource is uniformly
assigned among BS and all RSs in each cell.
3.3.2. The Optical Repeater-Enhanced Cellular System. As the
MS combines all signals from the BS and all repeaters in the same cell, total received signal power can be represented as follows:
The level of intercell interference may vary with the envi-ronment, for example, outdoor, indoor, or heavily blocked basement. Let us introduce an average interference factor
l(pj,r), defined as a ratio of the power loss due to the additional
attenuation for a repeater r associated with the BS j(0 ≤
l(pj,r) ≤ 1). Then, the total interference for subcarrier kis
We assume the same interference factor for all repeaters to simplify this analysis, that is, l(pj,r) = lp, for all j,r.
The worst-case scenario corresponds to lp = 1, where no
additional attenuation is imposed by environmental factors. In the case where selective amplify-and-forwarding can be implemented for the repeaters, in a similar way as in the MultiHop relays, then only one of the repeaters will become the source of interference from each of the neighboring cells. Thus, we can assume thatlp = 1/(Nr+ 1) whereNr is the
number of repeaters deployed for each cell. In this case, it behaves as an ideal repeater.
3.4. Traffic Models. We consider two different types of traffic
models in the current analysis, one for a simple Internet traffic model observed from the empirical data of Ethernet traffic, the other for a full buffer. For the Internet model, the interarrival time between subsequent packets,T, follows the Pareto distribution. It best captures the self-similarity and burstness inherent in Internet traffic. The interarrival time is determined by two parameters, a shape parameterαand a location parameterβ; this leads to the following cumulative distribution function [9,10]:
FT(t)=
Note that the average packet interarrival time is given by
E[T]= αβ
α−1 = 1
λ, ifα >1, (8)
whereλ denotes the average packet arrival rate. In the full buffer model, assume that the base station has packets to
transmit for all mobile stations, waiting in their individual downlink buffer.
The Internet traffic model is useful for assessing the number of mobile stations that can be supported simulta-neously under varying traffic load, in terms of the average packet arrival rate. In contrast, the maximum possible system throughput can be evaluated with the full buffer model, only reflecting the multiuser diversity gain into throughput performance.
4. Simulation and Performance Analysis
An ideal hexagonal cell is assumed for each site, while con-sidering only two tiers of cells with respect to a reference cell in the center, that is, considering 19 cells in our simulation. Each site is sectioned by a directional antenna. Due to the finite number of cells, an accurate level of interference from all other cells cannot be captured in the model. We consider a so-calledwrap-aroundstructure to remove such a boundary effect. This enables capturing a more accurate level of intercell interference [6,11]. The MSs are uniformly distributed throughout each cell and move at a velocity of 3 km/h along a direction randomly selected in each frame. A path loss follows the WINNER model [12]. A log-normal shadow fading model with a standard deviation of 8 dB is considered for large-scale fading. Meanwhile, a multipath fading model follows the ITU-R M.1225 recommendation [13] for a pedestrian A (PED-A). An individual multipath is subject to independent Rayleigh fading, whose time-domain correlation is implemented by Jake’s model [14].
We assume that 100 mobile users are uniformly dis-tributed throughout each cell. We deploy 6 relays (or repeaters) in each cell located around a BS at a 2/3 position between the BS and the cell boundary. The transmit power of the BS and RS is limited to 20 W and 10 W, respectively. Meanwhile, we consider a full buffer traffic model, that is, each MS always has packets to transmit in the buffer. A sim-ple round-robin packet scheduling algorithm is employed.
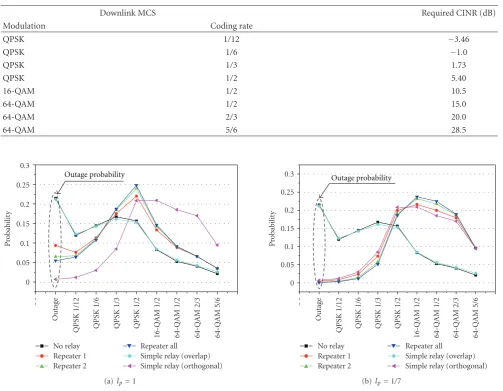
Table 1is the MCS table used in the simulation. It shows the CINR levels required for the given modulation and coding set (MCS) subject to the given channel model. Our analysis focuses on the nontransparent mode.
4.1. Performance of MultiHop Relay System. We first consider
the performance of the MultiHop relay-enhanced cellular OFDMA system for two different allocation scenarios: over-lapped and orthogonal allocations. In this particular analysis, we employ the Internet traffic model with an average packet arrival rate ofλ = 75 packets/sec, corresponding to a data rate ofR=441.72 kbps. Furthermore, a shaping parameter is fixed asα =1.3. In addition, the packet length is randomly generated by statistics obtained by an actual measurement in an Ethernet, as presented in Table 2. Each packet is fragmented into the appropriate sizes of a MAC PDU and padded with dummy bits, if necessary, to fit in the FEC block of the PHY layer.
A
Number of users per cell
0 20 40 60 80 100
w/o relay
w simple relay (BS-RS: 8)-overlap w simple relay (BS-RS: 10)-overlap w simple relay (BS-RS: 12)-overlap w simple relay (BS-RS: 14)-overlap w simple relay (BS-RS: 16)-overlap (a) Average throughput
Number of users per cell
0 20 40 60 80 100
w/o relay
w simple relay (BS-RS: 8)-overlap w simple relay (BS-RS: 10)-overlap w simple relay (BS-RS: 12)-overlap w simple relay (BS-RS: 14)-overlap w simple relay (BS-RS: 16)-overlap (b) Average outage rate Figure4: Average throughput and outage performance for a multihop relay with overlapped allocation.
A
Number of users per cell
0 20 40 60 80 100
w/o relay
w simple relay (BS-RS: 7)-orthogonal w simple relay (BS-RS: 8)-orthogonal w simple relay (BS-RS: 9)-orthogonal w simple relay (BS-RS: 10)-orthogonal w simple relay (BS-RS: 12)-orthogonal
(a) Average throughput
Number of users per cell
0 20 40 60 80 100
w/o relay
w simple relay (BS-RS: 7)-orthogonal w simple relay (BS-RS: 8)-orthogonal w simple relay (BS-RS: 9)-orthogonal w simple relay (BS-RS: 10)-orthogonal w simple relay (BS-RS: 12)-orthogonal
(b) Average outage rate Figure5: Average throughput and outage performance for a multihop relay with orthogonal allocation.
number of symbols assigned for the relay link, to search for the boundary that maximizes the average system throughput for the given number of MSs in each cell.
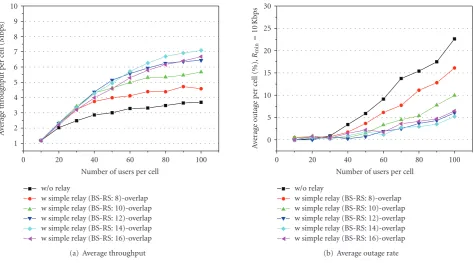
Figures4and5show the average throughput and outage performance as the number of users per cell increases, for the overlapped allocation and orthogonal allocation, respectively. As expected, we find average throughout varies
with the number of symbols allocated for the relay and access links. InFigure 5, for example, a boundary with 14 symbols for the relay link performs best for the overlapped allocation. Meanwhile, 8 symbols for a relay link roughly seem to be the best choice for the orthogonal allocation in
A
ver
age
thr
oug
h
put
p
er
ce
ll
(Mb
p
s)
0 2 4 6 8 10
No relay Repeater 1 Repeater 2
Repeater all Simple relay (overlap) Simple relay (orthogonal) (a)lp=1
A
ver
age
thr
oug
h
put
p
er
ce
ll
(Mb
p
s)
0 2 4 6 8 10
No relay Repeater 1 Repeater 2
Repeater all Simple relay (overlap) Simple relay (orthogonal) (b)lp=1/7
Figure6: Comparison of average system throughput.
(a) No relay (b) A relay with an overlapped allocation
(c) A relay with an orthogonal allocation (d) Repeater (lp=1)
Table1: MCS table for adaptive modulation and coding
Downlink MCS Required CINR (dB)
Modulation Coding rate
Figure8: Distribution of the MCS level and service outage rate.
Table2: Distribution of packet size for the ethernet traffic model.
Packet size (bytes) 64 128 256 512 1024 1518 Probability 0.6 0.06 0.04 0.02 0.25 0.03
overlapped allocation. It is also true for the relay system using the orthogonal allocation as shown inFigure 6, yet with its improvement limited roughly to 48%. The advantage of the overlapped allocation is mainly attributed to the frequency reuse gain achieved by relay stations throughout the cell.
Comparing the outage rates inFigure 4(b) to those in
Figure 5(b), the gain is obvious only at the cost of outage performance. Herein, service outage rate is defined as the probability that the average data rate meets the minimum prescribed rate, for example,Rmin=10 kbps. From Figures4 and5, the effective capacity can be determined by the maxi-mum possible throughput, While maintaining the allowable outage rate. For example, as long as the maximum allowable outage rate is limited to 1%, about 40 MSs can be supported
4.2. Performance Comparison: MultiHop Relays versus Optical
Repeaters. In this subsection, we attempt to compare the
per-formance of the relay system with that of the optical repeater-enhanced system. For the optical repeater-repeater-enhanced cellular system, multiple signals from the repeaters in the same cell are combined in the MS receiver. Limiting the number of signals from the repeaters to be combined in the receiver, we consider two different special cases in our simulation: one best signal-combining (denoted by “repeater-1”) and two best signal-combining (denoted by “repeater-2”). In general, all repeater signals can be combined (denoted by “repeater-all”).
Average system throughput is computed from the average of the data rates for all MSs in each cell, without allocating any radio resource to those MSs that cannot meet the required C/I to support the minimum MCS level (i.e., QPSK withR= 1/12).Figure 6shows average system throughput for different scenarios (one with the relay, the other with an optical repeater). For the optical repeater, we consider two extreme scenarios for the other cell interference, that is, the best one with lp = 1/7 and the worst one with lp = 1.
Note that “repeater-1” and “repeater-2” denote the cases with two one best and two best repeater signals combined in the mobile, While “repeater all” denotes the case that all repeater signals, that is, six repeater signals in the current simulation, are combined to fully exploit the diversity gain.
In all cases, the improvement of the average throughput performance is obvious with the MR or the repeater. However, capacity improvement with the relay-enhanced system is more impressive than with an optical repeater. For example, the system capacity can be more than doubled with the overlapped allocation in the MR system. For the worst interference scenario of lp = 1 in Figure 6(a),
however, the performance gain with optical repeaters is marginal. The performance gain of the relay system over the repeater is mainly attributed to its frequency reuse capability. We also note that the relay system even with the orthogonal allocation outperforms the optical repeaters by approximately 2.5 Mbps. This implies that the interference from all repeaters in other cells is seriously harmful to throughput performance in the optical repeater-enhanced system. This particular conclusion becomes more obvious from the results inFigure 6(b). Here, the average interference factor is reduced to an ideal situation (lp=1/7), that is, only
one of the six repeaters, or the BS to serve an MS only within its coverage, is activated in a neighboring cell.
For an average interference factor of 1/7, the optical repeater-enhanced system shows a comparable improvement due to its ideal behavior, even outperforming the relay system with its orthogonal allocation. We can conclude from the results inFigure 6(b)that throughput improvement with a C/I gain from combining the same signals from multiple repeaters is almost comparable to that with a frequency reuse gain in the relay system of the overlapped allocation. As performance gain is accompanied by degradation in the service outage performance, especially around the edge of the coverage area, however, the throughput and outage performance must be investigated simultaneously.
Figure 7 shows the cellular outage performance for various relay and resource allocation scenarios, in which black dots denote the MSs subject to an outage. Here, we define the outage rate by the probability that C/I does not meet the required C/I (−3.46 dB fromTable 1) to support the minimum MCS level (i.e., QPSK with R = 1/12). In
Figure 7(a), every cell edge is seriously subject to an outage due to other cell interference. In Figure 7(b), a similar cell edge effect is observed, yet now around the subcell edge of every RS, due to co-channel interference among the RSs as a frequency is fully reused by them. However, outage performance can be significantly improved with orthogonal allocation in a MultiHop relay-enhanced system, as shown in
Figure 7(c). We also find fromFigure 7(d)that repeaters are useful for warranting the outage performance with a multiple order of combining gain, especially in the destructive area, for example, the edge of the subcell coverage.
Figure 8shows a distribution of MCS levels and service outage rates for the different average interference factors. We find that a comparable performance is observed for a no-relay system and a no-relay system of overlapped allocation. As expected, the MCS are spread out over higher levels, While incurring almost no outage events for orthogonal allocation. In Figure 8(a), we can see that optical repeaters provide a much better outage performance than the relay system of overlapped allocation, even if its system throughput is lower. We also observe that the outage performance along with the MCS distribution for the relay system of overlapped allocation is almost the same as for a system without employing any type of relay. This implies that the additional outage events are incurred around the subcell edges formed by the RSs even if higher system throughput can be achieved by a frequency reuse gain in the relay system. In summary, the optical repeater performance outage falls between that of a no-relay system and a relay system with orthogonal allocation.
When the average interference factor is reduced to a minimum, that is, lp = 1/7, as for Figure 8(b), repeaters
and orthogonal allocation have similar MCS distribution and outage performance, since they share the same characteristics in that the frequency is not reused. As far as the outage rate is concerned, the optical repeater-enhanced system performs best. This is mainly attributed to the combining gain of repeaters, while assuming that the other cell interference is limited tolp =1/7. A similar aspect of the repeaters is also
observed in a distribution of MCS levels, that is, higher MCS levels distributed in the optical repeater-enhanced system.
5. Conclusion
Furthermore, outage performance can be improved by repeaters or MultiHop relays with orthogonal allocation, since they improve C/I either by combining gain or by reducing the co-channel interference in the same cell, respectively. MultiHop relays will increase system capacity (almost doubling system throughput with the overlapped allocation), especially improving a per-user data rate in the cell edges or heavily shadowed areas. As these relays eliminate the need for a wire line relay, they facilitate rapid deployment and warrant economic feasibility. However, in the MultiHop relay system of overlapped allocation, there must be some means of circumventing the additional outage events around the subcell edges of the relay stations incurred by fully reusing the frequency in every relay station. One particular approach is acooperative relayscheme that allows transmitting duplicate signals via multiple relay stations and then, combining them constructively in the receiver [15].
Conventional repeaters incur serious C/I degradation in the open space for all the MSs throughout the cell coverage. This is due to other cell interference caused by all repeaters in the neighboring cells, even though they may be useful for warranting the outage performance with a multiple order of combining gain, especially in the destructive area, for example, basement or indoor with heavy wall attenuation that naturally shields the interference. However, intelligence of selective amplify-and-forwarding must be incorporated into the repeater with a reasonable complexity to ensure the usability of repeaters in the cellular OFDMA system with the adaptive modulation and coding scheme. This implies that flexibility and low-cost deployment with the MultiHop relay stations are additional advantages over the optical repeaters for the emerging mobile broadband wireless network. This is especially true when adopting the OFDMA as a new multiple access option for the 3GPP Long-term Evolution (LTE), 3GPP Ultra Mobile Broadband (UMB), and Mobile WiMAX, which is less robust to the co-channel interference compared to the (code division multiple access) CDMA. It is perceived that the MultiHop relay capability is one of the most realistic means of achieving the target bandwidth efficiency requirement, currently discussed for
IMT-Advancedin ITU-R WP5D standardization activities.
Acknowledgment
This work was partly supported by the IT R&D program of MIC/IITA [2006-S058-01, Development of Network/Service Control Technology in All-IP based Converged Network] and partly by the University Research Center Project, Korea.
References
[1] IEEE P802.16e/D7, “Air Interface for Fixed and Mobile Broadband Wireless Access Systems,” February 2005. [2] IEEE P802.16j/D3, “Draft Amendment to IEEE Standard for
Local and Metropolitan Area Networks—Part 16: Air Interface for Fixed and Mobile Broadband Wireless Access Systems— Multihop Relay Specification,” February 2008.
[3] R1-090740, Mitsubishi Electric, “Impact of repeaters and decode-and-forward relays on system performance,” 3GPP TSG RAN WG1 #56, Athens, Greece, February 2009.
[4] J. Cho and Z. J. Haas, “On the throughput enhancement of the downstream channel in cellular radio networks through multihop relaying,”IEEE Journal on Selected Areas in Commu-nications, vol. 22, no. 7, pp. 1206–1219, 2004.
[5] M. H. Ahmed, I. Syed, and H. Yanikomeroglu, “On the performance of time division multiple access-based multihop fixed cellular networks with respect to available frequency carriers,”IET Communications, vol. 2, no. 9, pp. 1196–1204, 2008.
[6] J. M. Ku, P. K. Kim, S. J. Lee, S. Shin, and C. G. Kang, “On the performance of broadband mobile internet access system,”
Wireless Personal Communications, vol. 47, no. 2, pp. 265–279, 2008.
[7] IEEE C802.16j-07/013r3, “Multi-hop System Evaluation Methodology (Channel Model and Performance Metric),” February 2007.
[8] IEEE C802.16j-06/233r8, “Frame Structure to Support Relay Node Operation,” November 2006.
[9] R. Gusella, “A measurement study of diskless workstation traffic on an Ethernet,”IEEE Transactions on Communications, vol. 38, no. 9, pp. 1557–1568, 1990.
[10] W.-M. Yin and Y.-D. Lin, “Statistically optimized minislot allocation for initial and collision resolution in hybrid fiber coaxial networks,”IEEE Journal on Selected Areas in Commu-nications, vol. 18, no. 9, pp. 1764–1773, 2000.
[11] Y.-B. Lin and V. W. Mak, “Eliminating the boundary effect of a large-scale personal communication service network simulation,” ACM Transactions on Modeling and Computer Simulation, vol. 4, no. 2, pp. 165–190, 1994.
[12] IST-2003-507581 WINNER D5.4v.1.0, “Final Report on Link Level and System Level Channel Models”.
[13] ITU-R Recommendation M.1225, “Guidelines for evaluation of radio transmission technologies for IMT-2000,” 1997. [14] W. C. Jakes,Microwave Mobile Communications, John Wiley &
Sons, New York, NY, USA, 1994.