Role of TGF
βββββ
and myofibroblasts in supporting the
propagation of human embryonic stem cells in vitro
NEERAJ KUMAR, PRASAD PETHE and DEEPA BHARTIYA*
Stem Cell Biology Department, National Institute for Research in Reproductive Health, Parel, Mumbai, India
ABSTRACT The feeder layer constitutes a prerequisite for the undifferentiated proliferation of human embryonic stem (hES) cells in vitro. However, a few feeders have been reported to be non-supportive in nature, suggesting that these feeders exhibit a different transcriptome and proteome, in comparison to their supportive counterparts. In an attempt to identify factors required for undifferentiated growth and many downstream applications of hES cells, transcriptomes of supportive (mouse fibroblasts derived from 13.5dpc embryos and human fetal fibroblasts) and non-supportive (mouse fibroblasts derived from 18.5dpc embryos) feeders were analyzed. Fur-thermore, the parallel correlation of data generated in the microarray study with the published proteome data of supportive feeder fibroblasts, helped us to focus on the proteins which seem to be likely candidates in supporting the undifferentiated expansion of ES cells in vitro. Our results indicated that TGFβββββ and its associated signaling molecules facilitate the undifferentiated prolif-eration of hES cells in vitro. The transient differentiation of feeder fibroblasts into myofibroblasts may be the decisive factor for a feeder layer to be supportive or non-supportive in nature. We propose that the microenvironment of feeder myofibroblasts dictates TGFβββββ to support prolifera-tion and apparently plays the contradictory role of facilitating differentiaprolifera-tion when feeder support is withdrawn, possibly by acting through different signaling mechanisms.
KEY WORDS:
embryonic stem cell, feeder layer, microarray, TGF
β
, myofibroblast
In order to realize full clinical potential of human embryonic stem (hES) cells, a major challenge lies in its large scale production for transplantation which is restricted by the use of feeder layer. Mouse embryonic fibroblasts (MEF), although considered the ideal feeder for supporting hES cell growth, carry a potential risk of transferring animal pathogens to the hES cells and thus making them unsuitable for clinical use. Moreover, release of nonhuman sialic acid Neu5Gc from MEF make hES cells more immunogenic and thus possible rejection at the time of transplantation (Martin et al. 2005). Human feeders from various sources have also been used for hES cells derivation and culture e.g. fibroblasts obtained from fetal muscle, skin, lung of which fetal lung fibroblasts were reported to be non- supportive (Richards et al. 2003). Thus it becomes pertinent to identify the proteins/ factors that are highly expressed/ produced by feeder fibroblasts that facilitate undiffer-entiated proliferation, expansion and maintenance of pluripo-tency of embryonic stem cells in vitro, with the hope to further refine feeder free culture protocols in future.
Studies are available in literature which aimed to identify the secretory factors in the conditioned medium using tools like 2-DE
BIOLOGY
www.intjdevbiol.com*Address correspondence to: Deepa Bhartiya. Stem Cell Biology Department, National Institute for Research in Reproductive Health, Parel, Mumbai 400 012, India. Fax:. +91-222-412-3492. e-mail: deepa.bhartiya@yahoo.in
Accepted: 22 September 2009. Final author corrected PDF published online: 20 July 2010.
ISSN: Online 1696-3547, Print 0214-6282
© 2010 UBC Press Printed in Spain
Abbreviations used in this paper, α-SMA, alpha smooth muscle actin; BMP, bone morphogenic protein;dpc, days post coitum; ECM, extra cellular matrix; FGF 2, fibroblast growth factor-2; hES, human embryonic stem; HFF, human fetal fibroblasts; MEF, mouse embryonic fibroblasts; SPARC, secretory protein acidic and rich in cysteine; TGFβ, Tumor growth factor beta; GAPDH, Glyceraldehyde 3 –phosphate dehydrogenase; EDTA, Ethylene diamintetra acetic acid; PVDF, Polyvinylidene fluoride; NFDM, Non fat dried milk; TBST, Tris-buffered saline.
cause lysis of certain membrane bound proteins. However, it is well accepted that proteins belonging to the category of extracel-lular matrix proteins, cell cytoskeleton and growth factors are most likely involved in the maintenance of hES cells growth since they are associated with variety of events including cell adhesion, cell proliferation, differentiation etc. (Lim et al. 2002; Prowse et al. 2005, 2007; Kueh et al. 2006; Eiselleova et al. 2008).
An earlier report from our laboratory has shown that feeder layers derived from 13.5dpc CF-1 mouse embryo and human fetal fibroblasts (HFF) are supportive for hES cells culture (Kumar et al. 2009) whereas the feeder layers derived from 18.5dpc mouse embryo exhibit massive differentiation in hES colonies beyond 1-2 passages. Thus in an effort to identify potential candidates having role in self renewal of hES cells, we studied the transcriptome of supportive and non-supportive feeder fibro-blasts by microarray analysis and correlated with earlier reported proteomics data of factors detected in the conditioned medium of supportive feeders.
Results
Feeder layers
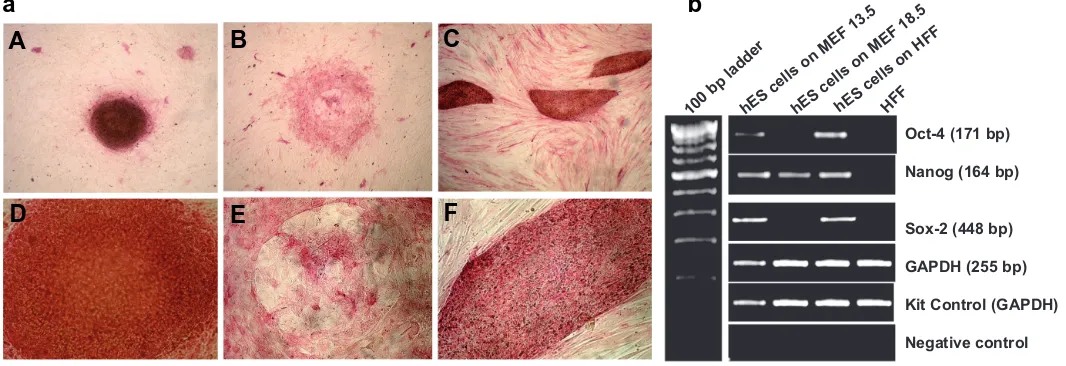
The hES cell colonies appear round in shape on 13.5dpc MEF feeder whereas on the human feeder layers they assume banana-like appearance (Fig 1 A,C,D,F). They could be easily passaged in an undifferentiated state on both MEF and HFF. When hES cells were cultured on 18.5dpc MEF, colonies underwent massive differentiation within 1- 2 passages (Fig1 B,E).
Microarray analysis
A total of 739 genes were found to be differentially expressed between 13.5dpc and 18.5dpc MEF of which 416 were up-regulated in 13.5dpc MEF and 323 genes in 18.5dpc MEF.
(log 2) was considered biologically significant for functional analy-sis. Such up-regulated 147 genes and 43 genes in 13.5dpc MEF and 18.5dpc MEF respectively were annotated at high stringency setting (P<0.01) provided in the Biointerpreter tool. The genes were clustered into pathway analysis, functional categories, cel-lular and chromosomal localization etc. Interestingly none of the cellular pathways were found to be significantly activated in 18.5dpc MEF group nor were we able to classify these genes based on their cellular localization. Whereas in the 13.5dpc MEF, several pathways were significantly up-regulated and also the genes could be classified based on their cellular localization (Table 1). Further stringent filtering (p<0.05) of the categories based on cellular localization yielded the following list of pathways that were activated (Table 2). These genes were involved in various functions including cell adhesion, differentiation, prolif-eration, ECM remodeling, growth factor and regulation etc. Table 3 gives the details of the genes that belong to extra- cellular, secretory or cell surface associated categories.
The human transcriptome was studied based on the hybridiza-tion intensity. A total of 8111 genes showed hybridizahybridiza-tion intensity greater than 100 of which 2317 genes were highly expressed and showed intensity greater than 1000.
Comparative studies of microarray data with published proteomics data
Comparisons were based on fold changes in the correspond-ing eighty- five genes between 13.5dpc MEF and 18.5dpc MEF. Array hybridization intensities of HFF have been listed in Table 4. Upon comparisons, four expression patterns were observed: (i) certain genes were upregulated in both 13.5dpc MEF and HFF; (ii) certain genes were down regulated in both; (iii) upregulated in 13.5dpc MEF but not in HFF and (iv) some which were not upregulated in 13.5dpc MEF but were highly expressed in HFF.
Fig. 1. Pluripotency assessment of hES cells grown on different feeder layers by alkaline phosphatase staining and RT-PCR. (a) Alkaline phosphatase (AP) activity in hES cells growing on 13.5dpc MEF (A,D), 18.5dpc MEF (B,E) and on human feeders (C,F). Note the marked absence of AP staining in the hES cells growing on 18.5dpc MEF (B,E). The central part of the hES colony is differentiated and lacks AP positive cells. hES colonies growing on 13.5dpc MEF and HFF reveal positive staining for AP indicating absence of any sign of differentiation. Interestingly the human fetal fibroblasts (HFF) also reveal moderate AP activity (original magnification: A- C x40; D-F x100). (b) RT-PCR analysis of pluripotent marker expression in hES cells grown on various feeders and HFFs. Note the reduced expression of Oct-4, Nanog and Sox-2 in hES cell colonies grown on MEF 18.5 indicative of differentiation.
a
B
C
D
E
F
A
Oct-4 (171 bp)
Nanog (164 bp)
Sox-2 (448 bp)
GAPDH (255 bp)
Kit Control (GAPDH)
Negative control hES c
ells on MEF 13. 5
hES c
ells on MEF 18. 5
hES c
ells on HFF
HFF 100
bp ladder
We worked on the premise that genes having a role in supporting hES cells proliferation in vitro should be upregulated in the supportive feeders. The proteins which were upregulated in both 13.5dpc MEF and HFF emerge as important candidates for further analysis and are indicated in bold (Table 4).
Scanning electron microscopy
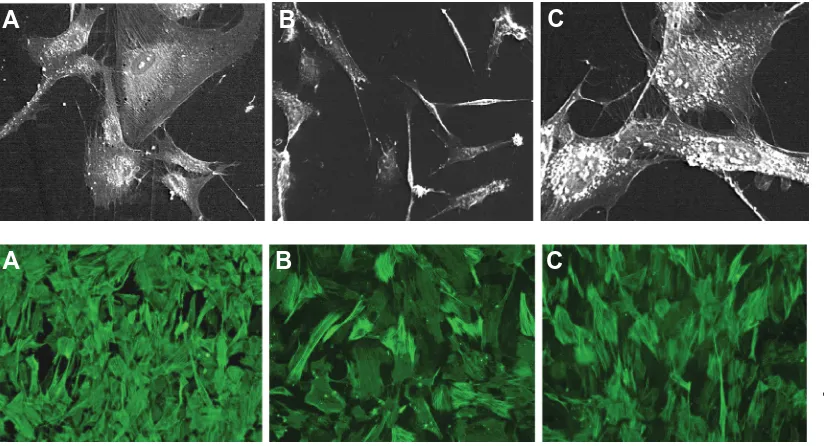
Fibroblasts from 13.5dpc MEF and HFF appeared bigger in size, polyhedral and had several fibrils on their periphery which may be analogous to stress fibers described earlier (Tomasek et al., 2002). The 18.5dpc MEF appeared more spindle shaped, quiescent and few polyhedral cells were observed but found to be devoid of peripheral fibrils (Fig 2).
Immunocytochemical localization of ααααα-SMA
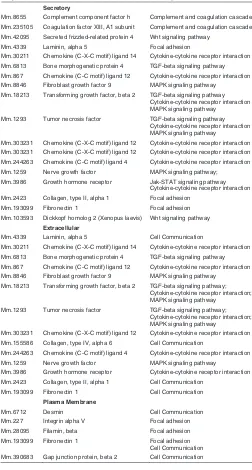
α-SMA, a marker for myofibroblasts, was predominantly local-ized in large amounts in 13.5dpc MEF and HFF, as compared to the 18.5dpc MEF (Fig 3). As evident, the cells positive for α-SMA were polyhedral in shape and had bundles of fibrils staining positive.
Fig. 2. Scanning electron mi-crographs of the feeder fibro-blasts. (A) 13.5dpc MEF, (B)
18.5dpc MEF and (C) HFF (origi-nal magnification x 500). Note the polygonal shaped myofibroblasts and the fibrils around the cell surface.
B
C
A
Fig. 3. Immunolocalization of
α αα
αα-SMA in (A) 13.5dpc MEF, (B)
18.5dpc MEF and (C) HFF (origi-nal magnification x100).
Fig. 4. Comparison of ααααα SMA protein levels among different feeder fibroblasts. (A) Western blot analysis of α-SMA expression in feeder fibroblasts: (1) 13.5dpc MEF, (2) 18.5dpc MEF and (3) HFF. (B) Quantitative analysis of α-SMA expression in feeder fibroblasts. Ratio= IOD alpha SMA/ IOD GAPDH; IOD, Integrated Optical Density.
55 kDa
40 kDa
40 kDa
30 kDa
GAPDHAlpha SMA
(Size) 1 2 3 Alpha Smooth Muscle Actin expression
0.98
0.62
0.43
0 0.4 0.8 1.2
M13.5 M18.5 HFF
R
a
ti
o
(SM
A
to
G
A
PD
H
)
B
A
B
C
A
Western blot analysis of ααααα-SMA expression
Western blot and densitometry analysis showed the significant decrease in expression of α-SMA in non-supportive 18.5dpc MEF (Fig 4 A,B) as compared to 13.5dpc MEF. Human fibroblasts α -SMA expression, however, could not be normalized against GAPDH due to species variation as GAPDH is over expressed in HFF. However, the integrated optical density (IOD) of α-SMA for HFF was found to be the 1.30 and 1.04 fold higher than 18.5dpc MEF and 13.5dpc MEF respectively.
Discussion
peptide itself was attributed to the instrument limitation, protein abundance and size (Prowse et al. 2007). Results of the present study have led to the short listing of 37 out of reported 85 proteins (detected in high amounts in conditioned medium by proteomics approach) that may be involved in self- renewal of hES cells (Table 4). Interestingly, absence of activation of any well- defined cellular pathway involved in cell proliferation etc amongst the 43 genes that were 1.5 (log 2) fold higher (p< 0.01) in the 18.5dpc MEF (data not shown) perhaps explains why these feeder layers are non- supportive in nature and researchers prefer to use 13.5dpc embryos to derive feeder layers for hES cells cultures.
At the transcriptome level, an unambiguous up- regulation of TGFβ and associated molecules in 13.5dpc versus 18.5dpc MEF was evident, in agreement with published literature where TGFβ family has been implicated in hES cells proliferation (Diecke et al. 2008; Greber et al. 2007; Roberts et al., 2005). The intracellular machinery of the supporting feeder layers appears to be geared up to stimulate the production of TGFβ and associated molecules (Table 4). Latent transforming growth factor binding protein (LTBP 1) was found to be differentially upregulated in supportive feed-ers. It is an extracellular matrix glycoprotein and plays a critical role in controlling and directing the activity of TGFβ by binding to latent TGFβ and thus regulating its availability and activity (Prowse et al. 2007). The three components of extra cellular matrix identified viz fibronectin, SPARC and thrombosondin have all been implicated in stimulating the production of TGFβ directly or through LTBP 1. Fibronectin is an extracellular matrix protein which has been implicated in the TGFβ signaling via assembly of LTBP1. SPARC is a glycoprotein that is also understood to modulate the action of growth factors including TGFβ. Thrombospondin is also known to activate TGFβ.
Regulation of hES cells self- renewal is a complex mechanism. Three key pathways implicated in hES cells differentiation, pluri-potency and growth are Wnt, Inhibin and BMP/ TGFβ (Prowse et al. 2007). However, Wnt/ beta catenin activation does not appear to be important to maintain undifferentiated and pluripotent state
Functional Pathway No. of genes P value
Extra-cellular
Cell Communication 4 1E-09
Cytokine-cytokine receptor interaction pathway 7 1E-09
MAPK signaling pathway 4 0.0044
Hematopoietic cell lineage 4 0.0082
Small cell lung cancer 4 0.0128
Complement and coagulation cascades 3 0.0486
TGF-beta signaling pathway 3 0.0486
Secretory
Cytokine- cytokine- receptor interaction pathway 7 IE- 09
MAPK pathway 4 IE- 09
TGF beta signaling pathway 3 0.0001
Plasma Membrane
Hematopoietic cell lineage 4 1E-09
Neuroactive ligand-receptor interaction 2 0.0014
Focal adhesion 3 0.0028
Propanoate metabolism 1 0.0128
Cell Communication 3 0.0374
B cell receptor signaling pathway 2 0.0474
SIGNIFICANT PATHWAYS IDENTIFIED FROM GENES LISTED IN CELLULAR LOCALIZATION CLUSTER (TABLE 1)
Clusters No. of genes P value
Pathway
Glycan structures biosynthesis 1 4 1E-09
Cell Communication 6 0.0001
Apoptosis 2 0.0001
Cytokine-cytokine receptor interaction 8 0.0002
Chromosome
14 13 0.0018
1 16 0.0033
Biological Functions
Activation 77 1E-09
Ageing 14 1E-09
Angiogenesis 35 1E-09
Antigen Processing and Presentation 39 1E-09
Apoptosis 50 1E-09
Cell Adhesion 54 1E-09
Cell Differentiation 48 1E-09
Cell Division 32 1E-09
Cell Migration 26 1E-09
Cell Morphogenesis 31 1E-09
Cell Proliferation 53 1E-09
Chemotaxis 18 1E-09
Drug Response 19 1E-09
Endocytosis 14 1E-09
Extracellular Matrix Remodeling 35 1E-09
Gene Regulation 37 1E-09
Growth Factors And Regulators 68 1E-09
Immune Response 82 1E-09
Infection 29 1E-09
Inflammation 68 1E-09
Negative Gene Regulation 27 1E-09
Biosynthesis 23 0.0001
Degeneration 13 0.0002
Hemostasis 5 0.0007
Complement Activation 4 0.001
Anti-Apoptosis 6 0.0015
Metabolism 41 0.0025
Cell Cycle 24 0.0045
Homeostasis 15 0.0051
Cellular Localization
Extracellular 62 1E-09
Secreted 33 1E-09
Plasma Membrane 32 0.0038
CLUSTERING OF GENES UPREGULATED IN 13.5DPC
VS. 18.5DPC MOUSE EMBRYONIC FIBROBLASTS
may also facilitate feeder- free expansion of hES cells in future. The analysis was based on the hypothesis that any protein/ growth factor upregulated (>1.5 fold, log2) in supportive 13.5dpc MEF and HFF versus non-supportive 18.5dpc MEF feeders may play a crucial role in self- renewal of hES cells. It is also possible that MEF and HFF may act through different mechanisms but this possibility seems to be less likely.
of hES cells (Dravid et al. 2005). Various researchers identified different molecules e.g. FGF 2 signaling, ECM proteins (Kueh et al. 2006), Noggin and FGF 2 (Xu et al. 2005) to be the key factors in promoting self- renewal of hES cells in vitro. Recently, FGF- 2 was demonstrated to act on MEF to release supportive factors including key members of the TGFβ pathway viz. inhibin alpha, TGFβ1, GREM-1, and BMP-4 and reduce differentiation-inducing activity (Greber et al. 2007). Interestingly, our results demonstrate an up regulation of key members of the TGFβ pathway even in the absence of FGF 2 in the supportive feeder transcriptome.
TGFβ has been implicated by several groups, in regulating the biology of embryonic stem cells and may help define the selection of cell fate and the progression of differentiation along a lineage (Mishra et al. 2005). We propose that when the hES cells are in close contact with the feeder layers, TGFβ facilitates proliferation and it is the microenvironment of ES cells that triggers TGFβ to exert contradictory roles of either facilitating proliferation of ES cells in presence of feeders or inducing differentiation when feeder support is withdrawn. Thus TGFβ acts through different pathways depending on the presence or absence of feeder support and appears to play dual role in both supporting differen-tiation and proliferation of hES cells. This hypothesis is further supported by an elegant study carried out by James and co-workers (2005) where they reported that in the undifferentiated hES cells, TGFβ /activin/nodal pathway is activated through the signal transducer SMAD2/3 and upon early differentiation SMAD1/ 5 signaling gets activated.
Embryonic stem cells share several characteristics of cancer cells including loss of contact inhibition and immortality (Gammill and Bronner, 2002). It is interesting to draw an analogy between cancer cells and surrounding stromal fibroblasts with embryonic stem cells and surrounding feeder fibroblasts. The complex and apparently contradictory role of TGFβ in cancer biology has been extensively studied where it shifts its role from an inhibitor to a promoter of proliferation during tumor progression (Ao et al. 2007; Elliott et al. 2005). TGFβ is understood to play a role in the communication between the cancer cells and the surrounding stromal cells. It regulates the interaction between cell and extra-cellular matrix through induction of extraextra-cellular matrix proteins such as fibronectin, collagen, and laminin etc. Several such ECM components were observed to be highly expressed in the support-ive feeders (Table 2). The tissue stroma is understood to play an important role during cancer cell proliferation and invasion. The production of growth factors, chemokines and extracellular matrix by the surrounding stromal cells facilitate the malignant progres-sion of cancer and represent an important target for cancer therapies (Wever et al. 2003; Kalluri et al. 2006, Billottet et al. 2008). It is widely accepted that the development of carcinoma is not only due to somatic mutations in epithelial cells but also is influenced by the tumor microenvironment including the stromal fibroblasts (Stover et al. 2007). Similarly for self- renewal of hES cells, feeder fibroblast layers are essential and when the feeder fibroblast support is withdrawn, results in differentiation of hES cells.
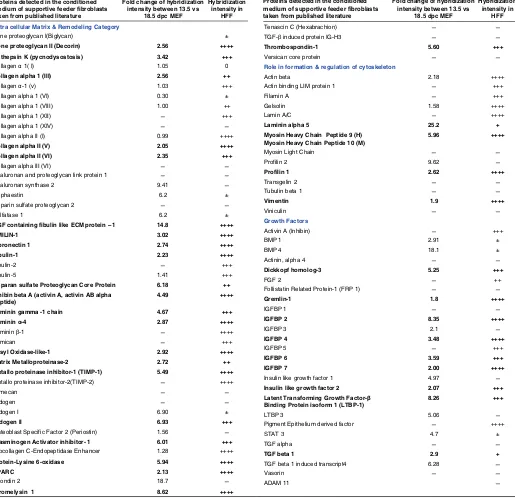
Stromal changes at the invasion front in a tumor (Vaughan et al., 2000; Rice et al., 2003) or during wound healing (Tomasek et al. 2002) include the appearance of myofibroblast cells, which are unique cells, an intermediate state between fibroblasts and smooth muscle cells (Gabbiani et al. 1971) that arise from transient differentiation of resident fibroblasts through multiple paracrine – mediated pathways including TGFβ (Shi-wen et al., 2009). They are known to undergo mesenchymal-epithelial interactions and through the secretion of cytokines, chemokines, growth factors and extracellular matrix proteins, they facilitate cell growth and proliferation. To study similar phenomenon occurring in feeder layers, we examined the expression of myofibroblasts specific markers between the transcriptome of supportive and non- sup-portive feeders. Myosin heavy chain protein, vimentin and desmin were found to be 8, 2 and 21 fold up- regulated respectively.
Unigene ID Gene Name Pathway Name
Secretory
Mm.8655 Complement component factor h Complement and coagulation cascades
Mm.235105 Coagulation factor XIII, A1 subunit Complement and coagulation cascades
Mm.42095 Secreted frizzled-related protein 4 Wnt signaling pathway
Mm.4339 Laminin, alpha 5 Focal adhesion
Mm.30211 Chemokine (C-X-C motif) ligand 14 Cytokine-cytokine receptor interaction
Mm.6813 Bone morphogenetic protein 4 TGF-beta signaling pathway
Mm.867 Chemokine (C-C motif) ligand 12 Cytokine-cytokine receptor interaction
Mm.8846 Fibroblast growth factor 9 MAPK signaling pathway
Mm.18213 Transforming growth factor, beta 2 TGF-beta signaling pathway Cytokine-cytokine receptor interaction MAPK signaling pathway
Mm.1293 Tumor necrosis factor TGF-beta signaling pathway Cytokine-cytokine receptor interaction MAPK signaling pathway
Mm.303231 Chemokine (C-X-C motif) ligand 12 Cytokine-cytokine receptor interaction
Mm.303231 Chemokine (C-X-C motif) ligand 12 Cytokine-cytokine receptor interaction
Mm.244263 Chemokine (C-C motif) ligand 4 Cytokine-cytokine receptor interaction
Mm.1259 Nerve growth factor MAPK signaling pathway;
Mm.3986 Growth hormone receptor Jak-STAT signaling pathway Cytokine-cytokine receptor interaction
Mm.2423 Collagen, type II, alpha 1 Focal adhesion
Mm.193099 Fibronectin 1 Focal adhesion
Mm.103593 Dickkopf homolog 2 (Xenopus laevis) Wnt signaling pathway
Extracellular
Mm.4339 Laminin, alpha 5 Cell Communication
Mm.30211 Chemokine (C-X-C motif) ligand 14 Cytokine-cytokine receptor interaction
Mm.6813 Bone morphogenetic protein 4 TGF-beta signaling pathway
Mm.867 Chemokine (C-C motif) ligand 12 Cytokine-cytokine receptor interaction
Mm.8846 Fibroblast growth factor 9 MAPK signaling pathway
Mm.18213 Transforming growth factor, beta 2 TGF-beta signaling pathway; Cytokine-cytokine receptor interaction; MAPK signaling pathway
Mm.1293 Tumor necrosis factor TGF-beta signaling pathway; Cytokine-cytokine receptor interaction; MAPK signaling pathway
Mm.303231 Chemokine (C-X-C motif) ligand 12 Cytokine-cytokine receptor interaction
Mm.155586 Collagen, type IV, alpha 6 Cell Communication
Mm.244263 Chemokine (C-C motif) ligand 4 Cytokine-cytokine receptor interaction
Mm.1259 Nerve growth factor MAPK signaling pathway
Mm.3986 Growth hormone receptor Cytokine-cytokine receptor interaction
Mm.2423 Collagen, type II, alpha 1 Cell Communication
Mm.193099 Fibronectin 1 Cell Communication
Plasma Membrane
Mm.6712 Desmin Cell Communication
Mm.227 Integrin alpha V Focal adhesion
Mm.28095 Filamin, beta Focal adhesion
Mm.193099 Fibronectin 1 Focal adhesion Cell Communication
Mm.390683 Gap junction protein, beta 2 Cell Communication
TABLE 3
Tenascin C (Hexabrachion)
TGF-β induced protein IG-H3
Thrombospondin-1 5.60 +++
Versican core protein
Role in formation & regulation of cytoskeleton
Actin beta 2.18 ++++ Myosin Heavy Chain Peptide 9 (H)
Myosin Heavy Chain Peptide 10 (M)
5.96 ++++ Follistatin Related Protein-1 (FRP 1)
Gremlin-1 1.8 ++++
Insulin like growth factor 1 4.97 Insulin like growth factor 2 2.07 +++ Latent Transforming Growth Factor-β
Binding Protein isoform 1 (LTBP-1)
8.26 +++
LTBP 3 5.06
Pigment Epithelium derived factor ++++ STAT 3 4.7 ± SMA indicates that supportive feeder fibroblasts transiently differ-entiate into myofibroblasts and this decides whether a feeder layer is supportive or not for ES cells proliferation since the 18.5dpc MEF comprised predominantly of quiescent fibroblasts. Few polyhedral fibroblasts were also observed in 18.5dpc MEF
Proteins detected in the conditioned medium of supportive feeder fibroblasts taken from published literature
Fold change of hybridization intensity between 13.5 vs
18.5 dpc MEF
Hybridization intensity in
HFF
Extra cellular Matrix & Remodeling Category
Bone proteoglycan I(Biglycan) ±
Bone proteoglycan II (Decorin) 2.56 ++++ Cathepsin K (pycnodysostosis) 3.42 +++
Collagen α 1( I) 1.05 0
Hyaluronan and proteoglycan link protein 1
Hyaluronan synthase 2 9.41
Hephaestin 6.2 ± Heparin sulfate proteoglycan 2
Sulfatase 1 6.2 ±
Heparan sulfate Proteoglycan Core Protein 6.18 ++ Inhibin beta A (activin A, activin AB alpha
peptide) Matrix Metalloproteinase-2 2.72 ++ Metallo proteinase inhibitor-1 (TIMP-1) 5.49 ++++
Metallo proteinase inhibitor-2(TIMP-2) ++++ Mimecan
Nidogen
Nidogen I 6.90 ±
Nidogen II 6.93 +++
Osteoblast Specific Factor 2 (Periostin) 1.56 Plasminogen Activator inhibitor- 1 6.01 +++
Procollagen C-Endopeptidase Enhancer 1.28 ++++
Protein-Lysine 6-oxidase 5.94 ++++
SPARC 2.13 ++++
Spondin 2 18.7 Stromelysin 1 8.62 ++++
TABLE 4
COMPARISON OF PUBLISHED PROTEOME DATA WITH TRANSCRIPTOME DATA OF SUPPORTIVE
& NON-SUPPORTIVE FEEDER FIBROBLASTS
Proteins detected in the conditioned medium of supportive feeder fibroblasts taken from published literature
Fold change of hybridization intensity between 13.5 vs
18.5 dpc MEF
Hybridization intensity in
HFF TABLE 4 (CONTINUED)
Hybridization intensity in human array >100 has been designated; between 100- 200 as +; between 200- 500 as +; between 500- 1000 as ++; between 1000- 5000 as +++ and > 5000 as ++++). Upregulated proteins in supportive feeders are marked in bold in the text.
reported to induce autocrine or paracrine signaling through TGFβ super- family ligands that supports hES cells self- renewal (Saha et al. 2008). Further studies are ongoing in this direction to explore the phenomenon still better.
Materials and Methods
Cell culture
Human fetal fibroblast (HFF) culture
Human fetal fibroblast culture, with prior permission from Institute Ethics Committee, was established as described earlier (Kumar et al.,
2009).
Mouse embryonic fibroblast (MEF) culture
13.5 and 18.5dpc CF-1 mouse embryos were washed three times with phosphate buffer saline (PBS) containing 1% v/v penicillin-streptomycin. Using sterile scissors limbs, head, tail and dark red organs were removed. Remaining body parts were finely minced in 0.5% Trypsin EDTA (Sigma, St Louis, MO) and incubated at 370C for 20 min. Tissues were then mixed
with equal volume of fetal bovine serum (HyClone, South Logan, UT) to stop the activity of Trypsin EDTA. Cells were released by triturating gently and centrifuged at 1000 rpm for 5min. Pellets were then resuspended in to media containing DMEM high glucose (Gibco/ Invitrogen, Carlsbad, CA), 10% FBS, 1%v/v L-Glutamine (Gibco), 1% v/v non essential amino acids (Sigma) and 1% v/v Pen/strep (Sigma) and incubated in T-75 flasks (Nunc, Rochestor, NY) at 370C & 5% CO
2. Cells were monitored for their
growth and sub-cultured regularly. For passaging, confluent cultures were washed with PBS and then incubated with 0.05% Trypsin EDTA for 4 -5 min. The pellet was re-suspended in to MEF media and incubated at 370C & 5% CO
2. Cells grown up to passage 3 from 8- 10 flasks were
pooled together and used for further studies.
Microarray analysis
Transcriptional changes between 13.5 and 18.5dpc MEF were studied using Agilent Mouse Genome 8x15k array (AMADID 16270) starting with total RNA. Human fetal fibroblasts were similarly analyzed using human genome 8x15k array (AMADID 16332). All the three arrays were done using single color microarray based gene expression analysis.
RNA extraction and quality control
For RNA extraction, cells were suspended in RNAlater (Qiagen, USA)) immediately after harvesting at room temperature. After permeabilisation of RNAlater for at least an hour, total RNA was isolated from the cells using RNAeasy Mini kit (Qiagen, USA) according to the instructions of the manufacturer. RNA integrity was assessed using RNA 6000 Nano Lab Chip on the 2100 Bioanalyzer (Agilent, USA) following the manufacturer’s protocol. Total RNA purity was assessed by the NanoDrop Spectropho-tometer (Nanodrop Technologies, USA). Total RNA with OD260/ OD280>1.8 and OD260/OD270 ≥ 1.3 was used for microarray experi-ments.
cRNA synthesis, labeling and microarray hybridization
Low RNA Input Fluorescent Linear Amplification Kit (Agilent, CA) was used for labeling. Briefly, both first and second strand cDNA were synthesized by incubating 500ng of total RNA with 1.2μl of oligo dT-T7 Promoter Primer in nuclease-free water at 650C for 10 min followed by
incubation with 4.0μl of 5◊ First strand buffer, 2μl of 0.1M DTT, 1 μl of 10mM dNTP mix, 1μl of 200 U/μl MMLV-RT, and 0.5μl of 40U/μl RNaseOUT, at 400C for 2 hour. Immediately following cDNA synthesis,
the reaction mixture was incubated with 2.4 μl of 10 mM Cyanine-3-CTP (Perkin-Elmer, MA), 20μl of 4X Transcription buffer, 8 μl of NTP mixture, 6 μl of 0.1M DTT, 0.5 μl of RNaseOUT, 0.6μl of Inorganic pyrophos-phatase, 0.8 μl of T7 RNA polymerase, and 15.3μl of nuclease-free water at 400C for 2 hour. Qiagen’s RNeasy mini spin columns were used for
purifying amplified samples. The quantity and specific activity of cRNA was determined by using NanoDrop spectrophotometer. Samples with specific activity >8 were used for hybridization. 825ng of each Cyanine 3 labeled cRNA in a volume of 41.8μl were combined with 11μl of 10x blocking agent and 2.2μl of 25x fragmentation buffer, and incubated at 600Cfor 30 minutes in dark. The fragmented cRNA were mixed with 55μl
of 2x hybridization buffer. About 10μl of the resulting mixture was applied to the 8x15k Gene Expression Microarray (Agilent Technologies), and hybridized at 650C for 17 hours. After hybridization, slides were washed
with wash buffer for 1 min at room temperature followed by a 1 min wash with wash buffer II at 370C. Slides were finally rinsed with acetonitrile for
cleaning up and drying.
Scanning & feature extraction
Hybridized arrays were scanned at 5μm resolution on a DNA scanner and data extraction from images was done using Feature Extraction software.
Data analysis and biological interpretation
Microarray output images were manually examined for excessive noise and physical anomalies. Feature extracted data was analyzed using GeneSpring GX version 7.3.1 (Genotypic, Bangalore, India) and Microsoft Excel software. Normalization of the data was done within GeneSpring using the recommended per chip and per gene data transfor-mation which included the set measurement less than 0.01 to 0.01, per chip normalization to 50th percentile and normalization of each gene to the median. Further quality control of normalized data was done using correlation based condition tree to eliminate bad experiments. In order to assess the differentially expressed genes between 13.5 and 18.5dpc MEF, up and down regulated genes were subjected to functional analysis using GeneSpring GX software ontology browser by selecting appropri-ate parameters in the tool. The statistically significant transcripts were annotated using web based Biointerpreter version 1.1 (Genotypic) soft-ware to generate clusters of functionally related genes to understand their biological significance.
Comparative studies of microarray data with published proteomics data
A total of eighty-five proteins reported earlier in the conditioned medium of supportive feeder layers (Lim et al. 2002; Prowse et al. 2005,
2007; Kueh et al. 2006; Eiselleova et al. 2008) and belonging to the
categories of extracellular matrix proteins, cell cytoskeleton and growth factors, were analyzed at the transcriptome level between supportive (13.5dpc MEF and HFF) and non- supportive (18.5dpc MEF) feeders.
Scanning electron microscopy
Fibroblast cells were grown on sterile 100mm2 glass coverslips. They
were fixed in 2.5% glutaraldehyde (Pelco International, Redding, CA) in 0.1M cacodylate (Pelco) buffer (pH 7.4), after two washes in phosphate buffer saline (PBS) to remove media and serum contents. After several washes in the cacodylate buffer, the cells were post fixed with buffered 1.0% osmium tetroxide (Pelco) for 30min at 40C. Later the coverslips were
washed in buffer, dehydrated in a ascending series of ethanol and critical point dried for 20 min in liquid CO2 in a E 3100 critical point drier (Quorum technologies; www.quorumtech.com, UK). The coverslips were then stuck to aluminum stubs and coated with gold-palladium for 20 sec at 20 mA using Polaron sputter coater (SC7640, Quorum Technologies) coat-ing apparatus. Fibroblasts were then examined under JEOL 6400 scan-ning electron microscope (JEOL, Tokyo, Japan) and representative areas were photographed.
Immunocytochemical localization of ααααα-smooth muscle actin (α−α−α−α−α− SMA)
α
Denmark) at 40C. AlexaflourTM 488 (Molecular Probe, Invitrogen)
conju-gated secondary antibody diluted 1: 1000 in blocking solution was used to visualize the specific localization of αSMA antibody in supportive and nonsupportive fibroblasts. Representative areas were photographed under florescent microscope (90i, Nikon, Japan).
Western Blot analysis
Feeder fibroblasts of 13.5dpc MEF, 18.5dpc MEF and HFF, cultured in T-75 flasks were harvested into 500 ul of 1X lysis solution (10mM Tris, pH 7.6, 100mM Nacl, 1mM EDTA, 1% v/v Triton X 100, 10% v/v Glycerol) supplemented with 1% v/v, 1X protease inhibitor mix (Amersham, GE Healthcare). 20ug of protein lysate was electrophoresed on 12% SDS-PAGE gel followed by electroblotting on PVDF membrane (Amersham, GE Healthcare). Membrane was then blocked with 5% NFDM in TBST and incubated with monoclonal primary mouse anti α-SMA antibody (1:1500) (Chemicon International, CA, USA) at 40C over night. Detection
of α-SMA was performed by incubating membrane with HRP conjugated goat anti mouse secondary antibody (1:10,000) (Jackson Immuno Re-search Laboratories) for 2 hrs at room temperature followed by chemilu-minescent (SuperSignal West Pico, Pierce, USA) exposure of HyperfilmTM
ECL (Amersham, GE Healthcare). Monoclonal mouse anti GAPDH anti-body (1:5000) (Calbiochem, USA) was used as house keeping to quan-titate alpha SMA Expression in various fibroblasts using Gene Tools software (Syngene, UK).
Acknowledgements
This study (BTPR3985/MED/14/49712003) was financially supported by Department of Biotechnology, Govt. of India. Authors are grateful to Prof Jayesh Bellare, Sillicate Lab, Indian Institute of Technology, Mumbai, for assisting in Scanning Electron Microscopy studies.
References
BILLOTTET, and JOUANNEAU, J. (2008). Tumor-stroma interactions. Bull Cancer 95: 51-56.
DE WEVER, O. and MAREEL, M. (2003). Role of tissue stroma in cancer cell invasion. J Pathol 200: 429-447.
DIECKE, S., QUIROGA-NEGREIRA, A., REDMER, T. AND BESSER, D. (2008) FGF2 signaling in mouse embryonic fibroblasts is crucial for self-renewal of embryonic stem cells. Cells Tissues Organs 188: 52-61.
DRAVID, G., YE, Z., HAMMOD, H., CHEN, G., PYLE, A., DONOVAN, P., YU, X. and CHENG, L. (2005). Defining the role of Wnt/ β-catenin signaling in the survival, proliferation, and self renewal of human embryonic stem cells. Stem Cells 23: 1489-1501.
EISELLEOVA, L., PETERKOVA, I., NERADIL, J., SLANINOVA, I., HAMPL, A. and DVORAK, P. (2008). Comparative study of mouse and human feeder cells for human embryonic stem cells. Int J Dev Biol 52: 353-363.
ELLIOTT, R.L. and BLOBE, G.C. (2005). Role of transforming growth factor beta in human cancer. J Clin Oncol 23: 2078-2093.
GABBIANI, G., RYAN, G. and MAJNE, G. (1971). Presence of modified fibroblast in granulation tissue and their possible role in wound contraction. Experimentia 27: 549-550.
GAMMILL, L.S., and BRONNER-FRASER, M. (2002). Genomic analysis of neural crest induction. Development 129: 5731-5741.
GREBER, B., LEHRACH, H. and ADJAYE, J. (2007). Fibroblast growth factor 2 modulates transforming growth factor b signaling in mouse embryonic fibro-blasts and human ESCs (hESCs) to support hESC self renewal. Stem Cells 25: 455-464.
JAMES, D., LEVINE, A.J., BESSER, D. and HEMMATI-BRIVANLOU, A. (2005).
in human embryonic stem cells. Development 132: 1273-1282.
KALLURI, R. and ZEISBERG, M. (2006). Fibroblasts in cancer. Nat Rev Cancer 5: 392-401.
KUEH, J., RICHARDS, M., SZE-WAI, N.G., CHAN, W.K. and BONGSO, A. (2006). The search for factors in human feeders that support the derivation and propagation of human embryonic stem cells: preliminary studies using transcriptome profiling by serial analysis of gene expression. Fertil Steril 85: 1843-1846.
KUMAR, N., HINDUJA, I., NAGVENKAR, P., PILLAI, L., ZAVERI, K., MUKADAM, L., TELANG, J., DESAI, S., MANGOLI, V., MANGOLI, R., PADGAONKAR, S., KAUR, G., PURI, C. and BHARTIYA, D. (2009). Derivation and characterization of two genetically unique human embryonic stem cell lines on in-house derived human feeders. Stem Cells Dev 18:435-445.
LIM, J.W.E. and BODNAR, A. (2002). Protemome analysis of conditioned medium form mouse embryonic fibroblast feeder layers which support the growth of human embryonic stem cells. Proteomics 2: 1187-1203.
M, A.O., FRANCO, O.E., PARK, D., RAMAN, D., WILLIAMS and HAYWARD, S.W. (2007). Cross-talk between paracrine-acting cytokine and chemokine pathways promotes malignancy in benign human prostatic epithelium. Cancer Res 67: 4244-4253.
MARTIN, M.J., MUOTRI, A., GAGE, F. and VARKI, A. (2005). Human embryonic stem cells express an immunogenic nonhuman sialic acid. Nat Med 11: 228– 232.
MISHRA, L., DERYNCK, R. and MISHRA, B. (2005). Transforming growth factor-β signaling in stem cells and cancer. Cell Signaling 310: 68-71.
PROWSE, A.B., MC QUADE, L.R., BRYANT, K.J., DYK, D.D., TUCH, B.E. and GRAY, P.P. (2005). A proteome analysis of conditioned medium from mouse embryonic fibroblast feeder layers which support the growth of human embry-onic stem cells. Proteomics 5: 978-989.
PROWSE, A.B., MC QUADE, L.R., BRYANT, K.J., MARCAL, H. and GRAY, P. (2007). Identification of potential pluripotency determinants for human embry-onic stem cells following proteomic analysis of human and mouse fibroblast conditioned media. J Proteome Res 6: 3796-3807.
RICE, N.A. and LEINWAND, L.A. (2003). Skeletal myosin heavy chain function in cultured lung myofibroblasts. J Cell Biol 163: 119-129.
RICHARDS, M., TAN, S., FONG, C.Y., BISWAS, A., CHAN, W.K. and BONGSO, A (2003). Comparative evaluation of various human feeders for prolonged undifferen-tiated growth of human embryonic stem cells. Stem Cells 21: 546-556.
ROBERTS, A. and MISHRA, L. (2005). Role of TGF-β in cells and cancer. Oncogene 24: 5667.
SAHA, S., JI, L., DE PABLO, J.J. and PALECEK, S.P. (2008). TGF beta/Activin/ Nodal pathway in inhibition of human embryonic stem cell differentiation by mechanical strain. Biophys J 94: 4123-4133.
SHI-WEN, X., PARAPURAM, S.K., PALA, D., CHEN, Y., CARTER, D.E., EASTWOOD, M., DENTON, C.P., ABRAHAM, D.J. and LEASK, A. (2009). Requirement of transforming growth factor beta-activated kinase 1 for trans-forming growth factor beta-induced alpha-smooth muscle actin expression and extracellular matrix contraction in fibroblasts. Arthritis Rheum 60: 234-241.
STOVER, D.G., BIERIE, B. and MOSES, H.L. (2007). A delicate balance: TGF-b and the tumor microenvironment. J Cell Biochem 101: 851-861.
TOMASEK, J.J., GABBIANI, G., HINZ, B., CHAPONNIER, C. and BROWN, R.A. (2002). Myofibroblasts and mechanoregulation of connective tissue remodel-ing. Nat Rev Mol Cell Biol 3: 349-363.
VAUGHAN, M.B., HOWARD, E.W. and TOMASEK, J.J. (2000). Transforming growth factor-beta1 promotes the morphological and functional differentiation of the myofibroblast. Exp Cell Res 257: 180-189.
Further Related Reading, published previously in the Int. J. Dev. Biol.
See Special Issue Pattern Formation edited by Michael K. Richardson and Cheng-Ming Chuong at: http://www.ijdb.ehu.es/web/contents.php?vol=53&issue=5-6
Comparative study of mouse and human feeder cells for human embryonic stem cells
Livia Eiselleova, Iveta Peterkova, Jakub Neradil, Iva Slaninova, Ales Hamp and Petr Dvorak Int. J. Dev. Biol. (2008) 52: 353-363
Common culture conditions for maintenance and cardiomyocyte differentiation of the human embryonic stem cell lines, BG01 and HUES-7
Chris Denning, Cinzia Allegrucci, Helen Priddle, Maria D. Barbadillo- Muñoz, David Anderson, Tim Self, Nigel M. Smith, C. Tony Parkin and Lorraine E. Young
Int. J. Dev. Biol. (2006) 50: 27-37
The stroma reaction myofibroblast: a key player in the control of tumor cell behavior
Alexis Desmoulière, Christelle Guyot and Giulio Gabbiani Int. J. Dev. Biol. (2004) 48: 509-517
Functional analysis of the TGFbeta receptor/Smad pathway through gene ablation in mice
M J Goumans and C Mummery Int. J. Dev. Biol. (2000) 44: 253-265
Type beta transforming growth factors and activins in differentiating embryonal carcinoma cells, embryonic stem cells and early embryonic development
C L Mummery and A J van den Eijnden-van Raaij Int. J. Dev. Biol. (1993) 37: 169-182