BIOANALYTICAL METHOD DEVELOPMENT AND VALIDATION OF CANAGLIFLOZIN IN HUMAN
PLASMA BY LIQUID CHROMATOGRAPH
Y–TANDEM MASS SPECTROMETRY
DEEPAN T
1,2, BASAVESWARA RAO MV
1, DHANARAJU MD
2*
1Department of Pharmacy, Krishna University, Machilipatnam, Andhra Pradesh, India. 2Department of Pharmaceutics, GIET School of
Pharmacy, Rajahmundry, Andhra Pradesh, India. Email: [email protected]
Received: 12 April 2019, Revised and Accepted: 10 June 2019 ABSTRACT
Objective: A validated liquid chromatography–tandem mass spectrometry (LC–MS/MS) method was developed for canagliflozin in human plasma along with stability studies.
Methods: The chromatographic separation of canagliflozin was performed on Zorbax XDB phenyl (75 × 4.6 mm, 3.5 mm) using methanol:acetate buffer (80:20 v/v) at a flow rate of 1.0 ml/min. The LC–MS/MS system consists of API 4000 triple quadrupole mass spectrometer equipped with turbospray ionization and an AS8020 automatic sample injector.
Results: The retention time of canagliflozin was 1.15 min and total runtime was 2 min. The multiple reaction monitoring was 462.5/267.1 (m/z) for canagliflozin and 466.4/267.2 (m/z) for internal standard (canagliflozin D4), respectively. The method was linear over the range of 10–7505 ng/ml.
The calculated slope ranged from 0.0451 to 0.0502 and intercepts from 0.0102 to 0.0456 with coefficients of the determination of 0.9970. The overall mean recovery of internal standard and canagliflozin was 76.66 and 79.77, respectively.
Conclusion: The method was successfully validated and it was found to be within the limits for accuracy, precision, and linearity and it is stable under analytical conditions used.
Keywords: Canagliflozin, Liquid chromatography–tandem mass spectrometry, Human plasma, Liquid–liquid extraction, Validation, Stability studies.
INTRODUCTION
Canagliflozin chemically is (2S.3R, 4R, 5S, 6R)-2-(3-{[5-(4-flurophenyl) thiophenyl) thiopen-2-yl] methyl}-4 methyl phenyl)-6-(hydroxy methyl) oxane-3, 4, 5,-triol represented in Fig. 1 (Drug bank) [1]. The molecular formula is C24H25FO5S and molecular weight is
444.52 g/mol. Canagliflozin is classified as SGLT-2 inhibitor, a new class of antidiabetic drug having an insulin-dependent mechanism that offers a considerable advantage of increasing urinary glucose excretion without inducing hypoglycemia [2]. Several analytical methods such as ultraviolet [3], high-performance liquid chromatography (HPLC) [4-7], high-performance thin-layer chromatography [8], liquid chromatography–tandem mass spectrometry (LC–MS/MS) [9-11] have been developed for analysis of canagliflozin. There are methods developed for canagliflozin in rat plasma. However, there is no method reported for canagliflozin in human plasma along with stability studies. This study describes that a validated LC–MS/MS method was developed for canagliflozin in human plasma along with stability studies.
METHODS
Chemicals and reagents
Canagliflozin and internal standard (canagliflozin D4) were obtained
from Piramal Healthcare. K3EDTA plasma was from local suppliers, acetonitrile and methanol were of HPLC grade, ammonium acetate (GR grade) was used, and water was from Milli Q system.
Instrumentation
The HPLC separation was achieved on Zorbax XDB phenyl (75×4.6 mm, 3.5 mm) using methanol:acetate buffer (80:20 v/v) at a flow rate of 1.0 ml/min. The injection volume was 10 µl and the column temperature was 30°C. The samples were held at 5±3°C in an autosampler.
The runtime was 2.0 min. The LC–MS/MS system consists of API 4000 triple quadrupole mass spectrometer equipped with turbospray ionization and an AS8020 automatic sample injector. The multiple reaction monitoring (MRM) was 462.5/267.1 (m/z) for canagliflozin and 466.4/267.2 (m/z) for internal standard (canagliflozin D4),
respectively. The temperature of the capillary was 50°C and the dwell time was 100 millisecond or ms.
Preparation of standards and quality control (QC) samples
Stock solution of canagliflozin was prepared in methanol to get concentration of 5 µg/ml. The calibration curve standard solution was prepared by further diluting the stock solution in methanol to the following analytical condition (10, 25, 150, 375, 750, 1875, 3750, 6000, and 7500 ng/ml) for canagliflozin. The internal standard working solution was prepared by diluting stock solution in methanol to 5000 ng/ml. QC samples were prepared in the same manner from the QC stock to get final concentration of 28 (LQC), 706 middle QC (MQC), and 5700 high QC (HQC) in plasma. QC samples were stored in deep freezer with study samples and include with all validation and sample analysis runs.
Extraction procedure
To a glass tube containing 300 µl of plasma sample, added 50 µl of 2000 ng/ml internal standard working solution. The sample was mixed on a vortex mixer for approximately 5 s. Then, 2.0 µl of tertiary butyl methyl ether was added to the vials and extracted for a period of 15 min or rotospin at 40 rpm. The vials were centrifuged at 4500 rpm at 4±1°C for 5 min. Finally, the samples (1.8 µl) were eluted into a deep well collection plate evaporated to dryness under nitrogen at 40±5°C and reconstituted in 300 µl of solution of mixture of acetonitrile:phosphate buffer (80:20%) vortexed for about 10 s, and finally, 10 µl of each reconstituted sample extract was injected into LC–MS/MS.
© 2019 The Authors. Published by Innovare Academic Sciences Pvt Ltd. This is an open access article under the CC BY license (http://creativecommons. org/licenses/by/4. 0/) DOI: http://dx.doi.org/10.22159/ajpcr.2019.v12i8.33228
Assay validation
The method was validated as per Food and Drug Administration guidance for bioanalytical method validation [12].
Accuracy and precision
The accuracy and precision of the proposed method were determined using QC samples (low, medium, and high) over the concentration of 28–5750 ng/ml for assay precision and accuracy. Six QC validation levels such as DQC, LQC, MQC3, MQC2, MQC1, and HQC were tested. The accuracy and intraday precision of the assay method were performed on three different runs, each run containing duplicate full calibration curves and six samples for each of the six QC levels. The recovery from human plasma during extraction was determined at LQC, MQC1, and HQC levels for canagliflozin by comparing the response ratios in human plasma sample with those of QC sample spiked in the supernatant of the extracted blank plasma. The LLOQ was assessed using plasma samples at 10 ng/ml for canagliflozin, the lowest concentration in the standard curves. Six different lots of control human plasma were spiked to obtain the six LLOQ samples. The LLOQ samples were processed and analyzed with standard curves and QC samples.
The matrix effect was determined at low- and high-level QC for canagliflozin. The absolute matrix factors for three QC samples were determined by comparing the peak area of the QC sample spiked in the mobile phase with those in the supernatant of extracted blank plasma.
Stability studies
The stability studies of canagliflozin in human plasma were evaluated using QC samples (low, medium, and high concentration) under various conditions. The autosampler stability was evaluated by analyzing QC samples that had been stored under conditions (5±3°C) and room temperature for 3 days. The long-term stability was also evaluated by analyzing QC samples that had been stored at 2–8°C for 7 days. Freeze-thaw stability was also evaluated by analyzing HQC
and LQC samples after freezing at −28±5°C and thawing at room
temperature 5 times.
The stability was established if the average of the six determinations was within 15% and no obvious trend was observed.
RESULTS AND DISCUSSION
In the present study, LC–MS/MS assay was developed for positive ionization which was evaluated. The full scan mass spectrum of canagliflozin and internal standard in the positive MRM is presented in Figs. 2 and 3. The reliability of the method was assessed on the basis of linearity, precision, selectivity, accuracy, recovery, and carryover test. Finally, the chromatographic separation was carried out on a combination of methanol:acetate buffer (80:20 v/v) at a flow rate of 1.0 ml/min which resulted in a separation time of 1.15 min for analyte and internal standard.
Accuracy and precision
The interbatch coefficient of variation ranged from 2.86 to 5.61 and percentage accuracy ranged from 101.61 to 109.86 for canagliflozin. The results for within and between in batch precision for LQC, MQC, and HQC should be <15.00%, and for the LLOQ, it should be <20.00%. The intrabatch coefficient of variation ranged from 2.80 to 4.97 and the percentage accuracy ranged from 102.04 to 110.38% for canagliflozin. The precision ranged from 2.58 to 3.39%. The results prove that the canagliflozin and internal standard can remain in autosampler for 67 h 15 min, without showing a significant loss indicates that the sample should be analyzed within this period. The results are shown in Table 1.
Linearity
The method was linear over the range of 10–7505 ng/ml. The calculated slope ranged from 0.0451 to 0.0502 and intercepts from 0.0102 to 0.0456 with coefficients of the determination of 0.9970 or higher.
Recovery
The mean recovery of canagliflozin and canagliflozin D4 (internal
standard) was evaluated by comparing peak mean peak response of LQC, MQC1, and HQC sample to those of diluted aqueous solution. The overall mean recovery of internal standard and canagliflozin was 76.66 and 79.77, respectively. The overall percentage coefficient of variation was 3.94. This indicates that the method has good recovery of both analyte and internal standard. The results are shown in Tables 2 and 3.
Matrix effect
No significant matrix effect was observed in all the eight batched for canagliflozin at LQC and HQC concentrations. The precision for internal standard normalized matrix factor at LQC and HQC level was found to be 2.46% and 3.84%, respectively. The precision of internal standard normalized matrix at each level (HQC and LQC) should be <15.00. The above-reported method showed that no matrix effect was found for plasma and shown in Table 4.
Fig. 1: Chemical structure of canagliflozin
Fig. 3: Mass spectra of canagliflozin D4
Table 1: Accuracy and precision of canagliflozin
S. No. Q.C nom. conc. (ng/ml) Mean (ng/ml) Precision (CV %) Accuracy (%) SD
Intra Inter Intra Inter Intra Inter Intra Inter
1. LQC (28.89) 29.48 30.25 4.89 4.15 102.0 104.73 1.44 1.25 2. MQC (705.22) 778.4 774.75 3.11 2.86 110.3 109.86 24.22 22.15 3. HQC (5750.45) 6007.72 5843.0 2.80 4.42 104.4 101.61 168.3 258.4
Q.C nom. conc.: Quality control nominal concentration. CV: Coefficient of variation, SD: Standard deviation, HQC: High-quality control, MQC: Middle-quality control, LQC: Low-quality control, QC: Quality control
Table 2: Recovery for canagliflozin
S. No. HQC MQC1 LQC
Post‑extracted
response Extracted response Post‑extracted response Extracted response Post‑extracted response Extracted response
1. 4,002,365 3,023,654 2,869,574 2,236,577 31,564 25,645 2. 3,485,623 3,125,678 2,798,654 2,045,689 30,214 24,587 3. 3,698,756 3,256,891 2,856,457 2,145,689 32,564 21,457 4. 3,789,562 3,369,871 2,903,654 2,365,894 33,456 25,487 5. 3,895,647 3,045,689 2,778,965 2,265,436 31,265 26,354 6. 3,957,863 3,256,489 2,812,654 2,154,879 30,125 25,487 Mean 3,804,969.3 3,179,712.0 2,836,659.7 2,202,360.7 31,531.3 24,836.2 SD 191,866.99 136,563.31 47,566.60 111,269.59 1308.12 1748.49
% CV 5.04 4.29 1.68 5.05 4.15 7.04
% mean recovery 79.99
SD 3.149
% CV 3.94
HQC: High-quality control, MQC: Middle-quality control and LQC: Low-quality control, CV: Coefficient of variation, SD: Standard deviation
Table 3: Recovery for internal standard
S. No. HQC MQC1 LQC
Post‑extracted
response Extracted response Post‑extracted response Extracted response Post‑extracted response Extracted response
1. 155,645 112,356 165,234 125,645 225,687 190,365
2. 145,687 110,234 160,324 120,364 245,897 185,641
3. 149,654 120,236 166,354 130,324 201,365 189,654
4. 150,234 115,234 160,324 131,256 223,654 175,654
5. 151,234 100,364 159,654 129,365 236,545 177,563
6. 152,364 108,654 185,364 125,847 232,254 170,235
Mean 150,803.0 111,179.7 166,209.0 127,133.5 227,567.0 181,518.7
SD 3282.83 6694.63 9799.19 4046.00 15,125.82 8231.62
% CV 2.18 6.02 5.90 3.18 6.65 4.53
% mean recovery 76.66
SD 3.019
% CV 3.94
Sensitivity
The lowest limit of reliable quantification of canagliflozin in human plasma set at the concentration of the LLOQ is 10.13 ng/ml. The precision and accuracy for canagliflozin at this concentration was found to be 2.83% and 95.65%.
Stability
The stability of canagliflozin and internal standard was evaluated in plasma under different conditions such as freeze-thaw stability, bench-top stability, autosampler stability, and long-term stability. All the stabilities were carried out at two concentrations (28.893 ng/ml and 5750.456 ng/ml) as low and high concentration values with six determinations for each stability test along with calibration curve standards.
The refrigerated stock solution stability of canagliflozin was carried out by injecting six replicates of internal standard. The precision ranged from 2.04% to 2.94% and percentage of stability was found to be 99.29%. The internal standard precision ranged from 0.95% to 1.65% and percentage of stability was found to be 98.49%.
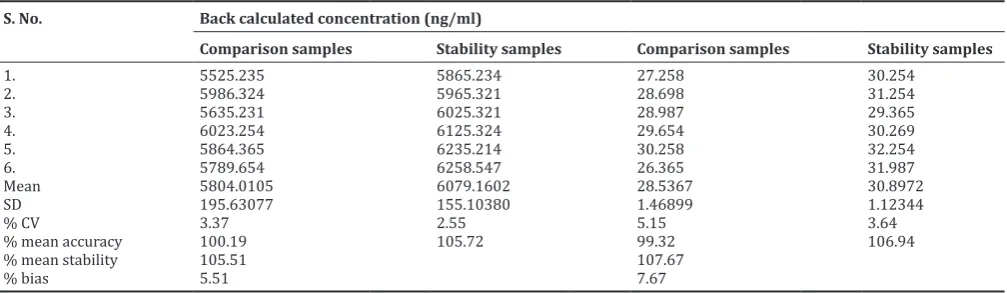
The autosampler stability of canagliflozin was performed by injecting six sets of QC samples (LQC and HQC) and placed in autosampler for 67 h 15 min. The percentage stability was 105.33% and 107.07% for HQC and LQC; percentage mean accuracy was 105.54% and 106.33%, respectively. The results are shown in Table 5.
The analytes were found to be stable in dry as well as wet extract. The dry extract stability was carried out at room temperature, whereas wet extracted solubility was carried out at refrigerator temperature (2–8°C). The wet extract stability for refrigerator temperature has been proved at 57 h 45 min, ranged from 105.51% to 106.67% and precision ranged from 5.51% to 7.67%, respectively. The values are shown in Table 6.
The dry extract solubility has been proven at room temperature for 10 h 15 min, ranged from 100.41 to 104.925 and precision ranged from 1.98 to 7.27%, respectively. The values are shown in Table 7.
The freeze-thaw stability of canagliflozin was carried out for five
cycles at −28±5°C. The percentage mean stability was 92.04–101.58%
and precision was 3.48–4.57%, respectively. The results are shown in Table 8.
The bench-top stability was carried out using six sets, each of LQC and HQC was determined at 17 h 5 min. The percentage mean accuracy was
Table 4: ISTD normalized matrix factor
S. No. HQC LQC
ISTD: Internal Standard, SD: Standard deviation, HQC: High-quality control, LQC: Low-quality control, CV: Coefficient of variation
Table 5: Autosampler stability
S. No. Back calculated concentration (ng/ml)
Comparison samples (FQC) Stability samples Comparison samples (FQC) Stability samples
1. 5525.235 5856.325 27.258 30.258
2. 5986.324 5936.235 28.698 31.254
3. 5635.231 6025.321 28.987 29.654
4. 6023.254 6125.364 29.654 31.257
5. 5864.365 6235.241 30.258 32.254
6. 5789.654 6234.214 26.365 29.654
Mean 5804.0105 6068.7833 28.5367 30.7218
SD 195.63077 156.76314 1.46899 1.04046
% CV 3.37 2.58 5.15 3.39
% mean accuracy 100.19 105.54 99.32 106.33
% mean stability 105.33 107.06
% bias 5.33 7.06
SD: Standard deviation, CV: Coefficient of variation, FQC: Final quality control
Table 6: Wet extract stability at refrigerator temperature
S. No. Back calculated concentration (ng/ml)
Comparison samples Stability samples Comparison samples Stability samples
1. 5525.235 5865.234 27.258 30.254
2. 5986.324 5965.321 28.698 31.254
3. 5635.231 6025.321 28.987 29.365
4. 6023.254 6125.324 29.654 30.269
5. 5864.365 6235.214 30.258 32.254
6. 5789.654 6258.547 26.365 31.987
Mean 5804.0105 6079.1602 28.5367 30.8972
SD 195.63077 155.10380 1.46899 1.12344
% CV 3.37 2.55 5.15 3.64
% mean accuracy 100.19 105.72 99.32 106.94
% mean stability 105.51 107.67
% bias 5.51 7.67
108.82–109.21%, respectively, and the precision range was from 2.04 to 2.47%, respectively.
The long-term matrix stability of QC samples was stored at −28±5°C for
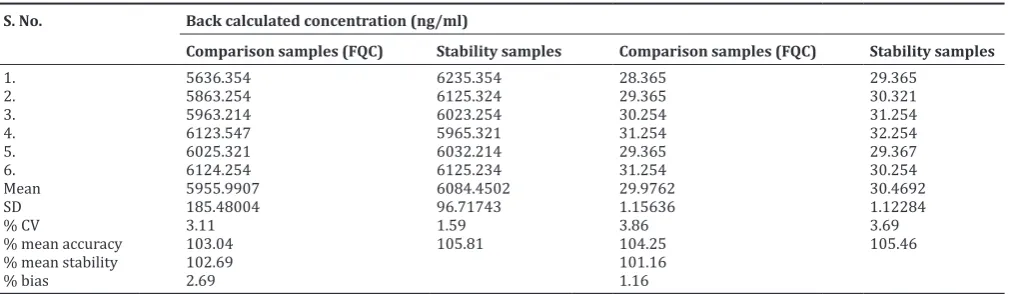
91 days which was assessed. The percentage stability was found to be 101.16–102.69%; coefficient of variation was 1.59–3.69. These values indicate that the canagliflozin is stable for at least 91 days; it should be analyzed within this period. The results are shown in Table 9.
CONCLUSION
The results of matrix effect, linearity, precision, accuracy, stabilities, and recovery were in the acceptable range as per guidance for industry-bioanalytical method validation. The LC–MS/MS method described
above is valid for the estimation of canagliflozin in human plasma over a range of 462.500/267.100 with the detection of canagliflozin (m/z) and internal standard canagliflozin D4 466.400/267.200 (m/z) in positive
ion mode.
ACKNOWLEDGMENT
The author would like to thank Mr. Anupindi raghuram,Krish biotech for providing sample to carryout the research work.
AUTHORS’ CONTRIBUTIONS
All authors contributed equally to the paper.
Table 7: Dry extract stability at room temperature
S. No. Back calculated concentration (ng/ml)
Comparison samples Stability samples Comparison samples Stability samples
1. 5525.235 6023.542 27.258 25.365
2. 5986.324 5963.254 28.698 28.657
3. 5635.231 6025.321 28.987 29.657
4. 6023.254 5898.365 29.654 31.254
5. 5864.365 6123.254 30.258 27.687
6. 5789.654 6235.247 26.365 30.257
Mean 5804.0105 6044.8305 28.5367 28.8128
SD 195.63077 119.45658 1.46899 2.09461
% CV 3.37 1.98 5.15 7.27
% mean accuracy 100.19 105.12 99.32 99.72
% mean stability 104.92 100.41
% bias 4.92 0.41
SD: Standard deviation, CV: Coefficient of variation, SD: Standard deviation, FQC: Final quality control
Table 8: Freeze‑thaw stability
S. No. Back calculated concentration (ng/ml)
Comparison samples Stability samples Comparison samples Stability samples
1. 5525.235 5026.354 27.258 28.654
2. 5986.324 5124.258 28.698 29.354
3. 5635.231 5264.258 28.987 27.354
4. 6023.254 5525.365 29.654 29.657
5. 5864.365 5654.258 30.258 30.258
6. 5789.654 5458.254 26.365 28.654
Mean 5804.0105 5342.1245 28.5367 28.9885
SD 195.63077 244.02069 1.46899 1.00871
% CV 3.37 4.57 5.15 3.48
% mean accuracy 100.93 92.90 98.77 100.33
% mean stability 92.04 101.58
% bias −7.96 1.58
% mean stability: Percentage mean stability, % mean accuracy: Percentage mean accuracy. SD: Standard deviation, CV: Coefficient of variation, FQC: Final quality control
Table 9: Long‑term stability
S. No. Back calculated concentration (ng/ml)
Comparison samples (FQC) Stability samples Comparison samples (FQC) Stability samples
1. 5636.354 6235.354 28.365 29.365
2. 5863.254 6125.324 29.365 30.321
3. 5963.214 6023.254 30.254 31.254
4. 6123.547 5965.321 31.254 32.254
5. 6025.321 6032.214 29.365 29.367
6. 6124.254 6125.234 31.254 30.254
Mean 5955.9907 6084.4502 29.9762 30.4692
SD 185.48004 96.71743 1.15636 1.12284
% CV 3.11 1.59 3.86 3.69
% mean accuracy 103.04 105.81 104.25 105.46
% mean stability 102.69 101.16
% bias 2.69 1.16
CONFLICTS OF INTEREST
The author declares that they have no conflicts of interest.
REFERENCES
1. Available from: https://www.drugbank.ca/drugs/DB08907.
2. Kaushal S, Singh H, Thangaraju P, Singh J. Canagliflozin: A Novel SGLT2 inhibitor for Type 2 diabetes mellitus. N Am J Med Sci 2014;6:107-13.
3. Kaur I, Wakode S, Singh HP. Development and validation of stability indicating UV spectroscopic method for determination of canagliflozin in bulk and pharmaceutical dosage form. Pharm Methods 2016;7:63-9. 4. Iqbal M, Khalil NY, Alanazi AM, Al-Rashooda KA. A simple and
sensitive high-performance liquid chromatography assay with a fluorescence detector for determination of canagliflozin in human plasma. Anal Methods 2015;7:3028-35.
5. Sen G, Babu KR, Annapurna N, Vekariya NA. Validation of stability-indicating reverse phase HPLC method for the determination of related substances in canagliflozin drug substance. IOSR J Pharm Biol Sci 2017;12:86-94.
6. Suneetha A, Sharmila D. A validated stability indicating RP-HPLC
method for estimation of canagliflozin in dosage form. Res J Pharm Biol Chem Sci 2015;6:1186-94.
7. Ashok P, Narenderan ST, Meyyanathan SN, Babu B, Vadivelan R. Development and validation of a RP-HPLC method for estimation of telmisartan in human plasma. Int J Appl Pharm Res 2019;11:237-40. 8. Kaur I, Wakode S, Singh HP. Development and validation of a
stability-indicating high-performance thin layer chromatography (HPTLC) method for estimation of canagliflozin in bulk and pharmaceutical dosage form. J Appl Pharm Sci 2016;6:51-7.
9. Kobuchi S, Yano K, Ito Y, Sakaeda T. A validated LC-MS/MS method for the determination of canagliflozin, a sodium-glucose co-transporter 2 (SGLT-2) inhibitor, in a lower volume of rat plasma: Application to pharmacokinetic studies in rats. Biomed Chromatogr 2016;30:1549-55. 10. Prasad PB, Satyanarayana K, Mohan GK. Simultaneous determination
of metformin, linagliptin in jentadueto and metformin, saxagliptin in kombiglyze by LC-MS method. Int J Pharm Pharm Sci 2018;10:110-6. 11. Pinjari MJ, Somani RS, Gilhotra RM. A rapid, sensitive and
validated ultra-performance liquid chromatography and tandem mass spectrometry method for determination of paromomycin in Mice plasma: Application to pharmacokinetic study. Int J Pharm Pharm Sci 2017;9:86-90.