_______________________________________________
Aus der medizinischen Klinik und Poliklinik III der Ludwig-Maximilians-Universität München Direktor: Prof. Dr. med. Wolfgang Hiddemann
Detection of DNMT3A R882 Mutations in Patients with Acute Myeloid Leukaemia
Dissertation
zum Erwerb des Doktorgrades der Medizin an der Medizinischen Fakultät der Ludwig-Maximilians-Universität zu München
vorgelegt von
Kathrin Eva Bisling aus
Reinbek
Mit Genehmigung der Medizinischen Fakultät der Universität München
Berichterstatter: Prof. Dr. med. Martin Dreyling
Mitberichterstatter: Prof. Christian Ries
Prof. Ortrud Steinlein Prof. Irmela Jeremias
Mitbetreuung durch den
promovierten Mitarbeiter: Dr. Timothy Chevassut
Dekan: Prof. Dr. med. dent. Reinhard Hickel
Acknowledgements
I would like to thank Professor Martin Dreyling for giving me the outstanding opportunity to accomplish my doctoral thesis abroad. His organisation and flexibility made this very special and rewarding scientific collaboration between Ludwig Maximilian University Großhadern and Brighton and Sussex Medical School possible.
No less, I would like to thank my supervisor Dr Timothy Chevassut for allowing myself to work in his laboratory. Thank you very much for many inspiring and encouraging discussions and your great trust in my laboratorial work.
I would also like to thank Dr Helen Stewart who has always had a very patient explanation to each of my numerous questions.
Moreover, I am very grateful to Dr Andrew McGovern for support with the data analysis and to Dr Gillian Horne for guiding me in the laboratory.
I would also like to thank all the other individuals in Dr Chevassut's research group, especially Dr John Brewin, Miss Sophie Robinson and Dr Chia Lean Wea, as well as those of the BSMS Medical Research Building.
Abbreviations
ASB-PCR ADD
Allele-specific PCR with a blocking reagent Ataxia telangiectasia mutated — DNA methyltransferase 3A — DNA
methyltransferase 3-like BCR-ABL
bp
Breakpoint cluster region Abelson Base pair
CBFB Core-binding factor, beta subunit
CEBPA CGI CI cKIT
CCAAT/enhancer-binding protein α CpG Island
Confidence interval
Proto-oncogene receptor tyrosine kinase
CML Chronic myeloid leukaemia
(CN-)AML
CR Ct
(Cytogenetically normal) acute myeloid leukaemia
Complete remission Cycle threshold
dHPLC Denaturing high performance liquid
chromatography DMSO DNMT EFS Dimethyl sulfoxide DNA methyltransferase Event free survival
FCS Foetal calf serum
FLT3 FMS-like tyrosine kinase receptor-3
FISH Fluorescence In-Situ Hybridisation
HRM High Resolution Melting Analysis
HSCT Haematopoietic stem cell transplantation
IDH1 Isocitrate dehydrogenase 1
MDS MGB
Myelodysplastic syndrome Minor groove binder MGUS
MLL
Monoclonal gammopathy of unkown significance
leukaemia MPN MRD MYD88 NGS Myeloproliferative neoplasm Minimal residual disease
Myeloid differentiation primary response gene 88 Next-generation sequencing NPM NRAS OS p53 PBS (q)PCR PHD Nucleophosmin
Neuroblastoma Ras proto oncogene Overall survival
Tumour protein p53 Phosphate buffered saline
(Quantitative) polymerase chain reaction Polybromo homology
PML-RARA PNA
PML-Retinoic Acid Receptor α mutations Peptide nucleic acid
R Arginine
RAEB Refractory anaemia with excess blasts
RB1 Retinoblastoma protein
RCMD Refractory cytopenia with multilineage
dysplasia
RPMI-1640 Roswell Park Memorial Institute-1640
Medium
RUNX1 Runt-related transcription factor 1
WT1 Wilms tumour 1
Table of contents
I. Introduction ... 1
1.1 Acute myeloid leukaemia ... 1
1.2 Prognostic marker in AML ... 2
1.3 De novo methyltransferase 3A ... 3
1.4 DNMT3A mutations ... 4
1.5 DNMT3A mutations as prognostic marker in AML ... 7
1.6 Minimal residual disease detection ... 8
1.7 Methods to detect DNMT3A ... 9
1.8 Quantitative polymerase chain reaction ... 10
II. Aims ... 13
III. Material and methods ... 14
3.1 Material ... 14
3.1.1 Oligonucleotides ... 14
3.1.2 Enzymes ... 14
3.1.3 Cell lines ... 15
3.1.4 Reagents and kits ... 16
3.1.5 Equipment ... 17
3.1.6 Software ... 17
3.1.7 Databases ... 17
3.2 Methods ... 18
3.2.1 Cell culture ... 18
3.2.2 Preparation of patients' samples ... 18
3.2.3 DNA extraction ... 18
3.2.4 Serial dilutions ... 19
3.2.5 Polymerase chain reaction ... 19
3.2.6 PCR product purification ... 20
3.2.7 Restriction enzyme digestion ... 20
3.2.8 Gel electrophoresis ... 21
3.2.9 Quantitative polymerase chain reaction ... 21
3.2.10 Calculations ... 22
4.1 Differential restriction enzyme assay ... 25
4.1.1 Restriction enzyme digestion pattern ... 25
4.1.2 Restriction enzyme sensitivity ... 26
4.1.3 Cell lines OCI/AML-3 and KG-1 ... 27
4.1.4 Patients’ samples ... 28
4.2 Quantification of the mutation ... 28
4.2.1 Principle of relative quantification ... 28
4.2.2 Amplification efficiencies of qPCR primer pairs ... 29
4.2.3.1 Primer binding efficiencies of digested PCR product ... 31
4.2.3.2 Measuring the relative cutting efficiency ... 32
4.2.4 Calibration curve ... 32
4.2.5 Sensitivity of the MRD detection assay ... 33
4.2.6 Precision of qPCR replicates ... 34
4.2.7 Reproducibility ... 34
4.2.8 Patients’ samples ... 35
4.3 Sequencing ... 37
4.4 Clinical characteristics of the patients ... 38
4.4.1 Clinical details of all patients’ samples ... 38
4.4.2 Clinical outcome of the patients with DNMT3A R882 mutation ... 41
V. Discussion ... 42
5.1. Synopsis of principal findings ... 42
5.2. Evaluation of the strengths and limitations of the DNMT3A detection assays 42 5.2.1 Differential restriction enzyme assay ... 42
5.2.2 Choice of qPCR chemistry ... 43
5.2.3 Relative quantification using internal amplicons ... 43
5.2.4 Calculations ... 44
5.2.5 qPCR primer binding and amplification efficiencies ... 45
5.2.6 Calibration curve ... 45
5.2.7 Sensitivity and reproducibility ... 46
5.2.8 DNMT3A mutation status and clinical characteristics of the AML samples .... 46
5.5 Future research ... 55
VI. Summary ... 57
VII. References ... 60
VIII. List of illustrations ... 71
IX. Zusammenfassung ... 72
I. Introduction
1.1 Acute myeloid leukaemia:
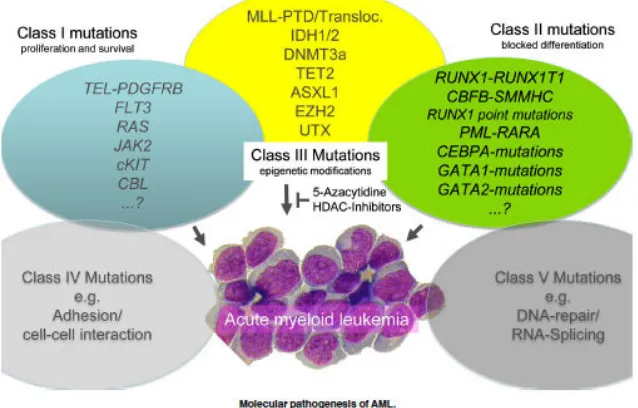
Acute myeloid leukaemia is a heterogeneous malignancy with clonal proliferation of haematopoietic precursor cells infiltrating in blood, bone marrow and other tissues. It represents the most common form of acute leukaemia in adults and occurs increasingly frequently with age. The median onset of AML is 65 years resulting in an incidence of 16.8 per 100,000 for individuals older than 65 years and 1.8 in those younger than 65 years (Howlader N, 2013; Hoffbrand AV & Moss PAH, 2011). More than 18,000 cases of AML are diagnosed annually in Europe with a five year relative survival rate of 19% (Visser O, et al. 2012).
Figure 1: Mutations contributing to the pathogenesis of AML (Reproduced from Thiede C, 2012)
1.2 Prognostic marker in AML:
Conventionally, AML cases were classified into three risk groups (favourable, intermediate and adverse) by morphologic features, flow cytometric examination and cytogenetic fluorescence in situ hybridisation (FISH) analysis but recently recurrent genetic alterations have been taken into consideration and were incorporated into the WHO classification of acute myeloid leukaemia (Vardiman JW et al., 2009; Godley LA, 2012).
In general, patients with AML with a favourable risk classification receive conventional chemotherapy whereas patients with an unfavourable risk classification are chosen for allogeneic haematopoietic stem cell transplantation (HSCT) (Martelli MP et al., 2013). However, the prognostic group encompassing most of the adult AML patients (40-50% of all AML cases) is cytogenetically normal AML (CN-AML), part of the intermediate risk group (Lin TL & Smith BD, 2011). Patients out of this risk group are difficult to assign to different treatment options because of the high variance of molecular subtypes and their highly differing treatment outcomes.
predictors, among them DNMT3A mutations, indicated improved risk stratification (Renneville A et al., 2014; Shivarov V et al., 2013, Patel JP et al., 2012; Shen Y et al., 2011).
1.3 De novo methyltransferase 3A:
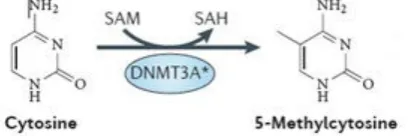
DNA methylation status as well as covalent histone modifications, chromatin remodelling functions and interfering RNA are epigenetic regulating mechanisms (Schoofs T & Mueller-Tidow C, 2011) and have an important impact on carcinogenesis (Munoz P et al., 2012). In particular aberrant changes in DNA methylation patterns are a hallmark of cancer cells (Yamashita Y et al., 2010). Recently, it has also been reported that DNA methylation has crucial influence on key transcription factors, like WT1 and RUNX1, during the development of myeloid progenitor cells (Rönnerblad M et al., 2014; Qu Y et al., 2014). Three different types of DNA methyltransferase enzymes have been classified: DNA methyltransferases (DNMTs) 3A and B which both mediate de novo methylation while in contrast DNMT1 mainly maintains methylation (Ribeiro AFT et al., 2012, Cagnetta A et al., 2014). DNMT3A has been shown to be repeatedly mutated in myeloid malignancies (Yan XJ et al., 2011; Ley TJ et al., 2010). This de novo methyltransferase 3A catalyses the addition of a methyl group donated from the cofactor S-Adenosyl methionine to the 5’-position of cytosine residues at CpG dinucleotide residues (known as CpG islands) in DNA (figure 2) which are located mainly in the promoter region of genes.
Figure 2: Enzymatic function of DNMT3A (adapted from: Shih AH et al., 2012)
In contrast, the global methylation status of AML cells outside CGI islands is mostly hypomethylated which might lead to increased genomic instability and contribute to the malignant process (Eriksson A et al., 2015; The Cancer Genome Atlas Research Network, 2013).
1.4 DNMT3A mutations:
Frequency and structure:
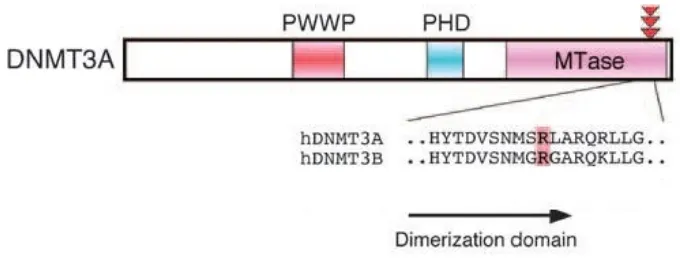
DNMT3A mutations occur in approximately 22% of adult AML patients and are especially common in cases with intermediate risk normal cytogenetic AML (up to 36%) (Ley TJ et al., 2010; Thiede C, 2012). The majority of the DNMT3A mutations (60-83%) affect codon R882 which is allocated in exon 23 in the catalytic domain of the DNMT3A gene (Ley TJ et al., 2010; Yamashita et al., 2011; Renneville A et al., 2012; Marcucci G et al., 2012; Ibrahem L et al., 2015). Figure 3 illustrates the structure of the DNMT3A gene: The elements of the regulatory region, namely the tetrapeptide PWWP domain and the polybromo homology (PHD) domain; and the methyltransferase (MTase) component which represents the catalytic region of the enzyme.
Figure 3: Structure of the DNMT3A gene, PWWP = proline-tryptophan-tryptophan-proline domain, PHD = polybromo homology domain, MTase = methyltransferase domain (Adapted from: Yamashita Y et al, 2010)
Characterisation of R882 mutations:
R882C mutation, a C-to-T transition leading to cysteine substitution and the R882S mutation, a C-to-T transversion resulting in serine substitution. They occur with different frequencies: 62-65% R882H, 24-36% R882C and 2-3% R882S of all R882 mutations (Ley TJ et al., 2010; Brewin JN et al., 2012; Gaidzik et al., 2013).
Effects of the mutation:
Most of the somatic DNMT3A mutations prevent the formation of active homotetramers and heterotetramers between DNMT3A and DNMT3L which serves as a coactivator of the functionally active enzyme (Eriksson A et al., 2015; Shih A et al., 2012).
The R882 mutation results in a decreased catalytic activity (50-80%) compared to wild type and a loss in DNA binding affinity (Yamashita Y et al., 2010; Russler-Germain DA et al., 2014).
Interestingly, the frequent R882H mutation does not appear to alter the methyltransferase activity when analysed as an in vitro mix of WT and R882H mutated enzyme. Yet, the coexpression of both proteins in mammalian cells results in loss of enzymatic function indicating that the R882H mutation causes haploinsufficiency in the sense of a dominant-negative effect on the WT protein (Stewart H, et al., 2015; Genovese G et al., 2014; Russler-Germain DA et al., 2014).
These findings are deduced from in vitro experiments and have recently been further analysed in in vivo studies: Loss of DNMT3A function in murine haematopoietic stem cells (HSC) impairs their differentiation and interferes with normal haematopoiesis which leads to the development of several lymphoid and myeloid malignancies. Those DNMT3A-knock-out mice have an aberrant methylome pattern and underline the preleukaemic function of the mutation (Mayle A, et al., 2015).
Furthermore, the methylation pattern in humans with CN-AML and DNMT3A mutations is different from those without the mutation: recent data reveals significant hypomethylation of the homeobox genes affecting embryogenesis as well as hematopoietic development and leukemogenesis (Qu Y et al., 2014).
as the known initiating event to M1-AML cases with normal cytogenetics and exomes of haematopoietic stem cells from healthy donors. Because of the pattern of DNMT3A mutations and co-occurring mutations like NPM1, IDH1, FLT3 and others DNMT3A mutations were thought to be initiating events in AML in cases with normal cytogenetics rather than random or background mutations in the hematopoietic stem cell and therefore contribute to AML pathogenesis as a “key initiating mutation” (Welch JS et al., 2012).
Further research groups provide evidence that DNMT3A mutations contribute to clonal expansion of haematopoietic stem or progenitor cells as a result of impaired differentiation and represent an initiating event and respectively act as an oncogene during the development of AML (Genovese G et al., 2014; Roy DM et al., 2014).
Moreover, DNMT3A mutations are considered as potential driver mutations because they seem to arise mutually exclusive to transcription-factor fusions that were previously acknowledged to advance leukaemia (Kihara R et al., 2014). The influence of the analysed mutation on clonal expansion is even more pronounced in relation to different age groups resulting in increasing percentages of leukaemia-associated genetic alterations in patients above 70 years of age (Xie M et al., 2014; Jaiswal S et al., 2014).
Recent data confirms the role of DNMT3A as a driver mutation in the specific case of clonal haematopoiesis and development in AML in patients with aplastic anaemia (Yoshizato T et al., 2015).
Clinical characterisation of patients with DNMT3A mutations:
Treatment options:
Aberrant DNA methylation is also the pharmacological target of inhibitors of DNA methyltransferases. The hypomethylating agent decitabine is already licensed as a first line therapy for the treatment of older AML patients who seem too frail to sustain standard induction chemotherapy (DiNardo CD et al., 2014; Ramos F et al., 2014). Elderly AML patients with a DNMT3A mutation have a significantly better response rate after treatment with decitabine than those without the mutation (Metzeler KH et al., 2012). However, there is also contradictory data showing the high-complexity between epigenetic mutations and hypomethylating drugs as well as the need for further studies (DiNardo CD et al., 2014). In terms of maintenance therapy a phase 1 b study demonstrated that lenalidomide which is beneficial in high-risk myelodysplastic syndrome in combination with azacitidine might control DNMT3A positive residual disease and therefore protect patients from clinical relapse (Wei A et al., 2015).
Another approach for induction therapy of DNMT3A carriers is the comparison of the treatment with idarubicin versus daunorubicin. This study conducted by LaRochelle O et al. (2011) indicates that patients with DNMT3A exon 23 mutations have better median disease free and overall survival rates than those without the mutation when treated with idarubicin. Both patient groups have similar results when treated with daunorubicin (LaRochelle O et al., 2011).
Furthermore, patients with DNMT3A mutations seem to have a better response and improved overall survival after induction chemotherapy with high-dose daunorubicin (cytarabin plus 90 mg daunorubicin/m2) in comparison to standard dose (cytarabin plus 45 mg daunorubicin/m2) than patients without the DNMT3A mutation (Patel JP et al., 2012).
1.5 DNMT3A mutations as prognostic marker in AML:
was absent. These findings were confirmed even when codon R882 in exon 23 alone was analysed as it contains most of the mutations within the DNMT3A gene (Ribeiro AFT et al., 2012; Ostronoff F et al., 2013).
In univariate and multivariate analyses DNMT3A mutation status was defined as an independent adverse prognostic factor for overall survival in the majority of patient subgroups above all in CN-AML patients (Renneville A et. al., 2014; Hou HA et al., 2013; Ribeiro AFT et al., 2012; Thol F et al., 2011). Kihara R et al. showed that the original European Leukemia Net risk stratification system for CN-AML could be improved by assigning patients with the DNMT3A mutation rather to the intermediate risk I group than to the favourable risk group (Kihara R et al., 2014; Dohner et al., 2010). In a recent meta-analysis examining 6377 AML patients including 1161 DNMT3A mutation carriers the mutation appeared to predict an adverse OS for various patients risk groups as well as in the total non-classified population. Apart from the favourable risk subgroup and the non-R882-DNMT3A mutant subgroup all other allocated patients were clearly stratified by DNMT3A prognostic status (Tie R et al., 2014).
Several studies showed that patients with DNMT3A mutations have a significantly shorter overall and disease-free survival, this appeared not to be an effect of a decreased rate of complete remission (CR), but reflected an increase in disease recurrence as CR rates were shown to be similar between DNMT3A mutant and DNMT3A wild type patients (Thiede C, 2012). In addition to that, AML patients with DNMT3A mutation suffered from higher relapse rates (Hou H et al., 2012).
1.6 Minimal residual disease detection:
assessment of response after chemotherapy and possible postremission procedures to evaluate the patient's individual risk of relapse (Buccisano F et al., 2012). Moreover, MRD levels could also be used as a relative end point to compare treatment efficiencies at any point during AML treatment (Paietta E, 2012). One of the main limitations of MRD detection is the lack of consistency of gene mutations during disease progression.
However, DNMT3A mutations appear to remain stable during AML disease evolution as several studies of sequential AML samples reveal. In these studies, AML patients with initially positive DNMT3A mutation status lacked the DNMT3A mutation at remission but regained the same mutation at disease relapse (Hou H-A et al., 2012; Pløn et al., 2014). Additionally, DNMT3A mutations seem to persist (or remain stable) from diagnosis to relapse and might induce other mutations, namely the FLT3-ITD mutation (Wakita S et al., 2012). In accordance with these observations, all patients in whom DNMT3A mutations were absent at initial diagnosis maintained this status at relapse or had mutations at low allele frequencies. These results indicate that the DNMT3A mutation could be applied as an effective biomarker for minimal residual disease (Hou H-A et al., 2012; Wakita S et al., 2012; Krönke et al., 2013; Pløn et al., 2014; Mancini M et al., 2015).
1.7 Methods to detect DNMT3A:
limitations as the accuracy of the assay is highly dependent on the resolution of the machine used (Wittwer CT, 2009).
Hitherto, although its high prognostic value, as has been demonstrated in 1.5, no simple screening test for detection of the DNMT3A mutation has been established yet. A fast determination of DNMT3A status could provide the attending physician with valuable information about potential treatment strategies and predict an individual outcome for the affected patient.
Furthermore, the current DNMT3A MRD tests do not supply results that are accurate enough to monitor patients post treatment on residual leukaemic cells harbouring the DNMT3A mutation.
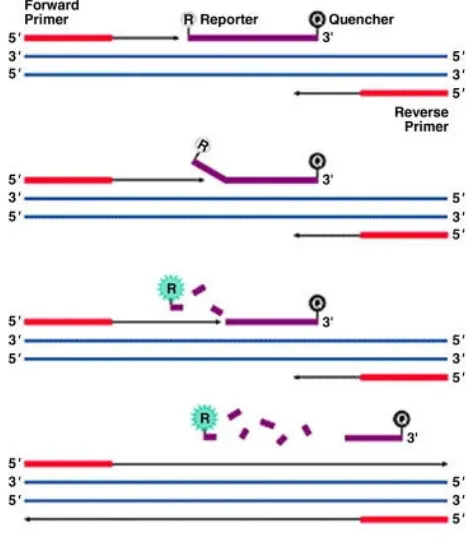
1.8 Quantitative polymerase chain reaction:
Quantitative polymerase chain reaction (qPCR) has been established as a reliable test for MRD detection for patients carrying genetic alterations with high sensitivities (depending on the target structure) (DiNardo CD & Luger SM, 2012).
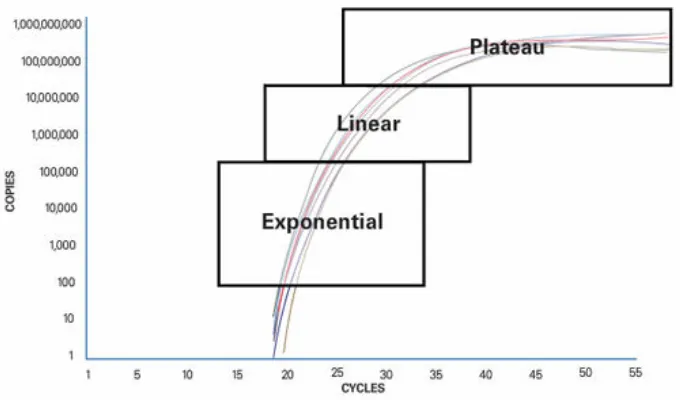
Quantitative PCR is based on the principle that detection of the PCR product is measured while the reaction still proceeds. It is therefore also called real-time PCR. qPCR has been developed from traditional PCR which can be divided up into 3 sections (figure 4):
1.: Exponential: During the exponential phase the PCR product doubles every cycle if the reaction has 100% efficiency because the reagents are available in abundance and the reaction’s kinetics optimal for amplification.
2.: Linear: The reaction slows down due to depletion of the reagents and the product is not duplicated at each cycle any more.
II. Aims
On the basis of the reasons argued in the introduction, our aim was to establish two assays for detection of DNMT3A mutations:
Firstly, we sought to develop a rapid screening test using differential restriction digestion of PCR amplified DNA products for reliably detecting the presence of an R882 mutation of the DNMT3A gene and determining the most common types of the R882 mutations within a few hours of bone marrow aspiration.
Secondly, we aimed to establish a method for detecting and quantifying low copy numbers of DNMT3A R882 mutations for the purpose of monitoring minimal residual disease in AML patients.
III. Material and methods
3.1 Material:
3.1.1 Oligonucleotides:
PCR:
Forward Primer:
5'-GTGATCTGAGTGCCGGGTTG-3'…………Sigma-Aldrich Company Ltd., Dorset, UK Reverse Primer:
5'-TCTCTCCATCCTCATGTTCTTG-3'…………Sigma-Aldrich Company Ltd., Dorset, UK
qPCR:
Forward qPCR primer “DNMT3A green”: 5’-ACAGAAGATTCGGCAGAACTAAG-3’ Reverse qPCR primer “DNMT3A green”: 5’-CGGAGGACCAGCAGCCA-3’
Forward qPCR primer “DNMT3A yellow”: 5’-CCAGGGTATTTGGTTTCCCAGT-3’ Reverse qPCR primer “DNMT3A yellow”: 5’-ATGACTGGCACGCTCCATG-3’ Forward qPCR primer “DNMT3A blue”: 5’-CACCTCTTCGCTCCGCTG-3’
Reverse qPCR primer “DNMT3A blue”: 5’-TTTTTGTTTGTTTGTTTAACTTTGTGT-3’ All qPCR primer pairs were purchased from PrimerDesign Ltd., Southampton, UK.
3.1.2 Enzymes:
3.1.3 Cell lines:
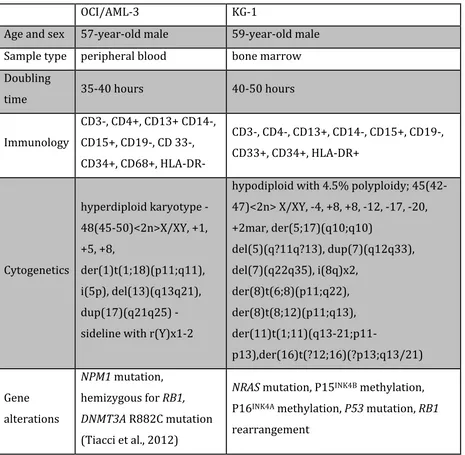
OCI/AML-3 cell line………Leibniz Institute DSMZ, Braunschweig, Germany KG-1 cell line……….American Tissue Culture Collection, Teddington, UK Cell line characteristics: Following information was taken out of the Guide to Leukemia-Lymphoma Cell Lines (Drexler HG, 2010).
OCI/AML-‐3 KG-‐1
Age and sex 57-‐year-‐old male 59-‐year-‐old male
Sample type peripheral blood bone marrow
Doubling
time 35-‐40 hours 40-‐50 hours
Immunology
CD3-‐, CD4+, CD13+ CD14-‐,
CD15+, CD19-‐, CD 33-‐,
CD34+, CD68+, HLA-‐DR-‐
CD3-‐, CD4-‐, CD13+, CD14-‐, CD15+, CD19-‐,
CD33+, CD34+, HLA-‐DR+
Cytogenetics
hyperdiploid karyotype -‐
48(45-‐50)<2n>X/XY, +1,
+5, +8,
der(1)t(1;18)(p11;q11),
i(5p), del(13)(q13q21),
dup(17)(q21q25) -‐
sideline with r(Y)x1-‐2
hypodiploid with 4.5% polyploidy; 45(42-‐
47)<2n> X/XY, -‐4, +8, +8, -‐12, -‐17, -‐20,
+2mar, der(5;17)(q10;q10)
del(5)(q?11q?13), dup(7)(q12q33),
del(7)(q22q35), i(8q)x2,
der(8)t(6;8)(p11;q22),
der(8)t(8;12)(p11;q13),
der(11)t(1;11)(q13-‐21;p11-‐
p13),der(16)t(?12;16)(?p13;q13/21)
Gene
alterations
NPM1 mutation,
hemizygous for RB1,
DNMT3A R882C mutation
(Tiacci et al., 2012)
NRAS mutation, P15INK4B methylation,
P16INK4A methylation, P53 mutation, RB1
rearrangement
3.1.4 Reagents and kits:
3.1.5 Equipment:
Gene Amp PCR System 9700………Applied Biosystems, Carlsbad, USA Power Pack 200………..Bio-Rad Laboratories Ltd., Hemel Hempstead, UK Nanodrop 1000 Spectrophotometer………...Thermo Scientific, Loughborough, UK Syngene Bio Imaging Gene Flash……….Synoptics Ltd., Cambridge, UK Stratagene Mx 3005P qPCR System……….Agilent Technologies, Cheshire, UK
3.1.6 Software:
Stratagene Mx3005P Software version 4.10………..Agilent Technologies, Cheshire, UK Nanodrop 1000 Software version 3.7.0……….Thermo Scientific, Loughborough, UK Minitab Statistical Software version 16………..Minitab Ltd., Coventry, UK
3.1.7 Databases:
3.2 Methods:
3.2.1 Cell culture:
The leukaemic cell lines OCI/AML-3 and KG-1 were cultured in a medium containing RPMI 1640 supplemented with 10% foetal calf serum, 100mM L-glutamine, penicillin (100 IU/ml) and streptomycin (100 µg/ml). The cells were maintained at 37° with 5% CO2 in a humidified incubator and passaged at the ratio of 1:3 every three days (Stewart HJ et al., 2011).
3.2.2 Preparation of patients' samples:
The bone marrow aspirate was diluted at the ratio 1:1 with PBS, then pipetted onto Histopaque 1077 and centrifuged for 20 minutes at 450 x g. Next, the white cell layer was removed and placed into a 15 ml tube and washed with 10 ml PBS. The sample was centrifuged for 15 minutes at 250 x g. After removing the supernatant, the cell pellet was resuspended in 1ml PBS. Unless the cells were used immediately after the preparation, they were diluted 1:1 with cell freezing medium containing 20%v/v DMSO, 40%v/v FCS in Iscove’s modified Dulbecco’s medium, frozen and stored in liquid nitrogen (Stewart et al., 2011). All patients agreed by written informed consent to analysis of their bone marrow or peripheral blood samples and the Brighton East Research Ethics Commission gave permission to perform the research.
3.2.3 DNA extraction:
DNA extraction of OCI/AML-3 and KG-1 cells as well as patients' blood mononuclear cells was performed using the QIAGEN DNeasy Blood & Tissue kit (Qiagen, Crawley, UK) according to the manufacturer’s instructions.
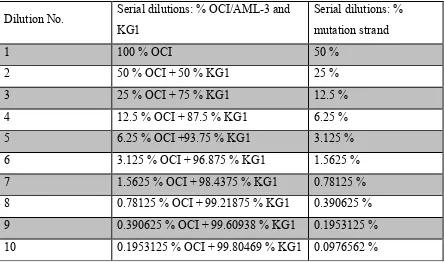
3.2.4 Serial dilutions:
The OCI/AML-3 DNA concentration and KG-1 DNA concentration were both adjusted to 84 ng/µl. An initial dilution consisting of 100 µl OCI/AML-3 and 100 µl KG-1 DNA was set up. 50 µl of this assay was taken out and mixed in a fresh Eppendorf tube with 50 µl of KG-1 DNA. This step was repeated 8 times. Finally, 10 different dilutions were completed (Table 2).
Table 2: Serial dilutions of OCI/AML-3 in KG-1 DNA
3.2.5 Polymerase chain reaction:
Polymerase chain reaction was performed to amplify the relevant region of the DNMT3A gene including codon R882. A PCR assay of 50 µl in total contained the following elements: 25 µl Ampli Taq Gold Master mix, 20 – 22 µl RNAse and DNAse free water, 1 – 3 µl (100 – 200 ng) genomic DNA, 1 µl forward primer and 1 µl reverse primer. The reaction settings were as described: Denaturation at 94°C for 30 seconds, annealing at 60°C for 30 seconds, Dilution No. Serial dilutions: % OCI/AML-3 and
KG1
Serial dilutions: % mutation strand
1 100 % OCI 50 %
2 50 % OCI + 50 % KG1 25 %
3 25 % OCI + 75 % KG1 12.5 %
4 12.5 % OCI + 87.5 % KG1 6.25 %
5 6.25 % OCI +93.75 % KG1 3.125 %
6 3.125 % OCI + 96.875 % KG1 1.5625 %
7 1.5625 % OCI + 98.4375 % KG1 0.78125 %
8 0.78125 % OCI + 99.21875 % KG1 0.390625 %
9 0.390625 % OCI + 99.60938 % KG1 0.1953125 %
3.2.6 PCR product purification:
The PCR product was purified using the QIAquick® PCR Purification Kit according to the manufacturer’s instructions except for the last step which was elution of DNA in 50 µl nuclease-free water instead of buffer.
3.2.7 Restriction enzyme digestion:
The purified PCR product was digested by two different rapid-digestion restriction enzymes: AciI and AluI. AciI specifically recognises the 4 base-pair sequence 5'-CCGC-'3 (Polisson and Morgan, 1990), cleaving between the two cytosine residues on the forward strand and between the guanine and cytosine on the reverse strand (Figure 6).
Figure 6: AciI restriction site
AluI recognises the nucleotide sequence 5'-AGCT-3', respectively 3'-TCGA-5' and cuts between the guanine and cytosine residue resulting in blunt ends both sides of the digested fragment (Figure 7).
Figure 7: AluI restriction site
Both AciI and AluI were advanced restriction enzymes for rapid DNA digestion enabling to completely digest 1µg of lambda DNA within 5 minutes. According to the manufacturer, no degradation of 1µg of lambda DNA as a result of nuclease contamination or star activity (reduced enzyme specificity due to prolonged incubation) after prolonged incubation for 4 hours was detected (Product Information, Thermo Scientific).
Both enzyme assays were set up using to the following protocol: PCR product: 10µl
RNAse free water: 7µl 10X FastDigest buffer: 2µl FastDigest enzyme: 1µl
3.2.8 Gel electrophoresis:
After the restriction enzyme digestion the samples were run out on a 1.5% agarose gel and stained with 10mg/ml ethidium bromide to confirm complete digestion. The gel was then looked at under a UV transilluminator allowing the analysis of size and molecular weight of the digested DNA fragments.
3.2.9 Quantitative polymerase chain reaction:
The digested samples were diluted serially in nuclease-free water to a final concentration of 1:1000. Quantitative PCR was performed with following primer pairs:
TTCTGCTGGGTTGTGAAACTCTAGGCAGTGATGACCTTACTACCTTTAAGGTCACAGAAACC AGCACAGTGCCTGGCACATGGTTGGTGATCTGAGTGCCGGGTTGTTTATAAAGGACAGAAGA
TTCGGCAGAACTAAGCAGGCGTCAGAGGAGTTGGTGGGTGTGAGTGCCCCTGTCCCTGCACT TCGGGTGGCTGCTGGTCCTCCGGGTCCTGCTGTGTGGTTAGACGGCTTCCGGGCAGCCTGGT
CTGGCCAGCACTCACCCTGCCCTCTCTGCCTTTTCTCCCCCAGGGTATTTGGTTTCCCAGTC CACTATACTGACGTCTCCAACATGAGCCGCTTGGCGAGGCAGAGACTGCTGGGCCGGTCATG
GAGCGTGCCAGTCATCCGCCACCTCTTCGCTCCGCTGAAGGAGTATTTTGCGTGTGTGTAAG GGACATGGGGGCAAACTGAGGTAGCGACACAAAGTTAAACAAACAAACAAAAAACACAAAAC
ATAATAAAACACCAAGAACATGAGGATGGAGAGAAGTATCAGCACCCAGAAGAGAAAAAGGA ATTTAAAACAAAAACCACAGAGGCGGAAATACCGGAGGGCTTTGCCTTGCGAAAAGGGTTGG
ACATCATCTC
CCGC = AciI site (destroyed by both R882H and R882C mutations)
CCGC = further AciI sites
GTGATCTGAGTGCCGGGTTG = forward primer sequence
TCTCTCCATCCTCATGTTCTT = reverse primer sequence
CCAGGGTATTTGGTTTCCCAGT = forward qPCR primer “DNMT3A R882
codon”
CATGGAGCGTGCCAGTCAT = reverse qPCR primer “DNMT3A R882 codon”
CACCTCTTCGCTCCGCTG = forward qPCR primer “DNMT3A digestion
control”
ACACAAAGTTAAACAAACAAACAAAAA =reverse qPCR primer “DNMT3A
digestion control”
ACAGAAGATTCGGCAGAACTAAG = forward qPCR primer “DNMT3A loading control”
Figure 8 shows the DNA sequence of the DNMT3A gene up- and downstream from codon R882 flanked by the outer standard PCR primer pair. Within this amplicon 3 qPCR primer pairs were placed to produce three different fragments with and without an AciI restriction site (a 4 base pair sequence CCGC as it occurred at the R882 hotspot). The first qPCR primer pair served as an internal DNA loading control because it amplified up a fragment without an AciI restriction site. The second primer pair amplified the region containing the AciI restriction site which matched the R882 hotspot. This restriction site was destroyed if a DNMT3A R882 mutation occurred. The third primer pair generated an amplicon containing a further AciI restriction site that was used as a relative digestion control.
The thermal profile of each qPCR run was as follows: Enzyme activation for 10 minutes at 95°C, than denaturation for 15 seconds at 95°C and data collection for 60 seconds at 60°C. The last two steps were repeated for 50 times.
Additionally, every run included DNA from OCI/AML-3 cell line which harbours a heterozygous DNMT3A R882C mutation as a positive control and KG-1 as a negative control.
3.2.10 Calculations:
Based on this, the mutational proportion of a sample could be calculated: The loading control fragment which was not cut by AciI was used to assess the amount of DNA present in each sample. The relative abundance of the R882 codon-containing fragment was then used to quantify the amount of mutant present in each sample (equation 1).
m
c
y
g
M
=
(
γ
−
)
(1)
M = proportion of mutants present in the sample
γ = correction factor to adjust for differential primer binding after mock-digestion (see also 4.2.4)
g = abundance of loading control fragments
y = abundance of mutant fragments
m = gradient of the calibration curve
The correction factor γ was calculated from mock-digestion experiments (see also 4. 2. 3. 1) and represented what the amount of sample should be multiplied by to equal the amount of loading control for an AciI-digested sample as the primer binding efficiency was altered after digestion. g and y were calculated by equation number 2 and 3 accounting for the amplification efficiencies of each primer pair as measured in a separate experiment (4. 2. 2): g = 1.8533Ct of loading control amplicon (2)
y = 1.8538Ct of R882 containing amplicon
(3)
m and c in equation number 1 were given by the slope of the calibration curve given by the equation of a line (equation no. 4) (for further information on the calibration curve see 4. 2. 4):
y = mx + c (4)
with m = 0.5596 and c = 0.0328.
Furthermore, the cutting efficiency of the restriction enzyme AciI was calculated by relating the relative abundance of the loading control amplicon to the digestion control amplicon and carried out as an internal quality control for each sample tested (equation number 5).
1.7897
1.8533
CtDC
CtLC
C
=
(5)C = Relative Cutting Efficiency
3.2.11 Sanger sequencing:
To confirm the generated results externally all samples were sent to Eurofins MWG Operon, Ebersberg, Germany and sequenced using the company’s value read tube service. Therefore, 15 µl of purified PCR product per sample was analysed by Sanger sequencing.
IV. Results
4.1 Differential restriction enzyme assay:
4.1.1 Restriction enzyme digestion pattern:
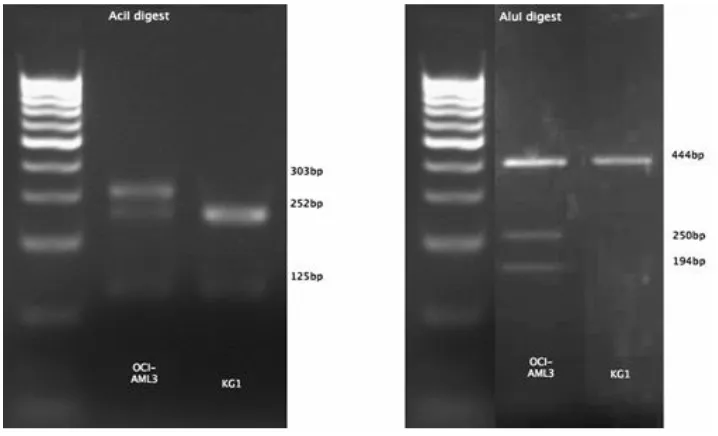
The DNMT3A wild type PCR product contained an AciI recognition site (CCGC) at codon R882 and two other sites further downstream as illustrated in Figure 9. Therefore, AciI digestion and subsequent agarose gel electrophoresis showed one major fragment of 252bp length and three smaller fragments measuring 125bp, 51bp and 16bp which served as a control for complete digestion.
GCCTGGCACATGGTTGGTGATCTGAGTGCCGGGTTGTTTATAAAGGACAGAAGATTCGGCAG
AACTAAGCAGGCGTCAGAGGAGTTGGTGGGTGTGAGTGCCCCTGTCCCTGCACTTCGGGTGG CTGCTGGTCCTCCGGGTCCTGCTGTGTGGTTAGACGGCTTCCGGGCAGCCTGGTCTGGCCAG CACTCACCCTGCCCTCTCTGCCTTTTCTCCCCCAGGGTATTTGGTTTCCCAGTCCACTATAC
TGACGTCTCCAACATGAGCCGCTTGGCGAGGCAGAGACTGCTGGGCCGGTCATGGAGCGTGC
CAGTCATCCGCCACCTCTTCGCTCCGCTGAAGGAGTATTTTGCGTGTGTGTAAGGGACATGG GGGCAAACTGAGGTAGCGACACAAAGTTAAACAAACAAACAAAAAACACAAAACATAATAAA
ACACCAAGAACATGAGGATGGAGAGAAGTATCAGCACCCAGAAGAGAAAAAGGAAT
CCGC = AciI site/codon R882
CCGC = AciI site/downstream cutting controls
AGCT = AluI site
GTGATCTGAGTGCCGGGTTG = forward primer sequence
TCTCTCCATCCTCATGTTCTT = reverse primer sequence
Figure 9:DNMT3A sequence flanking the R882 codon
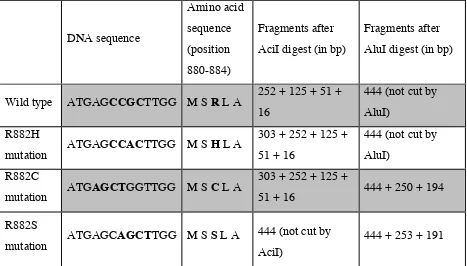
In the case of the R882C and R882S mutation an AluI site (AGCT) was generated resulting in bands of 250 bp and 253 bp lengths respectively. DNMT3A wild type PCR product was not cut by AluI and displayed a 444 bp band on the gel (table 3).
Table 3 (adapted from Brewin JN et al., 2012) (All mutations were considered as heterozygous).
4.1.2 Restriction enzyme sensitivity:
To determine the sensitivity of the restriction enzyme AciI heterozygous mutant R882C DNA from the OCI/AML-3 cell line was serially diluted with wild type DNA from the KG-1 cell line in the following ratios: 50%, 25%, 12.5%, 5% and 0.5%. Following this, PCR amplification was performed as described in 3. 2. 4 using all dilutions and pure wild type DNA. In subsequent gel electrophoresis the presence of the additional 302 bp band in the samples 50%, 25%, 12.5% and 5% proved that AciI could detect the mutation at sensitivity of at least 5% mutant to wild type copy number (figure 10) (Brewin JN et al., 2012).
DNA sequence Amino acid sequence (position 880-884) Fragments after AciI digest (in bp)
Fragments after AluI digest (in bp)
Wild type ATGAGCCGCTTGG M S R L A 252 + 125 + 51 + 16
444 (not cut by AluI)
R882H
mutation ATGAGCCACTTGG M S H L A
303 + 252 + 125 + 51 + 16
444 (not cut by AluI)
R882C
mutation ATGAGCTGGTTGG M S C L A
303 + 252 + 125 +
51 + 16 444 + 250 + 194
R882S
mutation ATGAGCAGCTTGG M S S L A
444 (not cut by AciI)
Figure 10: AciI sensitivity for DNMT3A R882C mutated DNA (Reproduced from Brewin JN et al., 2012)
4.1.3 Cell lines OCI/AML-3 and KG-1:
OCI/AML-3 R882C mutated PCR product and KG-1 wild type PCR product were used as a positive and negative control respectively and run aside the unknown samples in each experiment (figure 11).
4.1.4 Patients’ samples:
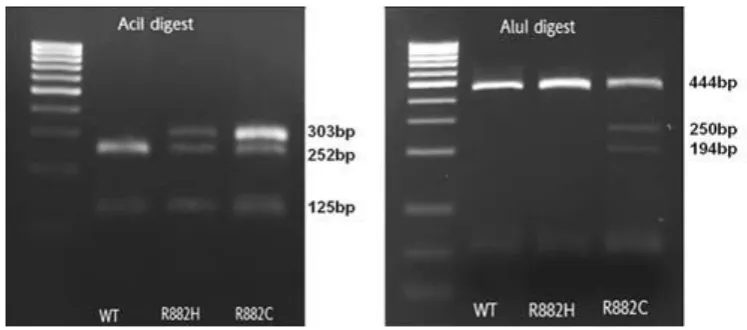
42 AML patients’ samples were screened in total (table 6 in chapter 4.4.1.). 39 of those were found to be DNMT3A negative, 2 DNMT3A R882H positive and 1 R882C positive. Figure 12 illustrates one exemplary negative sample (WT) and the R882H and R882C mutated samples out of the AML patients' samples pool. The AciI digest resulted in complete digestion of the wild type and displayed 252 bp and 125 bp, the bands of 125 bp and 51 bp are not visible on figure 12. Both the R882C and R882H mutation lead to incomplete digestion with an additional band at 303 bp (figure 12). AluI digestion allowed differentiation between the R882C and R882H mutation and confirmed the presence of the R882C mutation demonstrated by two bands at 250 bp and 194 bp. Furthermore, 6 samples from patients suffering from other haematological diseases (mostly myelodysplastic and myeloproliferative syndromes) were tested. The presence of the DNMT3A mutation was excluded in all those 6 haematological non-AML samples.
Figure 12: Differential restriction enzyme digestion of PCR product of DNMT3A wild type (WT), R882H and R882C DNMT3A mutated DNA (Reproduced from Brewin JN et al., 2012)
4.2 Quantification of the mutation:
4.2.1 Principle of relative quantification:
of evaluating the detection threshold for the R882 mutation. The patients’ samples to be analysed were then calculated by correlating the abundances of three independent amplicons flanking the R882 codon with the slope of the calibration curve (3. 2. 10).
4.2.2 Amplification efficiencies of qPCR primer pairs:
To test the amplification efficiency of each double dye (Taqman© style) qPCR primer pair a 6-log serial dilution of OCI/AML-3 PCR product in nuclease-free water was made at the ratios of 10-1, 10-2, 10-3, 10-4, 10-5 and 10-6 and amplified using all three primer pairs.
Based on this, Ct values of the dilutions 10-1 - 10-6 were used for measurement of the primer amplification efficiency using the Ct slope method (Schmittgen & Livak, 2008). Therefore, the obtained Ct values were plotted against the logarithm of the corresponding PCR product dilution (figure 13). Amplification efficiencies were then calculated from the slope of these graphs according to the following equation (with Ex representing the efficiency):
Ex = 10
(-1/slope)
– 1 (6)
For the loading control primer pair the slope of the line was – 3.7321 which lead to following calculations:
Ex = 10
(-1/-3.7321)
– 1 (7) = 0.8533 or 85.33%
4.2.3.1 Primer binding efficiencies of digested PCR product:
The primer binding qualities and effects on Ct values after AciI digestion of the PCR product were tested. Therefore, KG-1 wild type PCR product was digested according to the protocol (3. 2. 7.) and in a second assay mock-digested (all enzyme buffers added, only difference: no enzyme added). These two assays were then amplified by qPCR as described in 3. 2. 10 and following Ct values were measured:
KG-1, Mock-Digestion Loading control R882 codon amplicon Digestion
control % Mutation
% Relative Cutting
Ct Replicate 1 17.01 16.95 17.99 - -
Ct Replicate 2 16.76 16.93 17.75 - -
Ct Replicate 3 17 17 17.89 - -
Ct Replicate 4 16.81 16.94 17.77 - -
Ct Replicate 5 16.48 16.94 17.68 - -
Mean 16.81 16.95 17.82 - -
KG-1, AciI-Digestion Loading control R882 amplicon Digestion
control % Mutation
% Relative Cutting
Ct Replicate 1 18.15 23.63 22.46 0.11 95.11
Ct Replicate 2 17.82 23.62 22.57 -0.60 97.93
Ct Replicate 3 17.67 23.56 22.53 -0.77 98.51
Ct Replicate 4 17.55 23.44 22.57 -0.77 99.28
Ct Replicate 5 17.66 23.41 22.62 -0.50 99.00
Mean 17.77 23.53 22.55 -0.51 97.96
Standard deviation of the mean
0.16 0.75
Table 4: Ct values of qPCR primer binding efficiency experiments
4.2.3.2 Measuring the relative cutting efficiency:
The relative digestion efficiency was measured by comparing the Ct of the digestion control amplicon of AciI-digested DNMT3A KG-1 against the Ct of the digestion control amplicon of the mock-digested KG-1 sample (table 4). As the patient samples were very limited it was not possible to run a mock-digestion control for each sample. However, the mean of the Ct values for the mock-digested digestion control and the mean of the Ct values for AciI-digested loading control on KG-1 PCR product (table 4) were very much alike (difference of 0.05 Ct values), therefore it was considered as valid to estimate the cutting efficiency on the difference in Cts of the digestion control and the loading control for each AciI digested patient sample.
4.2.4 Calibration curve:
The calibration curve was based on a qPCR experiment generating multiple amplicons of a serial dilution series of OCI/AML-3 DNA in wild type/KG-1 DNA at the following ratios: Dilution
No. Serial dilutions % OCI/AML-3
Serial dilutions % mutation strand
1 100 % OCI 50 %
2 50 % OCI + 50 % KG-1 25 %
3 25 % OCI + 75 % KG-1 12.5 %
4 12.5 % OCI + 87.5 % KG-1 6.25 %
5 6.25 % OCI +93.75 % KG-1 3.125 %
6 3.125 % OCI + 96.875 % KG-1 1.5625 % 7 1.5625 % OCI + 98.4375 % KG-1 0.78125 % 8 0.78125 % OCI + 99.21875 % KG-1 0.390625 %
9 0% OCI + 100 % KG-1 0 %
Table 5: Dilution series of OCI/AML-3 in KG-1 DNA
The y axis represents the experimentally detected/calculated proportion of mutants whereas the x axis symbolises the proportion of mutant cells in the dilution samples. In other words, the graph depicts the relationship of the detected proportion and the actual proportion of mutant percentage in the samples and contains errors bars of 2% which equalises to 1% mutant DNA.
Figure 14: Calibration curve (Reproduced from Bisling KE et al., 2013)
4.2.5 Sensitivity of the MRD detection assay:
The sensitivity of the MRD detection assay was determined by the calibration curve using the OCI/AML-3 dilutions as mentioned above. The lowest concentration of mutant in wild type DNA that could still be amplified and detected was 0.78% of OCI/AML-3 R882C mutant DNA in KG-1 wild type DNA. Further dilutions containing 0.39% and 0.19% of OCI/AML-3 DNA could not be reliably amplified and detected.
4.2.6 Precision of qPCR replicates:
A minimum of two technical qPCR replicates was performed for each AML sample. To test the precision of these replicates mean Ct values were calculated and plotted against the minimal and maximal replicates (Figure 15). In guidelines on MRD analysis Van der Velden and colleagues (2003) suggest that the variation in Ct values with a mean of below 36 should not vary more than 1.5. In this project most of the qPCR replicates are within the appropriate range as demonstrated in figure 15.
Figure 15: Experimental variation range of the qPCR replicates
4.2.7 Reproducibility:
4.2.8 Patients’ samples:
4.3 Sequencing:
The mutational status of all analysed patients was confirmed by Sanger sequencing. The detected mutations (two R882H mutations, one R882C mutation) were consistent with the sequencing results. Furthermore, all negative samples were confirmed to lack the DNMT3A R882 mutation.
Figure 17:Sequencing results (Reproduced from Bisling KE et al., 2013)
4.4 Clinical characteristics of the patients:
4.4.1 Clinical details of all patients’ samples:
42 AML and 6 MPN/MDS samples were screened using the rapid screening test. 19 AML samples were further analysed with the MRD detection assay. Table 6 and 7 summarise the clinical characteristics including age, sex, percentage of bone marrow blasts, the sample’s origin, type of AML, karyotype and the allocated risk status of the AML and MPN/MDS samples.
Table 6: Clinical characteristics of the 42 AML samples. N/A means information not available, ± values are means plus/minus standard deviation of the mean; BM = Bone marrow, PB = Peripheral blood, risk status was stratified according to the Cancer and Leukemia Group B (CALGB 8461) (Byrd JC et al., 2002)
Variable AML samples (N=42)
Age at time of bone marrow biopsy – yrs. 64.2 ± 11.2, 1 N/A
Male sex – no. (%) 21 (53%), 2 N/A
Bone marrow blasts– (%) 41.8 ± 30.6, 12 N/A Origin of sample – BM/PB 35: BM, 6: PB, 1 N/A
Type of AML – no. (%): 1 N/A
- De Novo AML 27 (64%)
- Secondary AML 10 (24%)
- Relapsed AML 4 (10%)
Normal karyotype – no. (%) 23 (55%)
Risk status – no. (%):
- Favourable 1 (2.4%)
- Intermediate 27 (64.3%)
- Adverse 4 (9.5%)
Other malignant diseases:
The following non-AML bone marrow samples were screened because the DNMT3A mutation was not only identified in patients with DNMT3A but also in cases with myelodysplastic syndromes and myeloproliferative neoplasms (Stegelmann F et al., 2011; Walter MJ et al., 2011).
Age
(years) Sex Disease
Further details
BSMS 14 47 N/A Polycythaemia JAK 2 pos.
BSMS 28 63 M Monoclonal gammopathy of undetermined significance
BSMS 53 73 F Chronic myeloid leukaemia BCR-ABL
BSMS 66 64 F Refractory anaemia with excess blasts type 2 Blasts: 12% BSMS 88 68 M Refractory cytopenia with multilineage
dysplasia JAK 2 pos.
BSMS 90 76 M Refractory anaemia with excess blasts Blasts: 22%
Table 7: Diagnostic and cytogenetic details of the 6 haematologic non-AML samples that were tested for the DNMT3A mutation
Comparison of DNMT3A R882 mutation versus DNMT3A R882 wild type:
Variable DNMT3A R882
Wild type (N=39)
DNMT3A R882
Mutation (N=3) p Value Median age – in yrs. (range) 66.00 (23-82) 78.00 (76-80) [1] 0.0736٭
Male sex – no. (%) 19 (50) [1] 2 (100) [1] 0.4885†
Median bone marrow blast count –
in % (range) 30.8 (1-98) [11] 58.0 (17-99) [1] 0.3827٭
Type of AML – no. (%): [3]
- De Novo AML
26 (66.67) 2 (66.67) 1†
- Secondary AML
6 (15.38) 1 (33.33) 0.43†
- Relapsed AML
4 (10.26) 0 1†
Normal karyotype – no. (%) 21 (53.85) 2 (66.67) Risk status – no. (%):
- Favourable
1 (2.6) 0 1†
- Intermediate
24 (61.5) 3 (100) 0.5414†
- Adverse
4 (10.3) 0 1†
- Indeterminate
10 (25.6) 0 1†
Table 8: Numbers in [] brackets indicate how many patients didn't have appropriate values available and were omitted from statistical analysis.٭ p values were calculated with Mann Whitney U test for the comparison of DNMT3A wild type with DNMT3A R882 mutation. † p values were calculated using the Fisher exact test for the comparison between DNMT3A R882 wild type and DNMT3A R882 mutation.
4.4.2 Clinical outcome of the patients with DNMT3A R882 mutation:
The two patients harbouring the DNMT3A R882H mutation are referred to as BSMS 33 and BSMS 85: BSMS 33 was a 76-year-old male patient harbouring a deletion of the long arm of chromosome 5 (del(5)(q13q33)) which was identified at the time of initial diagnosis. Deletion of the long arm of chromosome 5 is a common monosomal karyotype in acute myeloid leukaemia and myeloprofilerative disease and is associated with an extremely unfavourable prognosis in AML patients (Breems DA, Van Putten WLJ, & Löwenberg B, 2013). He had a blast count of 99% at initial diagnosis and was positive for the FLT3-ITD mutation. The co-occurrence of the NPM mutation as well as the CBFB or MLL gene rearrangement was excluded. In this project, the DNMT3A R882H mutation within his genome was quantified as 71.1 ± 3.3% of total cells (or 35.55 ± 1.65% mutant allele frequency).
BSMS 85 was also a male patient, aged 80 years, suffering from secondary AML as a progression of MDS with normal cytogenetics. He was allocated to the intermediate risk group (risk group allocation following indications of the Cancer and Leukemia Group B (CALGB 8461), Byrd JC et al., 2002) and he did not have a FLT3-ITD or NPM mutation. They both received 2 cycles of intensive chemotherapy consisting of Cytarabine as a continuous infusion for seven days plus Daunorubicin on days one until three. Both patients received morphological response to chemotherapy but an incomplete blast recovery and relapsed quickly post treatment. BSMS 33 survived for 7 months, BSMS 85 for 8 months after initial diagnosis.
V. Discussion
5.1. Synopsis of principal findings:
In this chapter the methodology and principal findings of both DNMT3A mutation detection assays will be argued and compared to other techniques. Briefly, genomic DNA was extracted from AML samples, PCR amplified and analysed by a rapid differential restriction enzyme digestion assay. By differentiating between two specific digestion enzyme patterns and confirmation through comparison with control cell line OCI/AML-3, three cases of DNMT3A R882 mutations could be identified. Two R882H and one R882C mutation were detected within the pool of 42 AML samples. In order to detect minimal residual disease with low copy numbers of DNMT3A mutations, the test was further expanded through quantitative PCR allowing quantification of the mutational proportion. A subset of 22 samples were further analysed using this highly sensitive test. The two R882H mutations could be confirmed and were calculated as 97.6% and 71.1% of total cells. However, DNMT3A R882 mutations were not present in any of the other 20 samples. The clinical details of the patients harbouring the DNMT3A mutation were examined and compared to the patients that didn’t show the mutation but no statistically significant differences between both groups were recognised.
5.2. Evaluation of the strengths and limitations of the DNMT3A detection assays:
5.2.1 Differential restriction enzyme assay:
On the other hand, a great disadvantage is the risk of potential incomplete digestion, hence the danger of falsely predicting the absence of the mutation. Normally, complete digestion should be confirmed by the two smaller fragments (16 bp and 51 bp) but it can be difficult to visualise smaller bands on agarose gels.
A further limitation is that the test doesn't allow a differentiation between R882C and R882S mutations as it is not possible to distinguish a band with a 3 bp difference on a standard agarose gel. However, as the subtypes of the DNMT3A R882 mutation are rather of academic interest than of clinical relevance, this disadvantage is acceptable.
Moreover, although each step of the method is fast and simple post PCR processing can make it fairly laborious.
Another disadvantage is that the AciI enzyme digests the DNA leaving cohesive ends which could re-ligate if over digestion occurs.
5.2.2 Choice of qPCR chemistry:
Several different types of qPCR detection are available: The most common qPCR chemistry methods are Taqman©, SYBR Green, Molecular Beacons and MGB (3′-Minor groove binder-DNA) probes (Forlenza M et al., 2012). We chose Taqman© style double-dye probes because they provide precise results while being very cost effective. The only qPCR probe that is lower in costs is SYBR green but this probe has the disadvantage of non-specific primer binding and false-positive signals as SYBR Green does attach to any type of double stranded DNA.
5.2.3 Relative quantification using internal amplicons:
to prevent technical influence on quantification. The use of an internal control had also the practical advantage that only one sample (the DNMT3A sequence containing all three amplicons) was digested so that laboratorial work was shortened and the amount of restriction enzyme reduced.
5.2.4 Calculations:
5.2.4.1 Mutational proportion:
The calculation of the mutation was based on a mathematical model for relative quantification in real-time PCR reactions by Pfaffl MW (2001) which estimates the relative expression ratio of a target gene in relation to a reference gene transcript by taking into account the PCR amplification efficiencies. For this project, this model was further refined by expressing the level of mutation in relation to a calibration curve, as usually done for absolute quantification, with the aim to obtain measurements as precise as possible. The benefit of this refined calculation method is that the results are corrected for differences in PCR efficiencies between target and control sample and that the threshold detection is defined very precisely through a calibration curve. An inconvenience of the refined efficiency correction method is the need for dilution series experiments of the target to create the standard curve. If several reference genes or internal controls are used this has a great impact on the laboratory time and effort. However, in the present case this disadvantage has less importance as only one internal control is used. Another option to estimate quantification is the comparative Ct method (2-ΔΔCt method) which postulates several assumptions (Schmittgen TD & Livak KJ, 2008). One of them is that the PCR efficiency is 100% which is why this method wasn’t appropriate for the present data setting.
5.2.4.2 Relative cutting control:
applied in all subsequent experiments. However, this observation needs to be further validated by testing the stability of this phenomenon across different cell lines as well as bone marrow samples. This disadvantage of the MRD detection assay which could easily be improved in future experiments by adding a mock-digestion sample of each AML sample or by further analysing the consistency of the above mentioned Ct values.
5.2.5 qPCR primer binding and amplification efficiencies:
As literature on relative quantification of gene expression levels based on qPCR (Schmittgen TD & Livak KJ, 2008) suggested that primer amplification efficiencies of the target and control gene should be within 10% of each other, the primer efficiencies of the method established in this project were considered valid to estimate the proportion of the mutation, especially as the calculations were corrected for each primer amplification efficiency. However, the digestion control primer had a slightly lower efficiency of 79% which is downgrading the predictive value of the digestion control calculations. According to Schmittgen and Livak’s protocol primer amplification efficiencies should be at least 80%, therefore an adjustment of that primer might have been useful to improve the precision of the estimation of the digestion control. As mock-digestion experiments showed, there were small differences in Ct values due to potential qPCR inhibition by restriction enzyme buffers. These were corrected by a further correction factor obtained through comparisons of mock and enzyme digested PCR product, so that the calculations were as accurate as possible. In this model we assume that the altered primer binding qualities are similar when digested KG-1 PCR product is amplified as well as patients’ samples or other cell lines. To prove this assumption further experiments are needed to confirm that the primer binding qualities are consistent across different cell lines and patients samples.
5.2.6 Calibration curve:
5.2.7 Sensitivity and reproducibility:
The limit of detection of the minimal residual disease assay was between 10-3 and 10-4 as the DNMT3A mutation was still reliably detected in less than 1% of leukaemic cells or 0.5% allele frequency respectively. This level complies with the requirements stated by VJH Van der Velden et al. (2003) and E Paietta et al. (2012) for detection of recurrent gene mutations in acute myeloid leukaemia. One restraint is that the sensitivity was measured based on dilution experiments of the DNMT3A R882C mutation so that the level of minimal detection is formally only confirmed for the R882C type of the mutations at the R882 hotspot. However, as the R882H mutation is based on the same mechanism, there should be no objections against transferring this level of detection to the R882H type of mutation.
The reproducibility was tested by repeating the qPCR and subsequent mutation calculations leading to similar results based on statistical analysis by Wilcoxon test and paired t- test. A repetition of the experiments from the beginning including the initial PCR and especially the restriction enzyme digestion would have been more precise and would allow more realistic conclusions about the reproducibility of the assay. This should be taken into consideration in future experiments.
5.2.8 DNMT3A mutation status and clinical characteristics of the AML samples:
In this report, out of the AML sample pool containing 42 samples in total, two DNMT3A R882H mutations were detected and quantified as 97.7% and 71.1% respectively and one R882C mutation was detected but not further analysed due to depletion of the sample. Moreover, 20 other AML samples were screened using the quantification method and the absence of the DNMT3A R882 mutation was confirmed.
In most studies from Europe and the United States patients with AML harbouring the DNMT3A mutation were about 10 years older, of male sex, had a high blast count and typically presented with cytogenetically normal AML compared to those without the mutation (Tie R et al., 2014; Renneville A et al., 2014; Gaidzik VI et al., 2103; Thiede C, 2012). There are tendencies towards these characteristics in the present patient cohort as well: Both were male, of older age, had a considerably elevated blast count and one of them had cytogenetically normal AML. The other patient differed in the genetic profile as he had a deletion of the long arm of chromosome 5. Furthermore, one of the two was positive for the FLT3-ITD mutation which has been observed as a frequent co-occurrence of DNMT3A mutations (Abdel-Wahab O & Levine RL, 2013). However, no statistically significant differences were observed between patients with the DNMT3A mutation compared to those without the DNMT3A mutation. One possible reason for this is that only a small number of patients was analysed as only a limited number of patients were diagnosed with acute myeloid leukaemia during the study period in East Sussex. Another reason could be the fact that patients with AML were analysed at all points during their treatment, not only ones with primary AML but also those with relapsed disease (see table 8, 4.4.1.) which could potentially reduce the number of patients with DNMT3A mutations and mask their typical presentation.
An advantage of this patient cohort was that 3 patients had samples available at initial diagnosis and also at relapse. Analysis showed that these patients were DNMT3A mutation negative at initial diagnosis and remained so during the disease development. Unfortunately, no follow-up samples from DNMT3A mutation positive patients were available.
5.3 Analysis of the DNMT3A detection tests in comparison to others:
al., 2010), whilst Ley et al. performed massively parallel deep sequencing of 281 AML patients (Ley et al., 2010). Shortly after this, Yan X-J et al. distinguished the mutation by using exome sequencing in acute monocytic leukemia (the M5 subtype of acute myeloid leukemia) (Yan X-J et al., 2010). Subsequent studies used direct Sanger sequencing of either all coding exons or only exons enriched for genetic alterations within the DNMT3A gene (Ostronoff F et al., 2013; Tiacci E et al., 2012; Renneville A et al., 2012; Patel JP et al., 2012). However, the ongoing development of these sequencing technologies lacks practical applicability and availability in standard diagnostic laboratories and rather advances research purposes. Therefore, the differential restriction enzyme screening test provides an advantageous rapid and simple analysis for diagnostic laboratories with basic equipment and represents a valid method for smaller health care centres with less advanced technologies accessible (Brewin JN et al., 2013).
More recently a comparable endonuclease restriction test to our assay has been developed using another specific restriction enzyme with a sensitivity of 0.05% mutant allele frequency which is higher than our restriction enzyme test (Berenstein R et al., 2014). This might be due to insufficient optimisation in our laboratory, interaction of different buffers or the use of a more efficient enzyme.
Additionally, Mancini M and colleagues (2015) developed a restriction enzyme based RT-PCR assay to screen for DNMT3A R882 mutations. Compared to our differential restriction enzyme test their approach detects R882H, C, S and P alterations while we only confirmed our assay for the more common R882H and C mutations. Theoretically, our assay also has the ability to detect R882S mutations because this C-to-A transversion results in a serine substitution that generates an AluI restriction site, the second endonuclease used in the differential restriction enzyme sequence. Though, in our study population no R882S substitution was present so that we couldn’t validate the detection of this rare substitution (Brewin JN et al., 2013).
However, those caveats are compensated for the high sensitivity of 5% mutant to wild type copy number of our differential restriction enzyme test compared to 10% (Mancini M et al., 2015).
The detection of minimal residual disease in acute myeloid leukaemia promises to be a powerful parameter for both post therapy monitoring of selected patients for appropriate post induction or consolidation therapy along with a potential control during ongoing initial treatment to check therapy response but it is still subject to many difficulties such as non consistent baseline levels between the different detection methods or the absence of longitudinal stability of gene mutations (Paietta E, 2012). In the following different paragraphs DNMT3A detection analyses are evaluated and compared to the instant MRD test: High resolution melting (HRM) analysis is a technique that measures the melting point of double stranded DNA fragments after PCR amplification by measuring fluorescence dye levels and is often applied for detection of aberrant sequence variants (Pfaffl MW, 2010). In a recent study showing that high DNMT3B (DNA methyltransferase B) levels predict a poor prognosis in acute myeloid leukemia DNMT3A mutations in exon 23 were detected by RT-PCR and HRM analysis. The method was established using a dilution series of an AML sample carrying the R882H mutation resulting in a sensitivity of 2.5% (Hayette S et al., 2012). This approach is relatively similar to the present work in terms of development of the detection threshold. However, our assay was able to reliably detect DNMT3A R882 mutations with a sensitivity of 1%. Nonetheless, the report by Hayette et al. (2012) examines for mutations positioned between codon V867 and R891 including codon R882. Admittedly, they include 24 codons into the mutational analysis while the present methodology focuses only on codon R882 where indeed around 60% of all DNMT3A mutations are found (Ley TJ et al., 2010; Yamashita et al., 2011; Renneville A et al., 2012). In conclusion, our assay offers a higher sensitivity with a focus on the most frequently altered codon as opposed to a lower sensitivity analysis of a larger sequence.