MODIFICATION OF RECOMBINATION FREQUENCY
IN
DROSOPHILA.I.
SELECTION FOR INCREASED AND DECREASED CROSSING OVERJOSEPH P. CHINNICIl
Department of Biology, University of Virginia, Charlottaville, Virginia 22901
Received February 16, 1971
I N species consisting of diploid outbreeding individuals, genetic recombination is of great importance. By allowing reciprocal exchange of genetic material between homologous linkage groups (chromosomes), crossing over produces many different combinations of linked genes. Thus, the phenotypic variability available for the action of natural selection will be increased by the appearance
of new combinations of linked genes that affect the fitness of individuals possess- ing them (DOBZHANSKY 1946; SPIES and ALLEN 1961).
The selective modification of the frequency of recombination between linked genes in diploid outbreeding organisms is thought to be evolutionarily important in at least two ways. Natural selection may alter recombination frequency: (1) To adjust the rate of release of stored (potential or unexpressed) polygenic variability for quantitative traits in response to the environmental situation (MATHER 1943, BODMER and PARSONS 1962), or (2) to tighten the linkage be- tween genes which interact epistatically to improve the fitness of individuals carrying them (FISHER 1930) so that L1supergenes7’ are built up (SHEPPARD 1953). Elaborate mathematical models have been constructed supporting these theories (see KIMURA 1956; KOJIMA and SCHAFFER 1964; NEI 1967 and
TURNER
1967). However, actual experimental data bearing on the selective modification of crossover frequency are sparse and seemingly contradictory, and very little is known about the genetic control of recombination in eukaryotes.
Several attempts to modify recombination frequency by selection have been reported for Drosophila melanogaster. DETLEFSEN and ROBERTS (1921 ) were able to decrease, but not increase, the amount of crossing over between the sex- linked genes white ( w ) and miniature ( m ) . They used a selection scheme in which flies were chosen on the basis of the X chromosome(s) they carried (i.e., L 1 ~ h r o m ~ ~ ~ m e ’ 7 selection for non-crossover chromosomes for the w-m region
in
both the high and low lines) and the amount of crossing over shown by the mother in single-pair matings (i.e., “family77 selection for the appropriate re- sponses in the high and low lines). Using slightly modified but essentially similar selection schemes, MOYER (1964) was also able to decrease, but not increase, recombination between the third chromosome genes taxi and ebony but ACTON
(1961 ) was unable to decrease recombination between the second chromosome genes cinnabar and vestigial. ACTON did not attempt to increase recombination
Prcsent addless. Department of Biology, Virginia Commonwealth University, Richmond, Virginia 23220
72 J. P. CHINNICI
Generation Type of Mating (Type of Selection)
Mutant Base Popviation
I
Family Mating
(Family and Chmasame Selection)
2, 6, etc. Mas M a t i w
(Chromosame Selection)
3, 7, etc.
+ + +
+
Family Mating sccvsn3m
(Family and Chromasome Selection)
4, 8, etc. + + + +
M a s Mating IC cv sn3 m
(Chramasame Selection)
5,9, etc.
+ + + +
sc cv 5133 m
Wild-Type Base Population
sc cv sn3 m
+ + + +
15 =/
sc cv in3 m
i
I5
Family Mating sc cv m3 m I
IC cv in3 m
7
IC cv s n 3 m
-
IC cv sn3 m 7
(Family and Chromosome
Se1 ection)
1
etc.
LOW LINE
\ J
sc
+
+ +\*+
cv sn3 m=X=
sc cv sn3 m
I
-
sc cv in3 m
t
sc cv sn3 m
-x-+ -x-+
+
+..-
I
I
etc. IHIGH LINE
or reciprocal crass
FIGURE 1 .-Bidirectional selection regime practiced in the sc-cu region of the X chromosome. Flies of the listed genotypes were selected and mated either in single pairs (family) or mass matings, as indicated. See text for complete details.
in this region. PARSONS (1958) was able to increase recombination between the second chromosome genes black ( b ) and purple ( p r ) using chromosome selection alone. He selected, whenever possible, flies carrying second chromosomes which underwent a crossover event in the b-pr region. However, crossing over in a n adjacent region, purple-vestigial ( u g ) , decreased slightly so that crossing over in the overall b-vg region was not altered significantly by selection.
SELECTIVE ALTERATION O F CROSSING OVER 73
over in one region of the
X
chromosome affect recombination in adjacent regions? ( 3 ) Can changes in crossover frequency occur in the absence of either chromo- somal rearrangements (see LUCCHESI and SUZUKI 1968) o r genes with major effects on recombination (see HINTON 1966; SANDLER et al. 1968)?(4)
Is there a maternal effect on modifying crossing over? and(5)
Does recombination fre- quency behave as a quantitative trait controlled by a polygenic system?MATERIALS A N D METHODS
Stocks: Three stocks of D. melanogaster were used during the course of the experiment: the standard laboratory stocks Oregon-R and Hikone-R and a newly synthesized stock which was homozygous for the sex-linked genes scute (sc, 1-O.O), crossveinless (cv, 1-13.7), singed (sns, 1-21.0), and miniature (m, 1-36.1) See LINDSLEY and GRELL (1968) for a full description of these mutant genes.
Mating and selection schemes: All the crosses described below were performed i n a constant temperature incubator at 25 k 1 "C. The culture media used were standard mixtures (see CHINNICI
1970, for recipes).
Bidirectional selection for modification of recombination frequency between sc and cu was practiced as outlined in Figure 1. Two base populations were crossed, a wild-type population composed of a Hikone-R/Oregon-R mixture and the sc-cv-sn~-m population. The F, progeny of
this cross were then used to set up the first generation of family matings from which the high and low lines were established. After generation 1, alternating family-mating and mass-mating generations were set up.
In each family-mating generation, 20 to 40 single-pair matings were established i n individual
8 dram shell vials. All female parents were 48k6 h r old when initially mated. To reduce larval and pupal competition, each set of parents was periodically transferred 3 times, a t 3-day intervals, into fresh vials so that each set was allowed four three-day laying periods in all. Families which produced less than 100 offspring were discarded from the population, since reliable determination of crossover percentages depends upon large numbers of scored progeny. In each line, 5 to 10 male and femsle progeny of the genotypes indicated i n Figure 1 were selected from each of
3 to 5 families showing decreased sc-cu recombination in the low line and increased sc--cu recombination in the high line. These progeny flies were then equally distributed among 4 or 5 half-pint milk bottles and allowed to mate freely. Eight days later, the parents were removed and the progeny were allowed to complete development. Selected progeny from each mass mating were then pair mated in all possible combinations to set up the next round of family matings. Family selection could be practiced only in odd-numbered generations, and was practiced
only with regard to the amount of crossing over in the sc-cu region. The frequency of crossing over observed in the cu-sn3 and sn3-m regions did not influence the selection of families, since the crossover values in these regions were disregarded when families were selected.
Offspring from selected families were collected on the basis of the crossover history of the
X chromosome(s) they carried. In the low line, offspring carrying X chromosomes derived from parental chromosomes which did not undergo crossing over between sc-cu, cu-sns, and sn3-m were chosen. In the high line, chromosome selection favored individuals possessing X chromo- somes which underwent a recombinational event in the sc-cu region while not crossing over in the cu-sns and sn3-m regions. Thus, the type of chromosome selection in the sc-cu region reinforced family selection in both lines, while there was no difference between the lines as far as the type of chromosome selection practiced for the cu-sn3 and sng-m regions is concerned. Similar chromosome selection was also practiced upon offspring of the mass matings in the even- numbered generations.
In summary, family selection was practiced only for the sc-cu region, while chromosome selection was practiced in all three regions. Chromosome selection did not favor recombination between cu-sns and sn3-m in both the high and low lines, while favoring recombination between
74 J. P. C H I N N I C I
Progeny from s e l e c t e d f a m i l i e s , Generation 45
LOW LINE HIGH LINE
s c CY
m
s n 3 m x + + + + + + + + s c s c cv cv s n 3 s n 3 m m1-
-1
s c cv s n 3 m
s c C Y s n 3 m x s c CY s n 3 m s c cv s n 3 m x s c cv s n 3 m
+ + + +
7
+ + + + f-Mass
matings
Family
matings
Progeny s c o r e d f o r recombination frequency between
E-=,
cv-sn3, and &-E.FIGURE 2.-Mating scheme for the interline (high line x low line) crosses. See text for full details.
Duration of selectiom Family selection was practiced in odd-numbered generations until
generation 33. After generation 33, family matings were discontinued until generation 45, and both the high and low lines were continued by mass matings only, with the chromosome selection scheme (as outlined in Figure 1) continuing unchanged. In generation 46, family matings were set up and family selection was practiced for one generation, followed again by continuous mass- mating generations.
Interline crosses: Using selected progeny from the high and low lines in generation 45,
interline crosses were set up as illustrated in Figure 2. The crossover properties of the F, progeny from these crosses were analyzed to determine the dominance relationships between the high and low lines, as well as possible maternal effects on crossing over.
Polytene chromosome examinatiom Flies from both the high and low lines were checked t o
determine whether they carried any inversions, deletions, or translocations which could be detected by polytene chromosome examination. From the progeny of a mass-mating generation (generation 3 6 ) , 20 wild-type virgin females were collected from each line. These females were mated with males from an isogenic wild-type stock derived from the standard laboratory Swedish-C strain. Female larvae from each of these crosses were collected. The salivary glands of at least six female larvae from each cross were stained with aceto-orcein and squashed. These slides were then examined microscopically for the presence of any heterologous structures.
RESULTS
Responses to selection: Recombination frequencies were determined for the sc-cu, cu-sn3, sn3-m, and the total sc-m intervals for every family in each family-mating generation. These data may be found in CHINNICI (1970). The original data from each family were first rounded off to the nearest whole percent and transformed into angular values (P=sin*+) as suggested by MATHER (1 951 )
.
Number
of
Families
1 3 5H 7H 9H 1lH 13H 15H 17H 19H 21H 23
58 22 30 27 24 27 17 20 20 19 29 19 20 17 18 18 19 19 Progeny Number per
family XLS.
-
226 5 66 182 2 39 260 2 62 219 2 38 130 2 22 316 + 63 219 46 196 5 37 217 2 32 228 52 194 2 47 189 2 57 197 2 35 254 2 38 238 2 44 152 2 22 225 2 47 200 2 43 Percent Re comb in at ion sc-CY cv-sn3 sn3-m sc-m-
-
- --
-
--
--
-- X
X X X 15.4 8.1 16.0 8.0 18.4 9.2 16.8 8.4 17.6 7.9 17.6 8.0 18.2 8.7 19.5 7.6 19.0 7.5 21.9 8.2 20.5 7.8 19.6 6.7 19.8 7.3 19.1 7.1 18.9 7.0 21.7 6.9 21.6 6.4 22.1 7.0
16.3 15.6 16.0 15.3 15.7 15.6 14.6 14.2 15.0 15
.O
12.2 14.7 13.2 14.5 14.3 15.6 16.3 14.7 40.5 40.0 43.9 40.7 41.8 41.6 41.8 43.2 41.0 45.5 43.5 38.9 42.1 39.9 40.6 43.4 46.3 42.9
Number
of
Families Selected
3 5 5 5 4 5 3 3 3 3 3 3 3 3 3 3 3 3
Mean Recombination Values for Selected Families fn M
19.9 18.5 22.0 20.7 22.7 23.0 21.7 24.3 22.6 24.3 23.0 24.7 21.7 22.3 21.3 25.0 22.3 24.0
P M n
sc-cv cv-sn3 sn3-m sc-m
a
_-
--
--
--2
x
m k
3
9.3 17.7 10.0 16.9 8.4 16.7 9.0 15.2 9.3 17.5 8.7 15.3 8.6 14.3 6.6 18.0 9.9 11.8 7.2 18.0 6.3 13.6 6.9 13.5 8.6 13.3 6.6 13.8 8.6 14.0 6.3 13.6 7.7 16.0 7.6 13.647.7 43.0 49.0 46.3 50.0 47.6 45
.O
Gene
ration 1 3L 5L 7L 9L 11L 13L 15L 17L 19L 21L 2 3L 25L 27L 29L 31L 3 3L 45L
Number
of
Families Examined
58 23 37 25 21 25 17 17 17 17 30 17 18 17 14 15 20 20
Progeny Number per
family x 2 S.
-
226 2 66 243 2 45 179 2 40 179 2 43 136 2 21 274 2 60 182 2 35 143 2 24 169 2 44 212 5 65 192 2 48 155 f. 35 186 2 51 197 2 62 147 2 36 221 2 51 186 5 44 163 2 39 Percent Re comb in at ion sc-cv cv-sn3 sn3-g %-E_-
---
--
-
XX X 15.4 8.1 15.6 7.7 15.7 7.9 15.1 8.0 13.7 8.3 12.1 8.2 11.6 8.7 9.7 6.9 10.0 6.9 11.6 7.5 9.6 7.0 9.6 6.9 7.9 5:2 7.8 5.2 9.1 5.9 9.2 6.8 8.5 6.3 10.1 5.7
16.3 16.3 16.0 16.0 15.7 14.6 14.7 14.8 14.8 15.4 15.5 14.2 13.8 13.6 14.8 15.8 15.5 14.2 40.5 40.0 40.0 39.6 38.2 35.4 35.8 31.5 32.0 35.1 32.9 31.1 27.2 27.0 30.1 33.9 30.6 30.1
Number
of
Fami
lies
Selected
5 3 4 5 4 5 3 3 3 3 3 3 3 3 3 3 3 3
Mean Recombination Values for Selected Families 13.0 8.1 16.7 12.3 6.4 14.7 9.4 9.2 14.2 8.6 7.6 14.3 7.9 8.0 14.9 7.7 6.8 14.0 7.3 6.6 13.3 7.9 5.9 17.9 7.0 4.6 15.2 7.6 6.6 11.9 6.6 4.2 11.3 6.5 3.3
12.5 13.5
7.6 4.0 6.3 7.3 16.7 5.9 5.5 14.6 12.7 6.6 15.6 11.3 7.9 18.2 7.8 2.9 12.6 38.0
<
35.3 33.3
$
4
37.5 33.7 30.9
2
m
33.3 28.7
2
3 E3 27.3 05
31.8 3a
26.9f
25.9 22.4
ci
21.5
9
25.2 30.3
m
SELECTIVE ALTERATION O F CROSSING OVER
TABLE 3
Regression of mean recombination frequency on generation number ( b ) , along with t-test
values of significance for each X-chromosome region of the high and low recombinant lines
77
28-- 27-- 26--
25--
2 4 - -
Line and region
High sc-cu
Low sc-cv High cu-snf
Low cu- sn~
High snf-m
Low snf-m
High sc-m
Low sc-m
S C - C V
HIGH
b
- _ _ _ ~
$0.1168 -0.2287 -0.0567
-0.0902
-0.0422 -4.0346
$0.0316 -0.2242
High us. Low
P t(30) P
5.75 9.14 4.93 4.64 2.15 2.37 1.10 6.24
0.001 10.53 0.001 0.001
0.001 1.50 0.2-0.1 0.001
.05-.02 0.19 0.9-0.8
.05-.02
0.3-0.2 5.62 0.001 0.001
See text for full details.
and 2, along with information on family size. These results are illustrated in Figures 3, 4, and
5.
Recombination values from the selected families are found in Tables I and 2.78 J. P. C H I N N I C I
C V - S N 3
1 1
10
HIGH
b - 0 0 5 6 7
2 5
P 4 0 0 1
3
I I I I I I I I I I I I I I I I I I
1 3 5 7 9 11 13 I5 17 1 9 21 2 3 2 5 27 2 9 31 3 3 4 5
I I I I I I I I I I I I I I I I
G E N E R A T I O N
l 9 t S N 3 - M
1 8
HIGH
b - 0 . 0 4 2 2
w
1 3
P 0 5 - 0 2 z
12
1
l l t
I O
1 1 1 1 1 1 1 1 1 1 1 I l l 1 I I
1 l 1 1 1 1 1 1 1 ~ 1 1 1 ~ ~ 1 1
1 3 5 7 9 11 13 15 1 7 19 21 2 3 2 5 2 7 29 31 3 3 4 5
FIGURE 4.-Mean recombination values and 95% confidence limits for the cv-snS region of
FIGURE 5.-Mean recombination values and 95% confidence limits for the m - m region of
G E N E R A T I O N
the X chromosome of the high and low recombinant lines.
the X chromosome of the high and low recombinant lines.
The information presented in Tables 1, 2, and 3 may be summarized and correlated with selection procedures as follows: (1) sc-cu data. In response to family selection reinforced by selection for crossover chromosomes in the high line the mean crossover value increased from 15.4% to 22.1
%
in 33 generations. Regression analysis showed that this increase was very significant (see Table 3 ) .SELECTIVE ALTERATION O F CROSSING OVER 79
of non-crossover chromosomes. (2) cu-sns data. In response to similar chromo- some selection for non-recombination, both the high and low lines showed a significant decrease in recombination. The responses exhibited by the high and low lines did not differ significantly from each other. (3) sn3-m data. In response to non-crossover chromosome selection, both the high and low lines showed a significant decrease in recombination in the sn3-m region. This response to selec- tion was very similar in the two lines. (4) sc-m data. In the high line, recombi- nation in the sc-m interval increased, from 40.5% to 46.3% in 33 generations of selection, but this increase was not statistically significant. In the low line, the sc-m recombination frequency decreased significantly, from 40.5
%
to 30.6%
in 33 generations of selection. When the responses of the high and low lines were compared, it was found that they differed significantly in their response toselection.
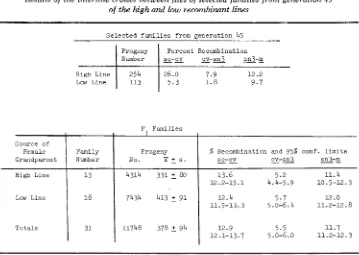
Znterline crosses: The results of the interline crosses, outlined in Figure 2, are given in Table 4. These results show that the F, recombinatioln values for all three crossover regions are roughly intermediate between the high and the low line values of the grandparents (more so when transformed values are used). The intermediate nature of the F, values suggests codominance of factors from the high and low lines.
Also, the F, recombination values from females carrying low line egg cyto- plasm did not differ significantly from females carrying high line egg cytoplasm.
Source of
Female Family
Grandparent Number
H i g h Line 13
Low Line 18
Totals 31
TABLE 4
Results of the interline crosses between flies of selected families from generation 45
of the high and losw recombinant lines
1
Progeny % Recombination and 95% conf. l i m i t s
sn3-m
4314 331 80 13.6 5.2 11.4
--
cv-sn3
--
sc-CY
-
_ _
No. x s .
12.2-15.1 4.4-5.9 10.5-12.3
7434 413 91 12.4 5.7 12.0 11.5-13.3 5.0-6.4 11.2-12.8
11748 378 5 94 12.9 5.5 11.7
12.1-13.7 5 .o-6.0 11.2-12.3
S e l e c t e d f a m i l i e s from g e n e r a t i o n 45
Progeny P e r c e n t Recombination
1
;N;
;
I
%-E=-a
a-qlHigh Line 26.0 7 . 9 12.2
80 J. P. CHINNICI
Thus, there was no indication of a cytoplasmic maternal effect on recombination. Polytene chromosome examination: The polytene chromosomes from salivary glands of female larvae from the high and low lines were examined, as described above, for the presence of heterologous structures. From the low line, six female progeny from each of 18 family matings were examined, and from the high line, six female progeny from each of 20 family matings were scored. Of the total of 108 squashes from the low line and 120 squashes from the high line, none was found to contain any inversion, translocation, deletion, or duplication detectable under the light microscope (590 X )
.
DISCUSSION
The genetic system controlling recombination: The responses to selection shown by the high and low lines in this experiment indicate that recombination may be under the control of a balanced polygenic system as described by MATHER
and
HARRISON
(1949). In the balanced polygenic model which they proposed,each chromosome contains a substantial number of linked polygenes arranged so that most if not all factors with similar effects are in repulsion to their nearest neighbors. Bidirectional response to selection may occur when a balanced linkage between polygenes is broken by recombination. If the balancing is widespread, selective advance is slow and irregular, occurring as unbalanced (coupling) chromosomes are gradually built up from their balanced (repulsion) forerunners. Spurts of rapid advance (accelerated responses) occur when like factors with relatively large effects become coupled by recombination, or when thresholds are reached through a gradual buildup of coupled like factors. Selection will no longer be effective when all polygenic loci become homozygous.
In this experiment, the high and low lines both showed gradual, slow responses to selection in the sc-cu region. What may be interpreted as periods of accelerated response to selection occurred during generations 11-15 and 29-31 in the high line, and during generations 7-15 and 23-25 in the low line. Apparently, in neither line had the genetic factors selected become homozygous to any great extent after 33 generations of selection, for both lines were still responding to selection at that time. Also, both lines regressed slightly towards the original crossover values during the 12 generations when only chromosome selection was practiced.
Other mechanisms besides polygenic modification of recombination are known which could cause real or apparent changes in recombination frequency. Two possibilities are structural changes in the chromosomes and selection of modifiers affecting the penetrance of a particular phenotype. Polytene chromosome exami- nation has directly eliminated the first possibility.
SELECTIVE ALTERATION O F CROSSING OVER 81 bility. In the high line, reciprocal crosses were made in generations 2,6, etc. (see Figure 1 ) . Thus, no consistent directional selection was practiced on modification of the sc phenotype. Also, in both lines, breeding data indicated that the parental flies’ phenotypes always corresponded to their genotypes.
The decrease in recombination in the sc-cu region of the low line might have been caused either by shifting expected crossover events out of the sc-cu region and into adjacent regions or eliminating them completely from the chromosome. Conversely, the increase in crossing over in the sc-cu region of the high line might be due to either the shifting of crossover events into the sc-cu region from adjacent regions or the creation of new crossover events in the sc-cu region of the X. Another possibility is that recombination might have decreased in all regions in the high line. By observing the amount of recombination in regions adjacent to sc-cu (i.e., cu-sns and sns-m), it was possible to determine which of the above possibilities actually occurred.
From Table 3, it may be seen that crossing over decreased significantly in the cu-sns and sn3-m regions in both the high and the low lines. These decreases were probably a response to selection for non-crossover chromosomes which was practiced in these regions in both lines. It is important to note, moreover, that the responses in similar regions in both lines were not significantly different. This indicates that the changes in recombination obtained in the sc-cu region did not affect recombination in adjacent chromosome regions, thereby eliminating the possibility of compensatory redistribution of crossover events and responses by other unselected regions of the X-chromosome. These results strongly indicate that the modification of crossing over in the sc-cu region was due to a reduction in the frequency of crossover events in the X chromosome in the low line, and an increase in the frequency of crossover events in the high line.
The results of chromosome substitution experiments from the high and low lines, reported elsewhere, indicate that the modification of crossing over is strongest in the sc-cu region of the X chromosome and not generally distributed over the entire genome (CHINNICI 1970,1971). These substitution tests also show that the ability to modify crossing over is partitioned among the various chromo- somes in the genome, further indicating that a polygenic system controls recombi- nation frequency in Drosophila.
Evolutionary implications: Selection practiced at the family and chromosome levels can significantly increase or decrease the amount of recombination between sex-linked genes without structural alteration of the chromosome (at least at the light microscopic level). This selective alteration can be very specific, affecting one section of the X without altering recombination to a great extent in other regions of the X. These results argue that supergenes may be built up (or broken down) by the action of natural selection strengthening (or weakening) linkage between epistatic genes. It appears that this sort of event is not only possible but that it can occur without seriously disrupting recombination rates in adjacent chromosome regions.
82 J. P. C H I N N I C I
the amount of recombination between linked genes must be, within limits, subject to modification by natural selection, just as any other continuously varying trait.
The writer wishes to thank Dr. J. J. MURRAY, JR. for his generous advice and criticism with
every stage of this work. Dr. T. R. F. WRIGHT provided technical information and stocks, and Dr. DIETRICH BODENSTEIN provided laboratory facilities. Special thanks are given to my wife, KATHLEEN, for considerable help in washing vials and preparing media. Part of this work was supported by an N I H Genetics Training Grant (grant number 1 TO 1-GM 01460-01A1) admin- istered by the University of Virginia Department of Biology. This work was presented in partial fulfillment for the degree of Doctor of Philosophy.
SUMMARY
A bidirectional selection scheme was used to increase and decrease recombi- nation between two sex-linked genes (sc and cv) in Drosophila melunoguster. After 33 generations of selection, recombination in the low line had decreased from 15.4% to 8.5% while crossing over in the high line had increased from
15.4% to 22.1%. Both changes are significant at the 0.001 level by regression analysis, and the gradual nature of the changes in both directions indicates a polygenic control. Polytene chromosome examination indicates that structural alterations are not responsible for these changes. Crossing over in regions adjacent to sc-cu (i.e., cu--sns and sn3-m) indicates that the changes in recombination frequency observed in the sc-cu region are not due to a compensatory redistri- bution of crossover events from one region into another but rather to an increase (in the high line) and a decrease (in the low line) of crossover events in the sc-cu region of the X . High
x
low interline crosses indicate codominance and no maternal effect.LITERATURE CITED
ACTON, A. B., 1961 An unsuccessful attempt to reduce recombination by selection. Am. Naturalist 95 : 119-120.
BODMER, W. F. and P. A. PARSONS, 1962 Linkage and recombination in evolution. Advan. Genet. 11: 1-100.
CHINNICI, J. P., 1970 Polygenic control of recombination frequency in Drosophila melanogaster. P b D . Thesis, University of Virginia, Charlottesville. __ , 1971 Modification of recom- bination frequency in Drosophila. 11. The polygenic control of crossing over. Genetics 69:
Studies on crmsing over. I. The effect Of selection on Genetics of natural populations. XIII. Recombination and variability 85-96.
DETLEFSEN, J. A. and E. ROBERTS, 1921
DOBZHANSKY, TH., 1946
FISHER, R. A., 1930 FRASER, A. S., 1967
crossover values. J. Exptl. Zool. 32 : 333-354.
in populations of Drosophila pseudoobscura. Genetics 31 : 269-290.
T h e Genetical Theory of Natural Selection. Oxford University Press. Variation of scutellar bristles in Drosophila. XV. Systems of modifiers.
Enhancement of recombination associated with the c3G mutant of Dro- Genetics 57: 919-934.
HINTON, C. W., 1966
sophila melanogaster. Genetics 53 : 157-164.
tion. Evolution 10: 278-287.
S E L E C T I V E A L T E R A T I O N O F C R O S S I N G OVER 83
KOJIMA, K. and H. E. SCHAFFER, 1964 Accumulation of epistatic gene complexes. Evolution 18:
LINDSLEY, D. L. and E. H. GRELL, 1968 Genetic Variations of Drosophila m h o g a s t e r . Carnegie
LUCCHESI, J. C. and D. T. SUZUKI, 1968 The interchromosomal control of recombination. Ann.
MATHER, K., 1943
MATHER, K. and B. J. HARRISON, 1940
MOYER, S. E., 1964
NEI, M., 1967
NEI, M. and Y. IMAIZUMI, 1968
PARSONS, P. A., 1958
SANDLER, L., D. L. LINDSLEY, B. NICOLETTI and G. TRIPPA, 1968
SHEPPARD, P. M., 1953
SPIES, E. B. and A. C. ALLEN, 1961
TURNER, J. R. G., 1967 127-1 3 1.
Institution of Washington Publication No. 627.
Rev. Genetics 2 : 53-86.
1951
Polygenic inheritance and natural selection. Biol. Rev. 18: 32-64.
-,
The manifold effects of selection. Heredity 3: 1-52;
Selection for modification of recombination frequency of linked genes. Ph.D.
Modification of linkage intensity by natural selection. Genetics 57: 625-641. Efficiency of selection for increased or decreased recombination.
Selection for increased recombination in Drosophila melamgaster. Am.
Mutants affecting meiosis in
Polymorphism, linkage, and the blood groups. Am. Naturalist 87:
Release of genetic variability through recombination. VII.
On supergenes I. The evolution of supergenes. Am. Naturalist 101:
Statistical Analysis in Biology. 4th Edition. Methuen and Co., London.
131-1 62.
Thesis. University of Minnesota. Diss. Abstract 2 5 : 1508-1509.
Am. Naturalist 102: 90-93.
Naturalist 92 : 255-256.
natural populations of Drosophila mlanogaster. Genetics 60 : 525-558.
283-294.
Second and third chromosomes of Drosophila melamgaster. Genetics 46: 1531-1553.