ABSTRACT
LYNCH, BRIAN BERNARD. The Synthesis, Self-Assembly, and Application of Magnetic and Silica Nanoparticles (Under the direction of Joseph B. Tracy).
While some synthesis methods for magnetic and silica nanoparticles are more than 40
years old, increasing knowledge about the compositions governing the properties of the
nanoparticles, the mechanisms guiding the synthesis of nanoparticles, and the conversion
chemistry that can be applied to the nanoparticles has accelerated the field to enable the creation
of new types of nanoparticles. Gaining knowledge about the structure and properties of
materials enables one to make informed decisions about how to proceed with implementing the
materials into an application.
This thesis provides a comprehensive discussion of new synthesis methods and potential
applications for magnetic and silica nanoparticles. The thesis begins by (1) describing the
development of a silica-overcoating procedure for nickel nanoparticles that reduced 27 nm nickel
nanoparticles to 2-3 nm nickel nanoparticles, converted the nickel nanoparticles to nickel
hydroxide nanoparticles, and encapsulated these nanoparticles within a 30 nm silica nanoparticle.
Next, (2) the thesis details an investigation into the conversion chemistry of nickel nanoparticles
to nickel sulfide and nickel selenide nanoparticles using 4 different sulfur precursors and 2
different selenium precursors. The final large study (3) surrounds the application of 6 different
nanoparticles by chemically incorporating them into a hydrogel structure and measuring their
physical and chemical properties. Lastly, (4) the thesis describes 3 smaller projects that were
conducted with the important contributions made to the Tracy group and the larger scientific
© Copyright 2018 by Brian Bernard Lynch
The Synthesis, Self-Assembly, and Application of Magnetic and Silica Nanoparticles
by
Brian Bernard Lynch
A dissertation submitted to the Graduate Faculty of North Carolina State University
in partial fulfillment of the requirements for the degree of
Doctorate of Philosophy
Materials Science and Engineering
Raleigh, North Carolina 2018
APPROVED BY:
_______________________________ _______________________________ Dr. Joseph B. Tracy Dr. Yaroslava G. Yingling
Committee Chair
ii BIOGRAPHY
I was born on August 10, 1992, in Wynnewood, PA. About 3 weeks after I was born, my
parents, Bernie and Eva Lynch, and I moved to Ephrata, PA, where I was raised. There, I was
accompanied by two younger siblings, Tim and Caitlin Lynch. I moved through the Ephrata
Area School District, going from Clay Elementary School to Ephrata Middle School to Ephrata
High School.
After high school, I was accepted to Bucknell University, where I started in the fall of
2010. There, I majored in Chemical Engineering and minored in Economics. After finishing at
Bucknell, I started at NC State University in the fall of 2014 in the Materials Science and
Engineering PhD program. I started working under Prof. Joseph Tracy in the spring of 2015 on
iii ACKNOWLEDGMENTS
I would first like to thank my family, especially my parents, for their constant support
and love throughout this process. I truly appreciate everything they have done for me in these
last four years. Next, I would like to thank all of my friends in and outside of NC State for their
encouragement. During my time at NC State, I was involved with many Catholic young adult
groups around the Raleigh area. The closest friends I have made during these 4 years have come
from connections made in those groups. They have been a great support system and have helped
me call Raleigh home for the last 4 years. I would also like to thank all of my friends from
Bucknell that have always been just a phone call away. Their support has also meant so much.
On a professional level, I’d like to thank Joe for all that he has helped me with during my
PhD. Joe brought me on as a first-year grad student back in 2014 and has continually helped me
get to this point. All the members of the Tracy group have also been an immense help over the
last 4 years for everything they did to make my experience easier and more fun. I’d especially
like the thank Bryan Anderson. When I got to NC State, Bryan trained me on many different
procedures and syntheses. Bryan never hesitated to stop what he was doing whenever I had a
question about something. He is one of the most patient people I know. I would also like to
thank all the grad students of the 3074 office suite in Veronica’s group for all the fun they let me
have during my time in the office. They dealt with my antics every day.
Collaborations were a large part of my experience as a researcher at NC State. In total, I
was able to interact with 16 different groups around the country in various capacities. I really
enjoyed getting to know new faces and being becoming friends with many of them. I would
specifically like to thank Jake, Qiaochu and Niels at MIT for their help with the hydrogel project
iv project. Without these two groups, much of the analysis contained within this thesis would not
have been possible.
Lastly, I’d like to thank my committee: Prof. Orlin Velev, Prof. Yaroslava Yingling, Prof.
Lew Reynolds, and Prof. Veronica Augustyn. Veronica was on my preliminary exam
v TABLE OF CONTENTS
LIST OF TABLES ... viii
LIST OF FIGURES ... ix
LIST OF SCHEMES ... xii
Chapter 1: Thesis Overview and Timeline of Projects ... 1
Chapter 2: Background ... 3
2.1 Nanoparticles ... 3
2.2 Ni NPs ... 4
2.2.1 Etching of Ni NPs ... 5
2.2.2 Kirkendall Effect in Ni NPs ... 5
2.3 Silica NPs ... 6
2.3.1 Reverse Microemulsions ... 7
2.4 Hydrogels ... 9
2.4.1 PEG-Catechol Hydrogels ... 10
2.4.2 Rheology of Hydrogels ... 12
2.4.3 Raman Spectroscopy ... 15
2.5 References ... 16
Chapter 3: Synthesis and Chemical Transformation of Ni Nanoparticles Embedded in Silica ... 23
3.1 Motivation ... 23
3.2 Manuscript ... 24
3.3 Extensions Done with Related Ni NPs ... 33
3.4 Potential Directions Forward... 37
3.5 References ... 38
Chapter 4: Sulfidation and Selenidation of Ni Nanoparticles ... 39
4.1 Introduction ... 39
4.2 Experimental Methods ... 41
4.3 Results and Discussion ... 42
4.4 Conclusion ... 52
4.5 References ... 53
Chapter 5: Effects of Crosslinking and Nanoparticle Composition and Size on the Mechanical Behavior of Nanoparticle Hydrogels ... 55
5.1 Introduction ... 55
5.2 Experimental Procedures ... 57
5.3 Results and Discussion ... 62
5.3.1 NP Synthesis ... 62
5.3.2 Nanoparticle Functionalization ... 65
5.3.3 Rheology Measurements ... 66
vi
5.4 Conclusion ... 72
5.5 References ... 74
Chapter 6: Ni NPs in Chloroform ... 78
6.1 Motivation ... 78
6.2 Experimental Methods ... 79
6.3 Results and Analysis ... 79
6.4 Other Contributions to the Project ... 82
6.5 References ... 83
Chapter 7: Ferrite NPs... 84
7.1 Motivation ... 84
7.2 Synthesis Procedure ... 84
7.3 Results and Discussion ... 85
7.4 References ... 87
Chapter 8: Heteroaggregation Progress ... 88
8.1 Motivation ... 88
8.2 Progress on Varying NPs ... 89
8.3 Microfluidic Heteroaggregation Progress ... 92
8.4 References ... 93
Chapter 9: Summary of Other Significant Collaborations ... 94
9.1 Ni NPs Supplied to FSU ... 94
9.2 GNRs Supplied to UVA ... 94
9.3 GNRs Supplied to UNC and Elon University ... 95
9.4 GNRs Supplied to Jason Bochinski’s Group at NC State ... 95
9.5 References ... 96
APPENDICES ... 97
Appendix 1: Differential Scanning Calorimetry Study ... 98
A1.1 MATLAB Code to Analyze DSC Results ... 99
Appendix 2: NP Synthesis Procedures ... 105
A2.1 3 nm Fe3O4 NPs Synthesis ... 106
A2.2 24 nm Ni Particles ... 108
A2.3 Hollow NiP NPs... 110
A2.4 100 nm Ni NPs... 112
A2.5 Aerogel Procedure ... 114
A2.6 Au NPs ... 115
A2.7 Au(core)/Ag (shell) NPs... 116
A2.8 CdSe/CdS Quantum Dot Nanorods ... 118
A2.9 CoNi Particles ... 121
A2.10 Fe3O4 NPs ... 123
A2.11 Ligand Exchange for Fe3O4 NPs-Oleylamine to 3-Mercaptopropionic Acid .... 124
A2.12 NiFe2O4 and CoFe2O4 NPs ... 125
A2.13 NiSe NPs ... 126
vii
A2.15 SiO2-Overcoating of Ni NPs... 129
A2.16 SiO2-Overcoating of QDNRs ... 131
A2.17 SiO2-Overcoated GNRs ... 133
A2.18 TEM ... 134
viii LIST OF TABLES
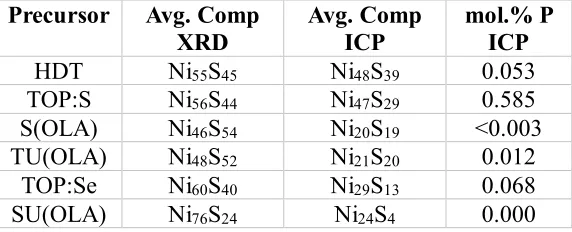
Table 4.1 Concentrations of Ni and S by mol.% contained in the Ni-S samples as determined by ICP-OES measurements ... 46
Table 5.1 Residual wt.% for each NP-PEG-amine sample, obtained from TGA
measurements ... 66
Table 5.2 The relaxation time () and fitting parameter (a) were calculated for each NP-gel sample by fitting to Eq. 5.1. The quality of each fit is indicated by the R2 value. The plateau modulus was taken from the raw relaxation data ... 67
Table 8.1 Heteroaggregation parameters for 8 nm Au NPs and SiO2-overcoated GNRs ... 90
Table 8.2 Heteroaggregation parameters for 40 nm Ni NPs and SiO2-overcoated GNRs ... 90
Table 8.3 Heteroaggregation parameters for 40 nm Fe3O4 NCs and SiO2-overcoated GNRs ... 91
Table 8.4 Heteroaggregation parameters for 7 nm Fe3O4 NPs and SiO2-overcoated QDNRs .. 91
Table 8.5 Heteroaggregation parameters for 3 nm Fe3O4 NPs and SiO2-overcoated QDNRs .. 91
Table 8.6 Heteroaggregation parameters for 3 nm NiFe2O4 NPs and SiO2-overcoated
QDNRs ... 92
Table 8.7 Heteroaggregation parameters for 3 nm CoFe2O4 NPs and SiO2-overcoated
ix LIST OF FIGURES
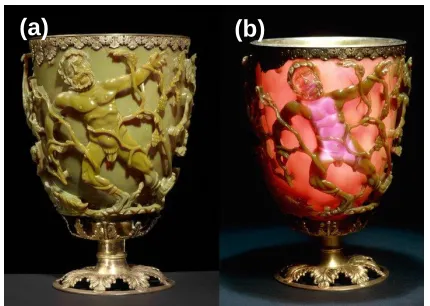
Figure 2.1 The Lycurgus cup, containing Au NPs, with light shown (a) onto the cup and (b) through the cup. This effect highlights the colloidal properties of Au NPs to
scatter light ...3
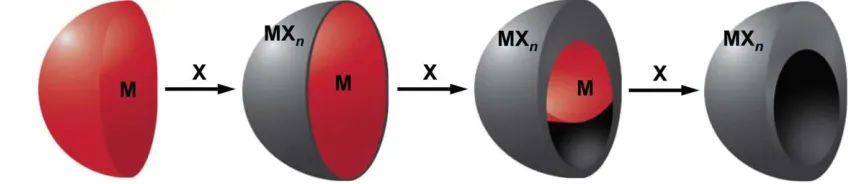
Figure 2.2 The Kirkendall effect for metal nanoparticles can be described by the diffusion couple that is established between the metal (M) and the reactive species (X) ...6
Figure 2.3 Depiction of a (a) surfactant (b) micelle, and (c) reverse micelle ...7
Figure 2.4 Schematic of (a) chemical and (b) physical crosslinks. The physical crosslinks have transient bonds that are constantly breaking and re-forming ... 10
Figure 2.5 Biological structure of mussel... 11
Figure 2.6 Structure of 3,4-dihydroxphnylalanine (DOPA) with catechol functional group highlighted within the molecule ... 11
Figure 2.7 Depiction of the storage, loss, and shear modulus for materials. The storage and loss modulus can be related to one another by using the angle created in this
depiction (δ) ... 13
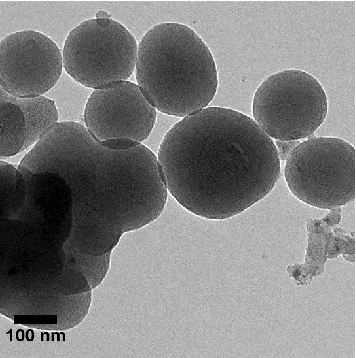
Figure 3.1 SiO2-overcoated Ni NPs synthesized with a concentration of Ni NPs of 1 mg/mL
instead of 2 mg/mL... 33
Figure 3.2 SiO2-overcoated Ni NPs starting with Ni NPs with diameters of 100 nm ... 34
Figure 3.3 SiO2-overcoated NixPy NPs were synthesized using 40-50 nm NixPy NPs and the
SiO2-overcoating procedure used in the SiO2-overcoated Ni NPs... 34
Figure 3.4 SiO2-overcoated NixCoy NPs were synthesized using 20-45 nm NixCoy NPs and the
SiO2-overcoating procedure used in the SiO2-overcoated Ni NPs... 35
Figure 3.5 Ni NPs overcoated with the SiO2-overcoating procedure using 0.6 mL of H2O
and 0 mL of NH4OH... 36
Figure 3.6 SiO2-overcoated Ni NPs using 0.6 mL NH4OH and 0.6 mL H2O ... 37
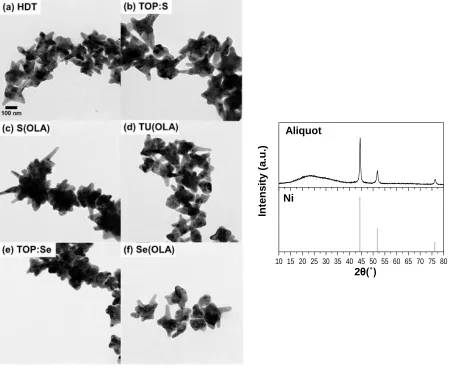
Figure 4.1 TEM and XRD of Ni NPs in an aliquot taken before injection of each precursor, which confirm the branched structure and composition of the template NPs ... 43
Figure 4.2 (a, b) TEM and (c, d) XRD of nickel sulfide NPs synthesized using HDT and TOP:S precursors. Reference data for Ni3S2 (PDF 04-007-5742),
x Figure 4.3 (a, b) TEM and (c, d) XRD of nickel sulfide NPs synthesized using S(OLA) and
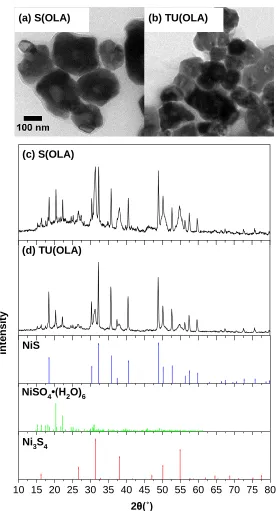
TU(OLA) precursors. Reference data for NiS (PDF 04-007-0707), NiSO4∙(H2O)6
(PDF 04-009-4339), and Ni3S4 (PDF 04-006-5369) ... 48
Figure 4.4 (a, b) TEM and (c, d) XRD of nickel selenide NPs synthesized using TOP:Se and SU(OLA) precursors. Reference data for Ni (PDF 04-002-7521), NiSe (PDF 04-003-7226) and Ni3Se2 (PDF 04-007-3698)... 51
Figure 5.1 TEM images of (a) 8 nm Ni NPs, (b) 7 nm Co NPs, (c) 7 nm Fe3O4 NPs, (d) 5 nm Fe3O4 NPs, (e) 3 nm NiFe2O4 NPs, and (f) 3 nm CoFe2O4 NPs ... 63
Figure 5.2 Size distributions from TEM images of (a) 8 nm Ni NPs, (b) 7 nm Co NPs, (c) 7 nm Fe3O4 NPs, (d) 5 nm Fe3O4 NPs, (e) 3 nm NiFe2O4 NPs, and (f) 3 nm CoFe2O4 NPs ... 64
Figure 5.3 TGA under N2 for NP-PEG-amine samples ... 65
Figure 5.4 Relaxation measurements for each NP-4PEGc sample ... 67
Figure 5.5 Storage (G’, top) and loss modulus (G’’, bottom) of the NP-gel samples ... 68
Figure 5.6 Raman spectra for each NP-4PEGc hydrogel. The box with dashed lines indicates vibrations associated with covalent bonds within the catechol ring ... 70
Figure 5.7 (a) Co2+, (b) Ni2+, (c) Fe2+, and (d) Fe3+ ion gels prepared by mixing the respective salts with 4PEGc and water. The Co2+ and Ni2+ are purely liquid samples, while the Fe2+ and Fe3+ ions caused gels to form ... 72
Figure 6.1 Ni NPs were first purified by adding 1.5 mL stock NP solution, 3.5 mL hexanes and 1.0 mL ethanol and centrifuging for 1:30 at 5000 rpm. The samples were then (a) dispersed in hexanes, (b) dispersed in toluene, (c) dispersed in toluene and centrifuged for 1:30 before being redispersed in toluene, (d) dispersed in hexanes, centrifuged for 1:30 at 5000 rpm before being redispersed in hexanes, and (e) dispersed in chloroform. The NPs were left to sit for 29 hours ... 80
Figure 6.2 TEM image of Ni NPs dispersed in chloroform ... 81
Figure 6.3 Raman spectroscopy results of 3 different spots on a Ni NP sample dispersed in chloroform ... 81
xi Figure 7.2 (a) 3 nm NiFe2O4 NPs synthesized with 2 mmol Fe(acac)3 and 1 mmol Ni(acac)2
and (b) 3 nm CoFe2O4 NPs synthesized with 1 mmol Co(acac)3 and 2 mmol
Fe(acac)3 ... 86
Figure 8.1 SiO2-GNRs decorated with (a) NiFe2O4 NPs and (b) CoFe2O4 NPs through
heteroaggregation processes ... 90
Figure 8.2 TEM images (a) and (b) from the same sample of SiO2-GNRs with
heteroaggregated Fe3O4 NPs deposited onto the surface of the NP using
xii LIST OF SCHEMES
1 CHAPTER 1: THESIS OVERVIEW AND TIMELINE OF PROJECTS
This thesis summarizes the three main projects and three smaller projects that I worked
on during my time at NC State that seek to gain a further understanding of nanoparticle (NP)
synthesis, self-assembly and applications. The first section describes the organic mechanism
associated with developing a porous inorganic NP catalyst. The second section discusses the
conversion chemistry associated with the transition from Ni to Ni sulfide and Ni selenide NPs.
In the third section, I seek to provide an explanation of the properties associated with the
incorporation of six different types of NPs into a hydrogel. The final three sections provide
some details into the progress I have made on unpublished smaller projects that included
studying the conversion chemistry of Ni NPs in various solvents, developing methods for
synthesizing two types of NPs and continuing work started on heteroaggregation to assemble
multifunctional core/satellite NPs.
In January of 2015, I officially joined the Tracy group. My first project expanded on the
work that Dr. Bryan Anderson had completed throughout his PhD. His work was focused on
overcoating CdSe/CdS quantum dot nanorods (QDNRs) with silica. My first task was to develop
a procedure and understand the mechanism by which silica could overcoat Ni NPs. This project
allowed me to be become fluent in NP synthesis and more specifically, Ni NPs. Throughout this
time, I was also supervising Drew Kelliher, an undergraduate in the Tracy group. His objective
was to modify a procedure for synthesizing Ni NPs for the conversion of Ni NPs to nickel
sulfides and nickel selenides. In his senior year, Drew became busy with many things that
prevented him from fully finishing the project. I continued working on this project to bring it to
completion. Throughout the course of my PhD, I became fluent in many different NP synthesis
NP-2 hydrogel composites. The project was part of a collaboration between Prof. Niels
Holten-Andersen, Dr. Qiaochu Li, and Jake Song at MIT and the Tracy group. This project combined
expertise of our group in NPs with Holten-Andersen group’s expertise in hydrogels for a study of
the chemical and rheological properties of NP-hydrogel composites.
During my time at NC State, I have also worked on many smaller projects and was
involved in many collaborations. These projects included studying the effect of chloroform on
Ni NPs, developing a synthesis procedure for NiFe2O4 and CoFe2O4 NPs, and incorporating
NiFe2O4 and CoFe2O4 NPs onto SiO2-overcoated gold nanorods to continue to the
heteroaggregation worked started by Dr. Brian Chapman. My time at NC State also involved
collaborations with 16 different research groups across the country. Throughout my graduate
3 CHAPTER 2: BACKGROUND
2.1 Nanoparticles
Nanoparticles (NPs) are defined as small pieces of matter of any shape having all
dimensions on the nanometer scale (10-9 m). NPs thus composed of anywhere from 10s of atoms
to 100,000,000s of atoms. Although not known as NPs then, effects of NPs were first observed
in the 4th century with the Lycurgus cup, which was composed of small amounts of a gold-silver
alloy.1 This cup became famous because of its color change when illuminating it from different
angles (Figure 2.1).
Figure 2.1: The Lycurgus cup, containing Au NPs, with light shown (a) onto the cup and (b) through the cup. This effect highlights the colloidal properties of Au NPs to scatter light.1
Throughout the 20th century, interest in NPs has grown, as science has progressed to
better understand the size, shape, and properties of the NPs.2, 3 Scientists have noted that the
properties of NPs are different from those of bulk materials. Because of the small sizes, the
interactions of the atoms within the structure and the surface properties are much more
significant than for bulk materials. The small size also means that the surface area: volume ratio
increases as the size of the NP decreases, which is especially relevant for applications that need
materials with large surface areas.
4 Today, NPs are used in many applications in the medicine,4 electronics,5 and catalysis,6
among many others. It is important to understand the properties associated with each type of NP
for knowing how to select and optimize them for the best applications. NPs can already be found
in many products, including skis,7 automotive shocks,8 and batteries.9
Ni and SiO2 NPs and the conversion chemistries associated with Ni NPs are two of the
main topics of this thesis. In the first main project (Chapter 3), Ni NPs were incorporated into
SiO2 NPs in a reverse microemulsion reaction. The second main project (Chapter 4) the
conversion chemistry of Ni NPs into NixSy and NixSey NPs. Finally, the last main project
(Chapter 5) details the incorporation of several different types of NPs into hydrogels. Many
other smaller projects were also completed throughout the course of my PhD. Descriptions of
each of those studies are provided in Chapters 6-9.
2.2 Ni NPs
Ni NPs are transition metal NPs known for their electronic, catalytic, and magnetic
properties, which are of interest for numerous applications. Most applications of Ni NPs revolve
around their surface properties. As the Ni NPs become smaller, the surface area:volume ratio
increases and thus enables more of the Ni surface to be exposed for any given application. Ni
NPs can be synthesized in many different ways to control the size and shape of the particle,
which can determine the magnetic and electronic properties of the NPs.10-12
Nickel has been shown to be suitable as a catalyst in many different reactions including
dry methane reforming,13, 14 hydrogenation of CO,15, 16 and the growth of carbon nanotubes.17, 18
When choosing a material for catalysis, one of the most important selection criteria is the surface
area, which is a common advantage of NPs; therefore, NPs are a very advantageous choice for
5 2.2.1 Etching of Ni NPs
The trend in many different applications, especially surface-driven applications, of NPs is
to move to smaller and smaller sizes. Many physical techniques such as ball-milling,19
lithography,20 and severe plastic deformation21 can be used to decrease the size of the NPs, but
there are physical limits to how small the NPs can be. Chemical methods, including etching, are
well suited for obtaining small NPs.
Etching uses an acid or base to divide larger NPs into smaller NPs.22-32 In Au NPs, the
etching process has been reported using a range of chemicals, including multivalent polymers,23
thiols,24 weak acids,22 protiens,25 and bases.26, 27 In other metal NPs, controlled etching has been
performed using weak acids,32 strong acids,31 and bases.29, 30 The main base used in these
processes is NH4OH. NH4OH is a corrosive chemical to many bulk metals.33, 34 On the
nanoscale, this translates into NH4OH having the ability to break apart Ni NPs into smaller Ni
NPs.
2.2.2 Kirkendall Effect in Ni NPs
Conversion chemistry describes the process, where chemical reactions can be performed
on NPs, resulting in a change in composition that is often accompanied by a change in
morphology.35 In Ni NPs, this change could happen when Ni NPs are converted to NiPx NPs, for
example. The Ni NPs establish a diffusion couple with the reactants, such as, P in the
environment. Depending on how the penetrating species enters into the Ni NP, the conversion
chemical reaction could be considered the Kirkendall effect or galvanic exchange.35 The most
relevant type of conversion chemistry for the reactions discussed later in this thesis is the
Kirkendall effect.36 When applied to NPs, the Kirkendall effect states that void formation is a
6 reactive species (Figure 2.2). In Ni NPs, some examples of the Kirkendall effect are the
formation of NixPy,37 Ni3C1-x,38 Ni/SnO2,39 and Ni1.77Co1.23S4 NPs.40
Figure 2.2: The Kirkendall effect for metal nanoparticles can be described by the diffusion couple that is established between the metal (M) and the reactive species (X).32
2.3 Silica NPs
SiO2 is one of the most abundant components of the earth’s crust.41 Geologists who have
mined for silica have found SiO2 NPs, but often times, the SiO2 contains metal impurities.42
Therefore, pure SiO2 NPs are most frequently chemically synthesized. The Stober method, a
sol-gel method, was published in 1968 and set the foundation for SiO2 NP synthesis.43 This method
yield NPs with size-controlled diameters ranging from 50-2000 nm by reacting a tetraalkyl
silicate with an alcohol and water mixture using an ammonia catalyst. Since Stöber’s
groundbreaking publication, many modifications have been made on his procedure to create
SiO2, SiO2-composite, and carbon NPs.44, 45 SiO2 and SiO2-overcoated NPs are also commonly
obtained through reverse microemulsion46-48 and flame syntheses.49-51 A reverse microemulsion
approach is typically chosen when synthesizing NPs that either need to be highly uniform or
have additional components other than SiO2. A flame synthesis method is usually used for
large-scale applications, where throughput is much more of a priority than monodispersity. Flame
synthesis methods also work by oxidizing tetraethyl orthosilicate (a SiO2 precursor) to create
SiO2 NPs. Incorporating other components, such as other types of NPs, can be challenging in
7 2.3.1 Reverse Microemulsions
An emulsion is defined as a system of two solutions that are normally immiscible with
one another. A surfactant is a molecule with a hydrophobic end and a hydrophilic end (Figure
2.1) that has the ability to combine the two immiscible solutions of the emulsion. The collection
of surfactant molecules where the hydrophilic ends are aligned on the outside of the molecule
and the hydrophobic ends are inside is called a micelle (Figure 2.2). In an oil-and-water
emulsion, soap acts as a micelle and brings the oil within the emulsion inside the micelle and off
of a dirty surface. In a reverse micelle, the surfactant is turned around, with the hydrophilic ends
on the outside and the hydrophobic ends on the inside of the micelle (Figure 2.3). In reverse
micelles, the oil or organic phase is the solvent, and the water or aqueous phase is on the inside
of the micelle. The self-assembly of the surfactant in a system is governed by the
thermodynamics of the system.52
Figure 2.3: Depiction of a (a) surfactant (b) micelle, and (c) reverse micelle.
Micelles and reverse micelles commonly have nanoscale dimensions, which can make
them useful as confined environments for synthesizing NPs. A microemulsion forms when the
micelles have sizes below 100 nm.53 Because NPs are often synthesized in organic environments
8 and have organic ligands, reverse microemulsions are more common than microemulsions for
NP synthesis. Micelles and reverse micelles are dynamic systems. Collisions between reverse
micelles can allow transfer of their contents with each other, which can increases the size of the
contents within the micelle.54 The solvent has been found to be the prevailing factor that directs
the reverse micelle’s abilities to exchange material, which determines, the size of NPs obtained
through synthesis in reverse microemulsions,55 while the surfactant coats the surface of the
NPs.56, 57 Increasing the strength of the interactions between the solvent and the surfactant
creates a more stable system, which allows for larger NPs to grow and prevents the aggregation
of NPs.56 The water content within the system has also been argued to be a very important factor
in determining the collision behavior, and thus, final NP size. Researchers have come to
different conclusions about the exact effect of water in the system,52, 58-60 but it is clear that often,
the initial water content is important in determining the final NP size.61-63 Reverse
microemulsions have been seen to be an effective method for synthesizing SiO2,64 Pd,65 and
NiPt66 NPs, among many others.48, 67, 68 This technique is relatively common in the field.
The reverse microemulsion method for synthesizing NPs was first published in 1990, and
many modifications have also been reported.46, 69-72 In this method, a non-ionic surfactant
creates the reverse micelle within an organic solvent. Tetraethyl orthosilicate, the SiO2
precursor, is added along with a small amount of water and proceeds through the hydrolysis (Eq.
2.1), alcohol condensation (Eq. 2.2) and water condensation reactions (Eq. 2.3). NH4OH is
commonly used as a base catalyst for improving control over the reaction.
Eq. 2.1 ≡ 𝑆𝑖 − 𝑂𝑅 + 𝐻2𝑂 ⇌ ≡ 𝑆𝑖 − 𝑂𝑅 + 𝑅𝑂𝐻 Eq. 2.2 ≡ 𝑆𝑖 − 𝑂𝑅+ ≡ 𝑆𝑖 − 𝑂𝐻 ⇌ ≡ 𝑆𝑖 − 𝑂 − 𝑆𝑖 + 𝑅𝑂𝐻
9 Mixing occurs throughout this process and for a long period of time after the components
are added to the mixture. Stirring facilitates collisions of the reverse micelles so that they can
temporary connect with each other allowing transfer of the contents from one reverse micelle to
another. This transfer allows for the growth of the SiO2 NPs.69, 71
2.4 Hydrogels
Hydrogels are, by definition, three-dimensional hydrophilic networks of crosslinked
polymer chains that increase in volume, or swell, when water is added to them.73 Synthetic
hydrogels began with designs similar or identical to natural hydrogels, but were optimized to
maximize a certain property of the gel. The interest in hydrogels stems from their applicability
in many areas such as agriculture,74-76 sensing,77-79 and tissue engineering.80-82 Hydrogels can be
created by either physically or chemically crosslinking the gel (Figure 2.4).83 Chemical
crosslinks are permanent, non-reversible bonds that bind the polymer chains together, while
physical crosslinks are normally caused by molecular self-assembly, which is usually a result of
entanglements of the polymer chains or non-covalent supramolecular interactions between the
polymer chains.84-86 A supramolecular interaction between polymer chains is any interaction that
is not a covalent bond between the chains such as a hydrogen bond, metal-ligand complex, or
electrostatic bond.83 Because chemical crosslinks are composed of covalent bonds that form
between the polymers, chemically crosslinked hydrogels are more brittle than physically
10 Figure 2.4: Schematic of (a) chemical and (b) physical crosslinks. The physical crosslinks have
transient bonds that are constantly breaking and re-forming.73
Metal-ligand complexes are especially relevant for the work outlined in Chapter 5 of this
thesis. In these systems, physical crosslinks form when two or more ligands donate a
non-bonding electron pair to empty orbitals in a transition metal.83 Metal-ligand coordination
crosslinks inherently have high stabilities and quick rates of formation. As a result, the
hydrogels exhibit high levels of toughness, hardness, adhesion, and self-repair.88-90 There are
many examples in nature of these metal-ligand complexes physically crosslinking biological
structures together with metal ions found in nature that have served as inspiration for synthetic
hydrogels.91-93
2.4.1 PEG-Catechol Hydrogels
Sea mussels is usually thought of as a rather simple creature, but recently, the fibers used
by mussels to latch onto rocks have garnered interest in the materials science field. Their
structure is rather simple (Figure 2.5), having few biological components.94
11 Figure 2.5: Biological structure of mussel.
Researchers have learned, however, that the polymeric fibers create a strong bond
between the mussel and the whatever rock they latch onto. Bond strengths of between 0.1 and
107 N/m2 have been reported, depending on the surface to which it is attached.95 The byssal
thread, which connects the mussel to the byssus or the foot that attaches to the rock has been
found to have a breaking energy of 12.5 × 10⁶ J/m3, five times that of a vertebrate tendon.96
Byssal threads are also 6 times tougher and 15-20 times more extendable than tendons. They can
also recover initial lengths and stiffnesses if given sufficient time to relax.97 The amino acid
largely responsible for these properties is 3,4-dihydroxyphenylalanine (DOPA) (Figure 2.6),94, 98
which has a catechol group.
12 If larger amounts of the catechol group are added to the DOPA-containing molecule,
larger amounts of adhesion are observed.99, 100 Mussel fibers have also been examined and show
that Fe3+ ions are present within the structure of the fibers.90 Therefore, to mimic the byssal
threads, hydrogels have been synthesized using polyethylene glycol (PEG) terminated with
catechol.101 The addition of Fe3+ ions drives physical crosslinking of the PEG-catechols to form
a gel network.102 Many different types of PEG-catechol have been synthesized with varying
branching and chain lengths.103-105 Catechols consistently exhibit an affinity for Fe3+ ions or
Fe3O4 NPs.102, 106-108 This affinity typically results in an increased modulus and toughness after
adding Fe3+ to the system.
2.4.2 Rheology of Hydrogels
Rheology is the study of the flow of matter in solids and liquids. Stress () and strain ()
are two fundamental properties measured in rheology. Stress is defined as the force applied/unit
area (Eq. 2.4) and strain is defined as the elongation()/total original length (0) of the object (Eq.
2.5).
Eq. 2.4 𝜎 =𝐹𝑜𝑟𝑐𝑒 𝐴𝑝𝑝𝑙𝑖𝑒𝑑
𝐴𝑟𝑒𝑎
Eq. 2.5 𝑆𝑡𝑟𝑎𝑖𝑛 = 𝜀
𝜀0
Dynamic stress and strain can also be defined using the angular frequency (𝜔), where t is time,
and is the phase lag between the stress and the strain. (Eq. 2.6 and Eq. 2.7, respectively)
Eq. 2.6 𝜎 = 𝜎0sin (𝜔𝑡 + 𝛿)
Eq. 2.7 𝜀 = 𝜀0sin (𝜔𝑡)
The angular frequency can further be defined (Eq. 2.8), where f is the frequency of oscillatory
strain.
13 The complex modulus (G*) of a material is defined as the sum of the storage modulus (G’) and
the loss modulus (G’’) multiplied by i,or √−1. G’ describes a material’s ability to store energy
as straining is occurring to the material or the elastic portion of the modulus (Eq. 2.9).
Eq. 2.9 𝐺′ = 𝜎0
𝜀0cos (𝛿)
G’’ is a measure of the amount of energy dissipated as heat during straining or the viscous
portion of the modulus (Eq. 2.10).
Eq. 2.10 𝐺′′= 𝜎0
𝜀0sin (𝛿)
If G’ > G’’ the material is considered to behave as a solid. Conversely, if G’’ > G’, the material
is considered to behave as a liquid. If G’ = G’’, the material is classified as a viscoelastic gel. In
hydrogels, liquid, solid, and viscoelastic conditions are seen and therefore, the loss factor, tan(δ),
or the ratio of the G’’ : G’, can be used to assess the extent to which the material resembles a
solid, liquid, or viscoelastic gel (Figure 2.7).
Figure 2.7: Depiction of the storage, loss, and shear modulus for materials. The storage and loss modulus can be related to one another by using the angle created in this depiction (δ).
A frequency sweep is a common rheological test performed to analyze the physical
properties of a material. In a frequency sweep, the modulus of a material is measured over the
14 frequencies correspond to quick changes, while low frequencies correspond to slow changes in
stress.
The relaxation modulus is a second very important rheological measurement used to
describe materials. The relaxation modulus represents the stress of a material over time as a
result of a constant strain applied to the material. The relaxation modulus can be used to
describe the type and degree of bonding that exists in a particular material. Relaxation time (τ)
can also be found by fitting the relaxation data to the Kohlrausch stretched-exponential model
(Eq. 2.11), where G0 is the initial modulus, G(t) is the modulus at a given time (t), and a is a
fitting factor.
Eq. 2.11 𝐺(𝑡) = 𝐺0exp[−(𝑡/𝑡𝑎𝑢)𝑎]
A previous study done by our collaborators used the PEG-catechol gels and studied the
rheology of the gels when Fe3+ ions, Fe3O4 NPs, and mixtures thereof were incorporated.102 The
gels showed a liquid-like behavior when the NP concentration was below 1.0 vol.%, viscoelastic
when at 1.0 vol.% and solid-like when greater than 1.0 vol.%. At identical mass concentrations,
the ion gel showed viscoelastic behavior, while the NP and mixed NP-ion gels had solid-like
behavior. The NP-ion gel was found to exhibit a greater degree of solid-like behavior than the
NP-gel. The relaxation behaviors of the gel also differed; the ion gel showed a much steeper
decline in the normalized modulus relative to the NP and the NP-ion gels. The NP-ion gel had
minimal decrease in the normalized modulus over the course of the relaxation time scale relative
to even the NP-gel. This study was used as a basis for the further research on this topic. In this
prior study, Fe was the only metal tested, but further research can be tested on other
15 2.4.3 Raman Spectroscopy
Raman spectroscopy is an optical spectroscopy technique. Upon illumination, the
molecules within the sample elastically and inelastically scatter the photon. While most photons
are elastically scattered, inelastic scattering can be used to analyze the sample. Inelastically
scattered photons can leave the sample at a higher frequency (anti-Stokes Raman scattering) or
lower frequency (Stokes Raman scattering).109 The difference in frequency between the
elastically scattered photons and inelastic scattering corresponds to the vibrational energies of the
bonds within the molecules. Raman is sensitive to vibrations that are associated with a change in
polarizability.110 This difference is recorded and plotted as the Raman spectrum, which is thus a
measurement of the collection of bonds within a sample and their relative proportions.111 Since
many molecules have unique signatures, Raman spectroscopy can often be used to analyze the
composition of a sample. As a vibrational spectroscopy technique, Raman spectroscopy also can
show when bonding occurs over a broad or narrow range of energies.112
Confocal Raman spectroscopy combines a confocal microscope with a Raman
spectrometer. In this method, the user is able to zoom in on particular features of a sample and
collect the spectra for those areas or features. The spatial resolution of confocal Raman
spectroscopy has also been shown to be higher than other types of Raman spectroscopy.113
Confocal Raman spectroscopy was an important analysis technique used for measuring the
16 2.5 References
1. I. Freestone, N. Meeks, M. Sax and C. Higgitt, Gold Bulletin, 2007, 40, 270-277.
2. N. Tolochko, Nanoscience and Nanotechnology. Encyclopaedia of Life Support Systems (EOLSS), Developed under the Auspices of the UNESCO, SEolss Published, Oxford, 2009, 3-4.
3. C. Toumey, Nature nanotechnology, 2009, 4, 783.
4. S.-H. Huang and R.-S. Juang, Journal of Nanoparticle Research, 2011, 13, 4411.
5. I. Matsui, Journal of Chemical Engineering of Japan, 2005, 38, 535-546.
6. M. Anna, G. N. Albert and I. K. Esko, Journal of Physics: Condensed Matter, 2003, 15, S3011.
7. E. Barna, B. Bommer, J. Kürsteiner, A. Vital, O. v. Trzebiatowski, W. Koch, B. Schmid and T. Graule, Composites Part A: Applied Science and Manufacturing, 2005, 36, 473-480.
8. S. Senthilraja, M. Karthikeyan and R.Gangadevi, Nano-Micro Letters, 2011, 2, 306-310.
9. R. Marom, S. F. Amalraj, N. Leifer, D. Jacob and D. Aurbach, Journal of Materials Chemistry, 2011, 21, 9938-9954.
10. A. C. Johnston-Peck, J. Wang and J. B. Tracy, ACS Nano, 2009, 3, 1077-1084.
11. B. Ashley, P. N. Vakil, B. B. Lynch, C. M. Dyer, J. B. Tracy, J. Owens and G. F. Strouse,
ACS Nano, 2017, 11, 9957-9967.
12. J. Park, E. Kang, S. U. Son, H. M. Park, M. K. Lee, J. Kim, K. W. Kim, H.-J. Noh, J.-H. Park, C. J. Bae, J.-G. Park and T. Hyeon, Advanced Materials, 2005, 17, 429-434.
13. J. M. Ginsburg, J. Piña, T. El Solh and H. I. de Lasa, Industrial & Engineering Chemistry Research, 2005, 44, 4846-4854.
14. J. Guo, H. Lou, H. Zhao, D. Chai and X. Zheng, Applied Catalysis A: General, 2004, 273, 75-82.
15. D. W. Goodman, R. D. Kelley, T. E. Madey and J. T. Yates, Journal of Catalysis, 1980, 63, 226-234.
17 17. S. A. Moshkalyov, A. L. D. Moreau, H. R. Guttiérrez, M. A. Cotta and J. W. Swart,
Materials Science and Engineering: B, 2004, 112, 147-153.
18. K. B. K. Teo, M. Chhowalla, G. A. J. Amaratunga, W. I. Milne, D. G. Hasko, G. Pirio, P. Legagneux, F. Wyczisk and D. Pribat, Applied Physics Letters, 2001, 79, 1534-1536.
19. V. M. Chakka, B. Altuncevahir, Z. Q. Jin, Y. Li and J. P. Liu, Journal of Applied Physics, 2006, 99, 08E912.
20. T. R. Jensen, M. D. Malinsky, C. L. Haynes and R. P. Van Duyne, The Journal of Physical Chemistry B, 2000, 104, 10549-10556.
21. R. Z. Valiev, Y. Estrin, Z. Horita, T. G. Langdon, M. J. Zechetbauer and Y. T. Zhu, JOM, 2006, 58, 33-39.
22. M. A. Habeeb Muhammed, S. Ramesh, S. S. Sinha, S. K. Pal and T. Pradeep, Nano Research, 2008, 1, 333-340.
23. H. Duan and S. Nie, Journal of the American Chemical Society, 2007, 129, 2412-2413.
24. H. Qian, M. Zhu, E. Lanni, Y. Zhu, M. E. Bier and R. Jin, The Journal of Physical Chemistry C, 2009, 113, 17599-17603.
25. M. A. Habeeb Muhammed, P. K. Verma, S. K. Pal, A. Retnakumari, M. Koyakutty, S. Nair and T. Pradeep, Chemistry – A European Journal, 2010, 16, 10103-10112.
26. J. Lee, J. C. Park and H. Song, Advanced Materials, 2008, 20, 1523-1528.
27. J. Lee, J. C. Park, J. U. Bang and H. Song, Chemistry of Materials, 2008, 20, 5839-5844.
28. J. C. Park, J. U. Bang, J. Lee, C. H. Ko and H. Song, Journal of Materials Chemistry, 2010, 20, 1239-1246.
29. Y. Chen, H. Chen, L. Guo, Q. He, F. Chen, J. Zhou, J. Feng and J. Shi, ACS Nano, 2010, 4, 529-539.
30. D. K. Yi, S. T. Selvan, S. S. Lee, G. C. Papaefthymiou, D. Kundaliya and J. Y. Ying,
Journal of the American Chemical Society, 2005, 127, 4990-4991.
31. J. C. Park, H. J. Lee, J. Y. Kim, K. H. Park and H. Song, The Journal of Physical Chemistry C, 2010, 114, 6381-6388.
32. H. Zeng, W. Cai, P. Liu, X. Xu, H. Zhou, C. Klingshirn and H. Kalt, ACS Nano, 2008, 2, 1661-1670.
18 34. I. Limited, in Corrosion Resistance of Nickel and Nickel-Containing Alloys in Caustic
Soda and Other Alkalies, Nickel Development Institute, 1971, vol. 281.
35. B. D. Anderson and J. B. Tracy, Nanoscale, 2014, 6, 12195-12216.
36. J. S. Kirkaldy and J. E. Lane, Canadian Journal of Physics, 1966, 44, 2059-2072.
37. J. Wang, A. C. Johnston-Peck and J. B. Tracy, Chemistry of Materials, 2009, 21, 4462-4467.
38. M. F. Sarac, W.-C. Wu and J. B. Tracy, Chemistry of Materials, 2014, 26, 3057-3064.
39. B. Zhao, X. Guo, W. Zhao, J. Deng, B. Fan, G. Shao, Z. Bai and R. Zhang, Nano Research, 2017, 10, 331-343.
40. Y. Tang, S. Chen, S. Mu, T. Chen, Y. Qiao, S. Yu and F. Gao, ACS Applied Materials & Interfaces, 2016, 8, 9721-9732.
41. M. Javoy, E. Kaminski, F. Guyot, D. Andrault, C. Sanloup, M. Moreira, S. Labrosse, A. Jambon, P. Agrinier, A. Davaille and C. Jaupart, Earth and Planetary Science Letters, 2010, 293, 259-268.
42. I. A. Rahman and V. Padavettan, Journal of Nanomaterials, 2012, 2012, 15.
43. W. Stöber, A. Fink and E. Bohn, Journal of Colloid and Interface Science, 1968, 26, 62-69.
44. J. Choma, D. Jamioła, K. Augustynek, M. Marszewski, M. Gao and M. Jaroniec, Journal of Materials Chemistry, 2012, 22, 12636-12642.
45. J. Liu, S. Z. Qiao, H. Liu, J. Chen, A. Orpe, D. Zhao and G. Q. Lu, Angewandte Chemie International Edition, 2011, 50, 5947-5951.
46. F. J. Arriagada and K. Osseo-Asare, Colloids and Surfaces, 1992, 69, 105-115.
47. X. Zhao, R. P. Bagwe and W. Tan, Advanced Materials, 2004, 16, 173-176.
48. Y. Han, J. Jiang, S. S. Lee and J. Y. Ying, Langmuir, 2008, 24, 5842-5848.
49. H. D. Jang, Powder Technology, 2001, 119, 102-108.
50. H. Chang, J.-H. Park and H. D. Jang, Colloids and Surfaces A: Physicochemical and Engineering Aspects, 2008, 313-314, 140-144.
19 52. J. Eastoe, M. J. Hollamby and L. Hudson, Advances in Colloid and Interface Science,
2006, 128-130, 5-15.
53. D. J. McClements, Soft matter, 2012, 8, 1719-1729.
54. M. A. López-Quintela, C. Tojo, M. C. Blanco, L. Garcı́a Rio and J. R. Leis, Current Opinion in Colloid & Interface Science, 2004, 9, 264-278.
55. C. Petit, P. Lixon and M. P. Pileni, The Journal of Physical Chemistry, 1993, 97, 12974-12983.
56. P. S. Shah, J. D. Holmes, K. P. Johnston and B. A. Korgel, The Journal of Physical Chemistry B, 2002, 106, 2545-2551.
57. C. L. Kitchens, M. C. McLeod and C. B. Roberts, The Journal of Physical Chemistry B, 2003, 107, 11331-11338.
58. M.-P. Pileni, Comptes Rendus Chimie, 2003, 6, 965-978.
59. I. Capek, Advances in Colloid and Interface Science, 2004, 110, 49-74.
60. K. Holmberg, Journal of Colloid and Interface Science, 2004, 274, 355-364.
61. M. P. Pileni, Langmuir, 1997, 13, 3266-3276.
62. I. Lisiecki and M. P. Pileni, The Journal of Physical Chemistry, 1995, 99, 5077-5082.
63. Y. Berkovich, A. Aserin, E. Wachtel and N. Garti, Journal of Colloid and Interface Science, 2002, 245, 58-67.
64. C.-H. Lin, J.-H. Chang, Y.-Q. Yeh, S.-H. Wu, Y.-H. Liu and C.-Y. Mou, Nanoscale, 2015, 7, 9614-9626.
65. N. Semagina, A. Renken, D. Laub and L. Kiwi-Minsker, Journal of Catalysis, 2007, 246, 308-314.
66. G. M. Biausque, P. V. Laveille, D. H. Anjum, B. Zhang, X. Zhang, V. Caps and J.-M. Basset, ACS Applied Materials & Interfaces, 2017, 9, 30643-30653.
67. J. C. Park, H. J. Lee, H. S. Jung, M. Kim, H. J. Kim, K. H. Park and H. Song,
ChemCatChem, 2011, 3, 755-760.
68. L. Liu, S. Yue, Y. Zhang, R. Qin, L. Liu, D. Zhang, R. Sun and L. Chen, Optical Materials, 2015, 39, 207-210.
20 70. C.-L. Chang and H. S. Fogler, AIChE Journal, 1996, 42, 3153-3163.
71. A. S. Bommarius, J. F. Holzwarth, D. I. Wang and T. A. Hatton, Journal of physical chemistry, 1990, 94, 7232-7239.
72. K. Osseo-Asare and F. J. Arriagada, Colloids and Surfaces, 1990, 50, 321-339.
73. E. M. Ahmed, Journal of Advanced Research, 2015, 6, 105-121.
74. T. P. Lockhart, P. Albonico and G. Burrafato, Journal of Applied Polymer Science, 1991, 43, 1527-1532.
75. S. G. Kumbar, A. R. Kulkarni, A. M. Dave and T. M. Aminabhavi, Journal of Applied Polymer Science, 2001, 82, 2863-2866.
76. S. G. Kumbar and T. M. Aminabhavi, Journal of Applied Polymer Science, 2003, 89, 2940-2949.
77. H. Kim, R. E. Cohen, P. T. Hammond and D. J. Irvine, Advanced Functional Materials, 2006, 16, 1313-1323.
78. V. L. Alexeev, A. C. Sharma, A. V. Goponenko, S. Das, I. K. Lednev, C. S. Wilcox, D. N. Finegold and S. A. Asher, Analytical Chemistry, 2003, 75, 2316-2323.
79. J. H. Holtz and S. A. Asher, Nature, 1997, 389, 829.
80. A. Loebsack, K. Greene, S. Wyatt, C. Culberson, C. Austin, R. Beiler, W. Roland, P. Eiselt, J. Rowley, K. Burg, D. Mooney, W. Holder and C. Halberstadt, Journal of Biomedical Materials Research, 2001, 57, 575-581.
81. J. L. West, S. M. Chowdhury, A. S. Sawhney, C. P. Pathak, R. C. Dunn and J. A. Hubbell, J Reprod Med, 1996, 41, 149-154.
82. X. Zhao, K. Kato, Y. Fukumoto and K. Nakamae, International Journal of Adhesion and Adhesives, 2001, 21, 227-232.
83. E. A. Appel, J. del Barrio, X. J. Loh and O. A. Scherman, Chemical Society Reviews, 2012, 41, 6195-6214.
84. A. B. Leonardi, L. A. Fasce, I. A. Zucchi, C. E. Hoppe, E. R. Soulé, C. J. Pérez and R. J. J. Williams, European Polymer Journal, 2011, 47, 362-369.
21 86. L. Boyin and F. Jing, Journal of Micromechanics and Microengineering, 2015, 25,
065006.
87. Y. Yang, X. Ding and M. W. Urban, Progress in Polymer Science, 2015, 49-50, 34-59.
88. D. Mozhdehi, S. Ayala, O. R. Cromwell and Z. Guan, Journal of the American Chemical Society, 2014, 136, 16128-16131.
89. S. Y. Zheng, H. Ding, J. Qian, J. Yin, Z. L. Wu, Y. Song and Q. Zheng, Macromolecules, 2016, 49, 9637-9646.
90. N. Holten-Andersen, M. J. Harrington, H. Birkedal, B. P. Lee, P. B. Messersmith, K. Y. C. Lee and J. H. Waite, Proceedings of the National Academy of Sciences, 2011, 108, 2651-2655.
91. P. S. Yavvari and A. Srivastava, Journal of Materials Chemistry B, 2015, 3, 899-910.
92. D. E. Fullenkamp, L. He, D. G. Barrett, W. R. Burghardt and P. B. Messersmith,
Macromolecules, 2013, 46, 1167-1174.
93. S. C. Grindy, R. Learsch, D. Mozhdehi, J. Cheng, D. G. Barrett, Z. Guan, P. B. Messersmith and N. Holten-Andersen, Nature Materials, 2015, 14, 1210.
94. H. G. Silverman and F. F. Roberto, Marine Biotechnology, 2007, 9, 661-681.
95. J. H. WAITER, Annals of the New York Academy of Sciences, 1999, 875, 301-309.
96. X.-X. Qin and J. H. Waite, Proceedings of the National Academy of Sciences, 1998, 95, 10517-10522.
97. E. Bell and J. Gosline, The Journal of Experimental Biology, 1996, 199, 1005-1017.
98. H. Lee, N. F. Scherer and P. B. Messersmith, Proceedings of the National Academy of Sciences, 2006, 103, 12999-13003.
99. R. Y. Floriolli, J. von Langen and J. H. Waite, Marine Biotechnology, 2000, 2, 352-363.
100. J. H. Waite and X. Qin, Biochemistry, 2001, 40, 2887-2893.
101. B. P. Lee, K. Huang, F. N. Nunalee, K. R. Shull and P. B. Messersmith, Journal of Biomaterials Science, Polymer Edition, 2004, 15, 449-464.
22 103. B.-H. Im, J.-H. Jeong, M. R. Haque, D. Y. Lee, C.-H. Ahn, J. E. Kim and Y. Byun,
Biomaterials, 2013, 34, 2098-2106.
104. J.-H. Jeong, S. W. Hong, S. Hong, S. Yook, Y. Jung, J.-B. Park, C. D. Khue, B.-H. Im, J. Seo, H. Lee, C.-H. Ahn, D. Y. Lee and Y. Byun, Biomaterials, 2011, 32, 7961-7970.
105. H. Zhang, T. Zhao, B. Newland, P. Duffy, A. N. Annaidh, E. D. O'Cearbhaill and W. Wang, Journal of Materials Chemistry B, 2015, 3, 6420-6428.
106. J. Y. Kim, S. B. Ryu and K. D. Park, Journal of Industrial and Engineering Chemistry, 2018, 58, 105-112.
107. B. J. Kim, S. Kim, D. X. Oh, A. Masic, H. J. Cha and D. S. Hwang, Journal of Materials Chemistry B, 2015, 3, 112-118.
108. S. Bandyopadhyay, M. A. A. Alvi, A. Sharma, K. Zhu, A.-L. Kjøniksen, B. Nyström and W. R. Glomm, Colloid and Polymer Science, 2017, 295, 391-402.
109. S. A. Asher, Analytical chemistry, 1993, 65, 201A-210A.
110. A. Kudelski, Surface Science, 2009, 603, 1328-1334.
111. P. Larkin, Infrared and Raman Spectroscopy: Principles and Spectral Interpretation, Elsevier, 2017.
112. P. Rostron, S. Gaber and D. Gaber, Laser, 2016, 21, 24.
23 CHAPTER 3: SYNTHESIS AND CHEMICAL TRANSFORMATION OF NI
NANOPARTICLES EMBEDDED IN SILICA
The following material was published in Nanoscale (Vol. 9, No. 47, pp. 18959-18965,
2017) as “Synthesis and chemical transformation of Ni nanoparticles embedded in silica” by
Brian B. Lynch, Bryan D. Anderson, W. Joshua Kennedy, and Joseph B. Tracy. Lynch’s
contributions to this study were in the development of the synthesis, the understanding of the
organic mechanisms in play, analysis of the TEM images, and writing the manuscript. Anderson
and Kennedy provided support in the EDS mapping and XPS analysis.
3.1 Motivation
The motivation for this study was to encapsulate Ni NPs with SiO2 shells. Initially, the
NPs were intended to be used as a catalyst in the dry methane reforming (DMR) reaction. Ni is
an effective catalyst for this reaction, but when the CH4 and CO2 reactants come into contact
with the Ni catalyst, coking, or deposition of non-reactive carbon, occurs on the surface of the
catalyst and thus, deactivates it. A porous SiO2 shell is expected to provide some protection to
inhibit coking, while allowing the Ni NP core to still be accessible for DMR.
Fundamentally, the motivation for this study was to examine if the procedure developed
by a previous group member, Dr. Bryan Anderson, for quantum dot nanorods (QDNRs) could be
33 3.3 Extensions Done with Related Ni NPs
The published paper shown in section 3.2 analyzed SiO2-overcoating 27 nm Ni NPs with
a reverse micelle procedure, but further studies were also done examining the effect of
concentration, size, and composition of the Ni NPs.
The concentration of 2 mg/mL of Ni NPs was used for the studies reported in Section 3.2.
In other experiments, a deviation from that concentration was used, holding all other variables
constant. When the concentration was reduced from 2 mg/mL to 1 mg/mL, polydispersed NPs
with less incorporation of Ni NPs form (Figure 3.1). There are small pockets of SiO2 NPs, but
this system lacks shape uniformity. The Ni NPs have been reduced in size by the NH4OH at this
point, but the SiO2 has yet to encapsulate the Ni NPs. This image resembles Figure 1a in section
3.2. Reducing the concentration of Ni NPs may have affected the speed of the reaction, which
appears slower than when a higher concentration is used.
Figure 3.1: SiO2-overcoated Ni NPs synthesized with a concentration of Ni NPs of 1 mg/mL
instead of 2 mg/mL.
A second variable, size, was studied by adding 100 nm Ni NPs added to the synthesis at a
concentration of 2 mg/mL. As seen when starting with 27 nm Ni NPs, TEM images of SiO2
34 (Figure 3.2). The size of the NPs may, therefore, have little effect. An important conclusion
from these results is that NH4OH appears to etch the 100 nm Ni NPs in a similar way to the 27
nm Ni NPs.
Figure 3.2: SiO2-overcoated Ni NPs starting with Ni NPs with diameters of 100 nm.
The final variable tested was composition, using a batch of 40-50 nm Nippy NPs and a
batch of 20-45 nm CoxNiy NPs. All other variables remained constant for this synthesis. The
NixPy NPs were also incorporated into the SiO2 NPs in the same way as the 27 nm Ni NPs
(Figure 3.3). Additional testing of how the P incorporated into the SiO2-overcoated NixPy NPs
was not done, but could be of interest for the future.
Figure 3.3: SiO2-overcoated NixPy NPs were synthesized using 40-50 nm NixPy NPs and the
35 CoxNiy NPs that were synthesized with a 1:1 Co:Ni molar ratio were similarly
incorporated into SiO2 shells (Figure 3.4). The SiO2-overcoated CoxNiy NPs exhibited similar
structures to the SiO2-overcoated Ni NPs. No further analysis was completed on these NPs, but
the structure of the final product could potentially include etched pieces of both Ni and Co.
Figure 3.4: SiO2-overcoated NixCoy NPs were synthesized using 20-45 nm NixCoy NPs and the
SiO2-overcoating procedure used in the SiO2-overcoated Ni NPs.
The ratio of tetraethyl orthosilicate (TEOS):water was also varied in this procedure. In
work on the SiO2-overcoatings of QDNRs, Dr. Bryan Anderson, a previous group member,
found that changing the ratio could affect the shaping and morphological control of the SiO2
around the QDNRs.1 The SiO
2-overcoating procedure used for the SiO2-overcoated Ni NPs used
0.3 mL TEOS and 0.6 mL NH4OH. NH4OH is an aqueous solution and therefore is also source
of water for the reaction. Two brief studies were done varying this ratio: adding 0.6 mL H2O
36 These experiments showed that NH4OH etched the Ni NPs into smaller oxidized Ni NPs
throughout the course of the SiO2-overcoating reaction and was a catalyst for the reaction. When
0.6 mL H2O were added to the solution without any NH4OH, the final product showed Ni NPs
with Igepal-520 surrounding them (Figure 3.5). The SiO2-overcoating reaction did not occur,
confirming that NH4OH was necessary as a base catalyst for the SiO2-overcoating reaction.
Figure 3.5: Ni NPs overcoated with the SiO2-overcoating procedure using 0.6 mL of H2O and 0
mL of NH4OH.
The second variation on the variation of H2O in the system was to add an additional 0.6
mL of H2O to the 0.6 mL of NH4OH. While TEM images have artifacts from significant drift,
they show much larger SiO2-overcoated Ni NPs (80-100 nm) (Figure 3.6). The Ni NPs can also
be seen clearly in the SiO2 shells and appear to remain a similar size to those synthesized;
therefore, there was little to no etching of the Ni NPs that occurred. The reason for these
37 Figure 3.6: SiO2-overcoated Ni NPs using 0.6 mL NH4OH and 0.6 mL H2O.
3.4 Potential Directions Forward
Aside from the extensions of the synthetic method, collaborators have also been supplied
with SiO2-overcoated Ni NPs for investigating their performance as catalysts for DMR: Dr.
Fanxing Li (Department of Chemical and Biomolecular Engineering at NC State) and Prof.
Joshua Tong (Department of Materials Science and Engineering at Clemson University).
Additionally, Aaron Henson, an undergraduate in the Tracy group, has also conducted
experiments to try to reduce the reaction time for deposition of SiO2.
This project could also be extended to more sizes and compositions of NPs. The scale of
the synthesis was also relatively small (~150 mg/batch), so future work could include scaling up
38 3.5 References
39 CHAPTER 4: SULFIDATION AND SELENIDATION OF NI NANOPARTICLES
This manuscript “Sulfidation and Selenidation of Ni Nanoparticles” by Brian B. Lynch,
Andrew P. Kelliher, Alexander Japit, Bryan D. Anderson, and Mehmet Sarac is currently in
preparation. The primary objective of this study was to better understand the conversion
chemistry of Ni NPs to NixSy and NixSey NPs. Lynch’s contribution to this project was the
synthesis of the NixSey NPs and acquisition and analysis of TEM and XRD data. Japit conducted
the initial NixSy NP syntheses. Kelliher built on the foundation that Japit had established and
finished all of the NixSy syntheses. Anderson and Sarac contributed to this project by training
and mentoring Japit and Kelliher.
4.1 Introduction
Conversion chemistry refers to performing chemical reactions on presynthesized
nanoparticles (NPs) is changed, which is often accompanied by morphological changes, such as
void formation. The Kirkendall effect describes a mechanism for void formation in metal NPs,
when a chemical reaction causes faster outward diffusion of metal core atoms than inward
diffusion of reactive species to form a compound product. Upon accumulation of vacancies in
the core of the NPs, a void or multiple voids form within the core of the NP.1 The Kirkendall
effect has been demonstrated for reactions of many different types of NPs, including Co2,3 and
Cd.4 Ni NPs conversion chemistry is generally well-established for oxidation and phosphidation
reactions,5,6 but less is known about sulphidation and selenidation reactions. Transition metal
chalcogenide NPs have been proposed for applications in batteries, solar cells, and
supercapacitors.7 In this study, we have investigated suphidation and selenidation of Ni NPs
40 Because of the chemical similarity of S and Se, there are several similarities in
sulphidation and selenidation reactions of metal NPs.2,8-20 The solution-phase conversion of Co,
Cd, and Pb into their corresponding sulphide compounds has been reported.2,8-12 As S
precursors, these studies employed elemental S in dichlorobenzene (DCB),2,9 S in
trioctylphosphine (TOP),10,11 S in oleylamine,12 and 1-octadecanethiol.13 In other NP syntheses,
thiourea14,15 and 1-hexadecanethiol16 have been used as sulfur precursors. Similarly, as Se
precursors, selenourea in oleylamine17,18 and elemental selenium in TOP19-21 have been used. In
all of these studies, the S or Se precursor was injected into the reaction mixture at an elevated
temperature towards the end of the initial NP synthesis.
Here, we report the Kirkendall effect during sulfidation and selenidation of Ni NPs. The
effects of four different S precursors, 1-hexadecanethiol (HDT), elemental S in trioctylphosphine
(TOP:S), elemental S in oleylamine (S(OLA)), thiourea in oleylamine (TU(OLA), and two
different Se precursors, selenourea in oleylamine (SU(OLA)) and elemental Se in
trioctylphosphine (TOP:Se), on the conversion chemistry of Ni NPs were investigated. In
thiourea and selenourea, S and Se have double bonds to the central carbon, while they are singly
bonded in the other precursors. Previous studies have shown that the chemical properties of the
precursors can affect the composition, size, and morphology of the products of conversion
chemical reactions.22-24 The composition and morphology of the products were investigated, and
trends in the results for different precursors are established. Depending on the precursor chosen
and the initial composition of those precursors, different compositions might be successively
41 4.2 Experimental Methods
The S precursors were prepared and used in the following manner: HDT (Alfa Aesar,
97%) was used as received. TOP:S was prepared by mixing 0.480 g (15.0 mmol) of elemental
sulfur (Alfa Aesar, 99.999%) and 7.2 mL (21.9 mmol) of trioctylphosphine (TOP, Strem, 97%)
under inert atmosphere for 8 hours. A dispersion of S(OLA) was prepared by mixing 0.128 g
(3.99 mmol) of elemental S (Acros, 80-90%) in 2 mL (6.08 mmol) of oleylamine (Acros, 97%
primary amine) for 24 hours. A dispersion of TU(OLA) was prepared by mixing 0.608 g (7.99
mmol) of thiourea in 8 mL (24.3 mmol) oleylamine. In all syntheses, a molar ratio of 1.6 S:Ni
remained constant.
For selenidation reactions, the analogous molar ratio of 1.6 for Se:Ni was used.
Precursors for the selenidation reactions were elemental selenium (Alfa Aesar, 99.999%) in
trioctylphosphine (TOP:Se) and selenourea (Sigma-Aldrich, 98%) in oleylamine (SU(OLA)). To
make the initial solutions, 0.393 g (3.2 mmol) of selenourea was dissolved in 3.18 mL (9.67
mmol) of oleylamine and 1.32 g (16.1 mmol) of elemental selenium was dissolved in 7.2 mL
(16.1 mmol) of TOP. These solutions were left to mix for 24 hours before being used for
synthesis.
Dendritic 100 nm Ni NPs were synthesized as reported previously25 by degassing 0.5 g
(1.707 mmol) nickel acetylacetonate (Ni(acac)2∙xH2O, where x is assumed to be 2), 5 mL
(15.2mmol) oleylamine, and 4.4 g (11.4 mmol) trioctylphosphine oxide (TOPO) under vacuum
on a Schlenk line in three-necked, round-bottomed flask at 80 °C for 2 hours. The flask was then
backfilled with N2 and the reaction was heated to 230 °C for 30 minutes. A 1-mL aliquot of the
template NPs was removed from each sample as a control sample for verifying the NP size and
42 aliquots were imaged by TEM to confirm the dendritic Ni structure, which was observed for
every sample (Figure 4.1).
Sulfidation and selenidation were initiated by injecting one of the following precursors,
which contained 3 mmol of S or Se: 0.95 mL HDT, 1.47 mL TOP:S, 1.54 mL S(OLA), 3.07 mL
(TU(OLA)), 3.07 mL SU(OLA), or 1.38 mL TOP:Se dispersion into the flask of Ni NPs and
heating to 300 ° C for 30 minutes. The reaction products were purified by five cycles of
centrifugation after adding excess methanol and redispersing in hexanes.
Transmission electron microscopy (TEM) samples were prepared by dropcasting NPs
dispersed in hexanes onto Cu TEM grids with ultrathin carbon support times and imaged in a
JEOL 2000FX transmission electron microscope. Samples for X-ray diffraction (XRD) were
prepared by dropcasting highly concentrated NPs in dichloromethane onto an amorphous silica
glass slide. XRD was performed using a Rigaku SmartLab X-Ray Diffractometer with
Bragg-Brentano geometry. Refinement of the XRD data was completed using the Rietveld refinement
tools in HighScore Plus. All refinements started by subtracting out the amorphous silica
background signal that was present in the each set of data. The data were then fit with the
matching compositions. All data presented is presented in its raw form.
4.3 Results and Discussion
Template Nickel Nanoparticles. In a previous study, Ni(acac)2, oleylamine, and TOPO were
mixed and degassed at 80 °C for 2 hours before ramping to 240 °C for 30 minutes. Dendritic Ni
NPs resulted from this procedure.25 For this study, an aliquot was taken before all injections of S
or Se precursors. Figure 4.1 shows a representative TEM images and XRD spectra of a NiNP.
Though the XRD spectra was taken for the HDT sample, all other samples showed identical
43 signal from the glass slide onto which the NPs were deposited. This XRD spectra and the
accompanying TEM image are identical to those seen in the previous study.
Figure 4.1: TEM and XRD of Ni NPs in an aliquot taken before injection of each precursor, which confirm the branched structure and composition of the template NPs.
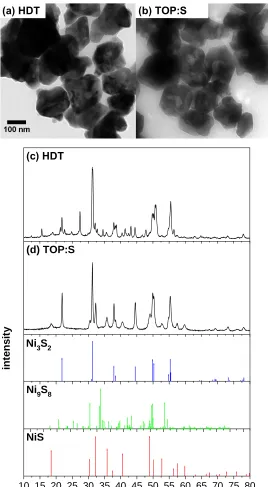
Nickel Sulfide Nanoparticles. In syntheses where HDT and TOP:S precursors were used to drive sulfidation, similar results were observed (Figure 4.2). XRD refinements done using
HighScore Plus show Ni9S8 as the predominant phase when HDT is used as the precursor (66
wt.%) and Ni3S2 (59 wt.%) as the predominant phase when TOP:S is used as the precursor. The
secondary phase for HDT was Ni3S2 at 34 wt.% and for TOP:S was NiS at 42 wt.%. All three
phases are adjacent to one another on the Ni-S phase diagram. From the Rietveld refinement, the
10 15 20 25 30 35 40 45 50 55 60 65 70 75 80
In
te
n
s
it
y
(
a
.u
.)
2θ(˚) Ni
44 composition of each sample as well as the ratio of the Ni:S within the sample was calculated
(Table 4.1). These calculations did not account for any of the residual organic molecules that
45 Figure 4.2: (a, b) TEM and (c, d) XRD of nickel sulfide NPs synthesized using HDT and TOP:S
precursors. Reference data for Ni3S2 (PDF 04-007-5742), Ni9S8 (PDF 04-007-0778), and NiS
(PDF 04-007-0707).
10 15 20 25 30 35 40 45 50 55 60 65 70 75 80
int
e
ns
it
y
Ni3S2 (d) TOP:S
2θ(˚) NiS