Volume 8, No. 3, March – April 2017
International Journal of Advanced Research in Computer Science RESEARCH PAPER
Available Online at www.ijarcs.info
ISSN No. 0976-5697
EEG Signals Analysis for motor imagery based on Curvelet Transform
Subhani Shaik Research Scholar,
Dept.of CSE, ANU, Guntur, India
Dr. Uppu Ravibabu Professor, Dept. of CSE, ANU, Guntur, India Shaik Subhani
Assist Professor, Dept. of CSE, SMWEC, Guntur, India
Abstract: EEG-based brain-computer interface is a computer-based system provides effective communication and control channels between human brain and computer to carry out a desired action. However, classification of single-trial EEG signals and controlling a device
continuously during motor imagery is a difficult task. In this paper, we propose feature extraction method for a single trial online motor imagery
using curvelet transform. These curvelet coefficients were used to extract the characters from the motor imagery EEG and classify the pattern of left and right hand movement imagery by Bayesian analysis with Gaussian model. The performance of motor imagery tested by the eye dataset for BCI competition 2003. The hypothetical results presented highest classification accuracy of 96% and superior information transfer rate is obtained.
Keywords: Electroencephalograph (EEG), Curvelet coefficients, Motor imagery, Bayesian classifier, Gaussian model, Brain-computer interface (BCI).
I. INTRODUCTION
Electroencephalograph based Brain-computer Interface provides a non-muscular communication for the generation of movement related signals to drive an assistive device. Electroencephalogram recordings during motor imagery tasks are frequently used as input signals for brain-computer interfaces [1]. Single-trial identification of motor imagery EEG is one of the key methods in the brain-computer interface. Motor imagery can modify the neuronal activity in the primary sensori motor areas, so as a result it can serve to generate self-induced variations of the EEG. One of the issues
in BCI research is the presence of superfluous data in the features of a given dataset, which not only increases the processing time but also reduces the accuracy of the classifiers [2]. Classification of Electroencephalography signal is an open area of research in Brain-computer interfacing. The classifiers detect the different mental states produced by a subject to control an external prosthesis. Brain Computer Interface techniques are used to assist disabled people to translate brain signals to control commands imitating peculiar human thoughts based on Electroencephalography signal processing [3].
We presented a novel method for motor imaginary. We mingle the curvelet transform with Gaussian model to excerpt features extra efficient for non-stationary EEG signals. This paper is organized as follows: In the next section, we discuss EEG
signal model. Section 3 describes related work. Section 4 introduces basic concepts of Naive Bayesian classifier as background work. Section 5 describes the Curvelet transform for EEG signal analysis. The results and discussions are shown in Section 6 and conclusion in Section 7.
Figure1: Brain computer interface
II. EEG SIGNAL MODEL
The EEG signals demonstrate the electrical activity of the person brain. They are extremely non-linear, non-Gaussian and non-stationary in natural world and may hold useful information concern brain state. However, it is complicated to get valuable data from these signals straightly in time domain. The
and a frequency in the scope of 1 Hz to 100 Hz. EEG signal go through changes in amplitude as well as in frequency while different mental tasks are performed. EEG based BCI is helpful for classification of mental tasks. In which EEG signal associated to various mental actions are classified and mental actions are captured[4].
Electrodes placed on the scalp for the EEG signals are registered purpose. There are two types of EEG registrations: (i) Bi-polar: Bipolar electrodes provide the voltage disparity between two scalp electrodes (ii) Mono-polar: Mono-polar registrations pick up the voltage disparity between an dynamic electrode on the scalp and a pose electrode on the ear lobe. The electric sources inside the brain produce electrical and magnetic fields that can be modeled by the Maxwell Equations .The electric current is assumed to be of the form
K(x) = σ(x) E(x) + Ki
Where σ is the conductive function, σE is the microscopic electric field and ji is the impressed current (microscopic level). During an epileptic seizure, spikes can be monitor along the EEG signals. They are mainly generated by the impressed current. Due to the high speed of dissemination of the electric waves inside the head, there is no lag in the data acquisition by the EEG recorder. Hence, in order to find the position of the effected current, we consider the EEG data instant at which one of the spikes attain its highest amplitude. Therefore, a time-frequent Maxwell equation may be used to model the relationship between the electrical potential and the impressed present K
Where H represents the head having different compartments with transition surfaces named Ti and [.] denotes the variation between the values of the functions within the brackets through the indicated surface.
Electroencephalograph based Brain-computer Interface provides a non-muscular communication to drive assistive devices using movement related signals, generated from the motor activation areas of the brain. Electroencephalogram recordings during motor imagery tasks are often used as input signals for brain-computer interfaces. Single-trial identification of motor imagery EEG is one of the key techniques in the brain-computer interface. The dimensions of the feature vector play an important role in BCI, which not only increases the computational time but also reduces the accuracy of the classifiers. Classification of Electroencephalography signal is an open area of research in
Brain-computer interfacing. The classifiers detect the different mental states generated by a subject to control an external prosthesis. There have been several algorithms developed so far for processing EEG signals. The operations include, but are not limited to, time-domain, frequency-domain, spatial-domain analysis, and multi way processing. Also, several algorithms have been developed to show the brain activity from images reconstructed from only the EEGs. The following research articles are revived and helpful for the present research work:
the application of an artificial neural network technique. In this concept different classes of EEG signals were applied: obsessive compulsive disorder, schizophrenia, and common. The classification is a three-layered feed forward network used architecture of artificial neural network in which appliance the back propagation of error learning algorithm. The wavelet transform provides a potentially dominant method for preprocessing EEG signals classified priority wise[5].
Effectively Computer Interface technology. Deep Learning algorithm was applied, EEG data classified based on Motor Imagery task,. For the classification of left and right hand motor imagery, primarily, based on certain single channel, a weak classifier was trained by deep belief net then hire the thought of Ada-boost algorithm to unite the trained weak classifiers as a more commanding one. The presentation of the DBN was tested with different combinations of hidden units and hidden layers on multiple subjects.
Single trial recognition of motor imagery EEG is one of the key techniques in the brain computer interface. To get better accuracy of classification and reduce the algorithm time, targeting at motor imagery EEG of four kinds of motion, Peng Lu, Daoren Yuan introduced a single-trial recognition algorithm of MI EEG based on HHT and SVM. Firstly, MI EEG is decomposed into 8-order intrinsic mode function and fringe R by empirical mode decomposition. Secondly, Hilbert spectrum is got by Hilbert transformation. 6-order IMF is extracted AR model parameter. The acquired 6-order AR parameter and the feature quantity of 29 power spectral density included in the 4-32 Hz EEGs constitute a 35 dimensional feature vector. So support vector machine is used to classify [6].
Umut Orhan Mahmut Hekim & Mahmut Ozera proposed a multilayer perception neural network based classification model as a diagnostic decision support system in the epilepsy treatment. The decomposition of EEG signals into frequency sub-bands by discrete wavelet transform. The group of wavelet coefficients was using the K-means algorithm for all frequency sub-bands. The probability distributions of EEG signals processed according to sharing of wavelet coefficients to the clusters, and then used as inputs to the MLPNN model. Finally, the proposed model resulted
in satisfactory classification accuracy rates [7].
IV. METHODOLOGY
A. Feature extraction using Curvelet Transform
Curvelet transform is a general mathematical tool for signal processing with many applications in EEG data analysis. It includes time-scale signal analysis, signal decomposition and signal compression. Feature extraction for
(think of an image) in a set of coefficients associated with different directions and scales. Each analysis of curvelet has its own time duration, time location and frequency band. The curvelet coefficient derive from the curvelet transformation corresponds to assessment of the ECG components in this time segment and frequency band.
The most common used feature extraction methods
for EEG signal analysis are autoregressive Models, power spectral density, wavelet transform and Curvelet transform. Discrete curvelet transform has good signal compression properties; it is applicable for many real signals and it is also computationally efficient. For these reasons it is used for many purposes including image compression, noise reduction, numerical integration and pattern recognition. Curvelet transform is a multi-directional and multi-scale transform. Its source functions are pointer shaped and have high directional nervousness and anisotropy. First, describe x as space position parameter, w as frequency domain parameter and (r, 𝜃𝜃}) as polar frequency domain in the 2-dimentional space R2
∑∞𝑗𝑗=−∞𝑍𝑍P
2
. Z(r) and V(r) are flat non-negative “radius window” and “corner window” correspondingly, and they must satisfy [9]:
(2j
For all scales j>=j0, define its Fourier frequency domain window:
j(r, Ɵ ) = 2 -3𝑗𝑗
4 Z(2 -j
Frequency domain, curvelet transform is defined as product of 𝜑𝜑
Curvelet also include components on coarse and fine scale, the same as wavelet theory. Introduce a low-pass window Z0
|𝑍𝑍0(𝑟𝑟) |P and it takes the form of basic elements, which exhibit a very high directional compassion and are extremely anisotropic. In two dimensions, for instance, curvelets are more suitable for the processing of image edges such as curve and line characteristics than wavelet. The local ridgelet based curvelet transform decompose the image into a sequence of disjoint scales using the` trous wavelet transform. Then, each scale is evaluated by means of a local ridgelet transform. The 2-D continuous curvelet transform in R We define that y be a spatial variable, 𝜔𝜔 is a frequency-domain variable, in the frequency frequency-domain. Z(r) and V (t) is pair of windows reacts to radial and angular. They are all smooth, nonnegative and real valued arguments and supported on r ∈ [1/2, 2] and t ∈ [-1, 1]. Also, they will always accept
Fourier domain is defined by the support of Z and V, the radial and angular windows, applied with scale-dependent window widths in each direction
Digital curvelet transforms can also be operated in the frequency domain, and it will be helpful to apply Plancherel’s theorem and state the inner product as the integral over the frequency plane
), the curvelet coefficients is defined by
B. Feature extraction using Gaussian distribution
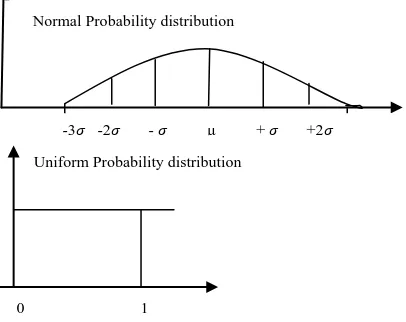
Signals produced from random processes usually have a bell shaped probability density function is called normal distribution and it is also known as a gauss distribution. It is broadly used model for random fluctuations or noise. The Normal distribution of X with mean μ and variance 𝜎𝜎P moments of normal distribution obtainable from the pdf as
In fact, with a change of variables, eqn (2) may rewritten as
In signal processing, it is necessary produce normally distributed random data where distribution follows that normal (Gaussian) curve.
Figure 1. Normal and uniform probability
We will produce a huge data set of points from a known Gaussian distribution. Mathcad has a built in function,
RNORM (N, µ, σ) which precedes a vector of N data points,
where the points are pull from a Gaussian distribution with mean µ and standard deviation σ.
C. Feature classification using Bayesian Analysis
Naive Bayes classifiers is a simple and effective technique for classifiers algorithm .It is depends on Bayes theory with powerful independence expectation, i.e a naive Bayes classifier assumes that the presence or absence of a precise feature is independent to the presence/absence of any other feature, given the class variable. Based on class conditional density assessment and class prior probability, the posterior class probability of a test data point can be borrowed and the test data will be accredit to the class with the maximum posterior class probability. For some class of probability models, naive Bayes methods can be trained very efficiently in a supervised learning setting. Bayes' theorem is used for calculating conditional probabilities.
The conditional Probability that an incident γ will happen, given that δ has occurred and stand by P (A\B) is define by
P (γ/δ) = p(γ∩δ)
p(δ) ; P (δ) >0 (1)
The Probability of the immediate occurrence of two events γ and δ is equal to the product of probability of γ and the conditional Probability of δ on the expectation that γ existed. From (1) & (2)
i.e. P (γ∩δ) =P (γ). P (δ /γ) =P (δ). P (γ /δ) (2)
P (γ /δ) = P (γ). P (δ /γ) / P (δ)…… ….. (3)
If (γ∩δ) and (γ∩δ') are equally elite tasks then by axiomatic definition
P (γ) = P (δ) .P (γ /δ) + P (δ ') .P (γ /δ ').. (4) From (3) & (4)
P (γ /δ) = P (δ) .P (P (γ/δδ) + P () .P (γδ/δ′) .P () γ/δ′) ……….. (5)
If δ 1, δ 2, δ 3…... δ n are n mutually exclusive events of which one of the event occur then
P (γ) = ∑i=ni=1 P (δi) . P (γ / δi) ………….. (6)
From (3) P (γ /δ) = P (γ).P (δ/γ)
∑i=ni=1 P (δi).P(δγi) ………. (7)
Bayes’ theorem provides a way to calculating the posterior probability, P(γ /δ) from P(δ), P(δ /γ) and P(γ).
The naive Bayesian classifier works as follows:
Input: D, a training set of associated class labels and their tuples.
γ: (γ1, γ2, ……, γn) is an n-dimensional attribute vector. A: (A1, A2, …..., An) n measurements made on the tuple from n attributes, respectively,.
Output: δ :( δ1, δ2, ...…, δm) be m no of classes. Method:
Let γ is given tuple; the classifier will predict that γ belongs to the class having the maximum posterior probability, conditioned on γ.
The naive Bayesian classifier predicts that tuple X belongs to the class δi if and only i
P (δi / γ) > P (δj / γ) for 1 <=j <=m, j ≠ i.
The class δi for which P (δi / γ) is maximized is called the maximum posteriori hypothesis. By Bayes’ theorem
. P (δi / γ) = P (δi).P (γ/δi)
∑i=ni=1 P (γi).P(γδi)
Prior probabilities P(γ) is constant for all classes, only P(γ /δi) P(δi) needs to be maximized.
If the class prior probabilities are not known, then it is commonly assumed that the classes are equally.
i.e P(δ1) = P(δ2) = …. = P(δm)
The class prior probabilities may be estimated by P(δi) = ⌊δi, D⌋/|D|, where �δi, Dj�is the number of training tuples of class δi in D.
To reduce computation in evaluating P(γ /δi), the naive assumption of class-conditional independence is made. Thus,
P(γ /δi) = = ∏nk=1P(γj/ δl)
P(γ /δi) = P(γ1/δi) * P(x2/δi) *…* P(γn/ δi)
For continuous attributes, we compute P(γ/ δi), by considering a Gaussian distribution with a mean μ, and standard deviationσ.
P(yj ≤ Yj ≤ Yj + Δ / Y = yj = ∫xixi+ ∆f( x ; μ, σ2 ) dx ≈ f (x ; μ, σ2 ) * ∆, where Δ is a petite constant.
To foresee the class label of X, P (δi / γ) P (δi) is appraise for each class δi .
The classifier foresee that the class label of tuple γ is the class δi if and only i
P (δi / γ) P (δi) > P (δj / γ) P (δj) for 1 <=j <=m, j ≠ i. Uniform Probability distribution
0 1
-3𝜎𝜎 -2𝜎𝜎 -𝜎𝜎 µ +𝜎𝜎 +2𝜎𝜎
Normal Probability distribution
Pr{X ≤ xa} = 0.5 - erf (𝜇𝜇 − 𝑥𝑥a ) / 𝜎𝜎 for xa≤ 𝜇𝜇
In other words, the foresee class label δi for which P (δi / γ)P (δRi
V. PROPOSED WORK ) is the highest.
The core benefit of Naive Bayes is that it merely craves a little amount of training data to except the parameters essential for classification. It also show high accuracy and speed when applied to large databases.
The flow of processing single-trial motor imagery EEG signal analysis based on curvelet transform sing is shown Figure-1. First, EEG signals are passed to a temporal filter in
temporal domain. These signals are break down into the frequency sub bands using discrete curvelet transform. Statistical features are extorting from the sub bands to stand for the sharing of curvelet coefficients. Next, the characteristics of curvelet coefficients are used as input vector. Finally Bayesian analysis based on Gaussian allocation was employ to classify characteristics into various categories that display the left or right hand movement imagery.
Figure 2: Flow of processing single-trial motor imagery EEG signal analysis
The step-by-step procedure used for processing EEG signals using curvelet transform is:
Algorithm: Signal analysis based on Curvelet Transform
Task:
Apply the curvelet transform on EEG signals for BCI.Parameter:
Eye data set X and Bayesian classifier.Initialization:
Y = SMOOTH (X, SPAN)
Decompose the signal into Frequency sub band Fj with block size Sj.
∑∞j=−∞Z2 (2jr) =1, r ∈� 3 4 ,
3
2 �
∑∞ V
j=−∞ 2 (2jr) =1, r ∈�−2 ,1 12 �
1. Compute the curvelet coefficients of X with J scales, get { C1,……….Cj , Dj } by
Uj(r, Ɵ ) = 2-3j
4 Z(2-j , r ) V� 2j/2θ
2π �
2. Apply the digital Curvelet transform to each block; get the curvelet coefficients at scale j
3. Bayesian analysis based on Gaussian distribution was utilized to classify features into different categories
P (δi / γ) = P (δi).P (γ/δi)
∑i=ni=1 P (γi).P(γδi)
Output: The curvelet transform on EEG signal of X gives a lower classification error rate and
Higher information transfer rate.
C ( j, l. k ) = (f ,
𝜑𝜑
j,l.k(Y) ) =
∫
R2f (X)
𝜑𝜑
j,l.k(Y) d(Y)
VI. RESULTS AND DISCUSSION
In this paper, we presented the implementation of curvelet transform for EEG signals. Here, two-dimensional ECG signals are decomposes in a set of coefficients associated with different directions and scales. The combination of statistical curvelet and Gaussian coefficients were selected as inputs of Bayesian classifier. Bayesian analysis was utilized to classify features into different classes that represent the left or
right hand movement imagery and experimental results showed in the below figures. Also the results indicate that method of combining DCT with Gaussian model are able of extracting more useful information from the simultaneously acquired motor imagery EEG. The performance was tested by the eye dataset for BCI competition 2003. Statistical results shows maximum classification accuracy of 95% and higher information transfer rate is achieved.
Figure 3. Parametric Modeling of EEG Data for the Identification of left or right hand movement imagery tasks.
VII. CONCLUSION
EEG signals analysis is accurate, simple and reliable enough to use in brain computer interface. In this paper, we proposed, a curvelet based motor imagery feature extraction method based on curvelet transform. Feature extraction method for a single trial online motor imagery using curvelet transform. These curvelet coefficients were used to extract the characters from the motor imagery EEG and classify the pattern of left and right hand movement imagery by Bayesian analysis with Gaussian model. The achievement of motor imagery tested by the eye dataset for BCI competition 2003. The hypothetical results presented highest classification accuracy of 96% and superior information transfer rate is obtained.
VIII. ACKNOWLEDGEMENT
Authors are thankful to Dr.U.Ravi Babu and Dr.D.Nagaraju, Professors, Dept. of computer science & engineering, for giving continues support and encouragement to carry out this work. Authors are also thankful to the reviewer for critically going through the manuscript and giving valuable suggestions for the improvement of manuscript.
IX. REFERENCE
[2] J. R. Wolpaw, N. Birbaumer & D. J. McFarland, et al. Brain computer interface for communication and control. Clinical Neurophysiology 2002, 113:767-791.
[3] G. Pfurstcheller & C. Neuper. Motor imagery and Direct Brain Computer Communication. Proc. IEEE 2001, 89:1123-1134. [4] B. Blankertz, K. R. Muller & G. Curio, et al. BCI Competition
2003-Progress and perspectives in Detection and Discrimination of EEG Single Trials. IEEE Trans. Rehabil. Eng. 2004, 51:1044-1051.
[5] Neep Hazarika Jean Zhu Chen Ah Chung Tsoi Alex Sergejew," Classification of EEG signals using the wavelet transform"in 13th International Conference on Digital Signal Processing, 2-4 July 1997, vol-I,ISBN: 0-7803-2-4137-6.
[6] J. R. Wolpaw, N. Birbaumer & D. J. McFarland, et al. Brain computer interface for communication and control. Clinical Neurophysiology 2002, 113:767-791.
[7] Lu P., Yuan D., Lou Y., Liu C., Huang S. (2013) Single-Trial Identification of Motor Imagery EEG based on HHT and SVM. In: Sun Z., Deng Z. (eds) Proceedings of 2013 Chinese Intelligent Automation Conference. Lecture Notes in Electrical Engineering, vol 256. Springer, Berlin, Heidelberg.
[8] classification using the K-means clustering and a multilayer perceptron neural network model" 13475–13481.
[9] A. Schlögl, C. Neuper & G. Pfurtscheller. Estimating the mutual information of an EEG-based Brain-Computer Interface. Biomedizinische. Technik. 2002, 47:3-8.
[10] G. Pfurstcheller & F. H. Lopes da Silva. Event-related EEG/MEG synchronization and desynchronizaiton: basic principles. Clinical Neurophysiology 1999, 110:1842-1857. [11] Emmanuel Candes, Laurent Demanet, David Donoho and
Lexing Ying “Fast Discrete Curvelet Transforms” July 2005, revised March 2006.
Author’s Profile
Subhani Shaik is a Research Scholor in the Dept.of CSE, Acharya Nagarjuna University, Andhra Pradesh, India. He received Bachelor of Technology B.Tech degree from Andhra University, in 2002. M.Tech from JNTUH, in 2011. His Research area in Image Processing and Data Mining. Research interests are Computer Networks, Cloud Computing and Soft Computing. He published many Research papers in National and International conferences and journals.
Dr.Uppu Ravibabu Received PhD from Acharya Nagarjuna University, Guntur, India. Currently working as Professor, in the Dept. of CSE. His research areas include Image Processing and Network security. He published many Research papers in National and International conferences and journals.
Shaik Subhani currently is working as Asst. Professor, in the Dept. of CSE, St. Mary's Women’s Engineering College, Guntur, and Andhra Pradesh, India. His research interests are Computer