Coling 2008: Proceedings of the workshop on Multi-source Multilingual Information Extraction and Summarization,pages 17–24
Graph-Based Keyword Extraction for Single-Document Summarization
Marina Litvak Department of
Information System Engineering Ben-Gurion University of the Negev
Beer-Sheva 84105, Israel [email protected]
Mark Last Department of
Information System Engineering Ben-Gurion University of the Negev
Beer-Sheva 84105, Israel [email protected]
Abstract
In this paper, we introduce and compare between two novel approaches, supervised and unsupervised, for identifying the key-words to be used in extractive summa-rization of text documents. Both our ap-proaches are based on the graph-based syntactic representation of text and web documents, which enhances the traditional vector-space model by taking into account some structural document features. In the supervised approach, we train classifica-tion algorithms on a summarized collec-tion of documents with the purpose of inducing a keyword identification model. In the unsupervised approach, we run the HITS algorithm on document graphs under the assumption that the top-ranked nodes should represent the document keywords. Our experiments on a collection of bench-mark summaries show that given a set of summarized training documents, the su-pervised classification provides the highest keyword identification accuracy, while the highest F-measure is reached with a sim-ple degree-based ranking. In addition, it is sufficient to perform only the first iteration of HITS rather than running it to its con-vergence.
1 Introduction
Document summarization is aimed at all types of electronic documents including HTML files with
c
2008. Licensed under the Creative Commons Attribution-Noncommercial-Share Alike 3.0 Unported li-cense (http://creativecommons.org/licenses/by-nc-sa/3.0/). Some rights reserved.
the purpose of generating the summary - main doc-ument information expressed in ”a few words”.
In this paper, we introduce and compare be-tween two approaches: supervised and unsuper-vised, for the cross-lingual keyword extraction to be used as the first step in extractive summarization of text documents. Thus, according to our problem statement, the keyword is a word presenting in the document summary.
The supervised learning approach for keywords extraction was first suggested in (Turney, 2000), where parametrized heuristic rules were combined with a genetic algorithm into a system GenEx -that automatically identified keywords in a docu-ment.
For both our approaches, we utilize a graph-based representation for text documents. Such rep-resentations may vary from very simple, syntactic ones like words connected by edges representing co-occurrence relation (Mihalcea and Tarau, 2004) to more complex ones like concepts connected by semantic relations (Leskovec et al., 2004). The main advantage of a syntactic representation is its language independency, while the semantic graphs representation provide new characteristics of text such as its captured semantic structure that it-self can serve as a document surrogate and pro-vide means for document navigation. Authors of (Leskovec et al., 2004) reduce the problem of sum-marization to acquiring machine learning models for mapping between the document graph and the graph of a summary. Using deep linguistic anal-ysis, they extract sub-structures (subjectpredica-teobject triples) from document semantic graphs in order to get a summary. Contrary to (Leskovec et al., 2004), both our approaches work with a syn-tactic representation that does not require almost any language-specific linguistic processing. In
this paper, we perform experiments with directed graphs, where the nodes stand for words/phrases and the edges represent syntactic relationships be-tween them, meaning ¨followed by¨ (Schenker et al., 2005).
Some of the most successful approaches to ex-tractive summarization utilize supervised learn-ing algorithms that are trained on collections of ”ground truth” summaries built for a relatively large number of documents (Mani and Maybury, 1999). However, in spite of the reasonable perfor-mance of such algorithms they cannot be adapted to new languages or domains without training on each new type of data. Our first approach also utilizes classification algorithms, but, thanks to the language-independent graph representation of documents, it can be applied to various lan-guages and domains without any modifications of the graph construction procedure (except for the technical upgrade of implementation for multi-lingual processing of text, like reading Unicode or language-specific encodings, etc.) (Markov et al., 2007; Last and Markov, 2005). Of course, as a su-pervised approach it requires high-quality training labeled data.
Our second approach uses a technique that does not require any training data. To extract the sum-mary keywords, we apply a ranking algorithm called HITS (Kleinberg, 1999) to directed graphs representing source documents. Authors of (Mi-halcea and Tarau, 2004) applied the PageRank al-gorithm (Brin and Page, 1998) for keyword extrac-tion using a simpler graph representaextrac-tion (undi-rected unweighted graphs), and show that their re-sults compare favorably with rere-sults on established benchmarks of manually assigned keywords. (Mi-halcea and Tarau, 2004) are also using the HITS algorithm for automatic sentence extraction from documents represented by graphs built from sen-tences connected by similarity relationships. Since we work with directed graphs, HITS is the most appropriate algorithm for our task as it takes into account both in-degree and out-degree of nodes. We show in our experiments that running HITS till convergence is not necessary, and initial weights that we get after the first iteration of algorithm are good enough for rank-based extraction of sum-mary keywords. Another important conclusion that was infered from our experimental results is that, given the training data in the form of anno-tated syntactic graphs, supervised classification is
the most accurate option for identifying the salient nodes in a document graph, while a simple degree-based ranking provides the highest F-measure.
2 Document representation
Currently, we use the ”simple” graph representa-tion defined in (Schenker et al., 2005) that holds unlabeled edges representing order-relationship between the the words represented by nodes. The stemming and stopword removal operations of ba-sic text preprocessing are done before graph build-ing. Only a single vertex for each distinct word is created even if it appears more than once in the text. Thus each vertex label in the graph is unique. If a wordaimmediately precedes a word
b in the same sentence somewhere in the docu-ment, then there is a directed edge from the ver-tex corresponding to term a to the vertex corre-sponding to termb. Sentence terminating punctu-ation marks (periods, question marks, and excla-mation points) are taken by us into account and an edge is not created when these are present be-tween two words. This definition of graph edges is slightly different from co-occurrence relations used in (Mihalcea and Tarau, 2004) for building undirected document graphs, where the order of word occurrence is ignored and the size of the co-occurrence window is varied between 2 and 10. Sections defined for HTML documents are: title, which contains the text related to the document’s title and any provided keywords (meta-data) and
text, which comprises any of the readable text in the document. This simple representation can be extended to many different variations like a se-mantic graph where nodes stand for concepts and edges represent semantic relations between them or a more detailed syntactic graph where edges and nodes are labeled by significant information like frequency, location, similarity, distance, etc. The syntactic graph-based representations were shown in (Schenker et al., 2005) to outperform the clas-sical vector-space model on several clustering and classification tasks. We choose the ”simple” repre-sentation as a reprerepre-sentation that saves processing time and memory resources as well as gives nearly the best results for the two above text mining tasks.
3 Keywords extraction
summary. Since each distinct word in a text is rep-resented by a node in the document graph, the key-words extraction problem is reduced to the salient nodes extraction in graphs.
3.1 The Supervised approach
In this approach, we try to identify the salient nodes of document graphs by training a classifi-cation algorithm on a repository of summarized documents such as (DUC, 2002) with the purpose of inducing a keyword identification model. Each node of every document graph belongs to one of two classes: YES if the corresponding word is in-cluded in the document extractive summary and NO otherwise. We consider the graph-based fea-tures (e.g., degree) characterizing graph structure as well as statistic-based features (Nobata et al., 2001) characterizing text content represented by a node. The complete list of features, along with their formal definitions, is provided below:
• In Degree- number of incoming edges
• Out Degree- number of outcoming edges
• Degree- total number of edges
• Frequency - term frequency of word repre-sented by node1
• Frequent words distribution ∈ {0,1}, equals to1iffFrequency≥threshold2
• Location Score- calculates an average of lo-cation scores between all sentences3
contain-ing the wordN represented by node (denote these sentences asS(N)):
Score(N) = P
Si∈S(N)Score(Si)
|S(N)|
• Tfidf Score - calculates the tf-idf
score (Salton, 1975) of the word repre-sented by node4.
1The term frequency (TF) is the number of times the word
appears in a document divided by the number of total words in the document.
2In our experiment the threshold is set to0.05
3There are many variants for calculating sentence location
score (Nobata et al., 2001). In this paper, we calculate it as an reciprocal of the sentence location in text:Score(Si) = 1i
4There are many different formulas used to calculatetfidf.
We use the next formula: tf
tf+1log2|D|df , wheretf- term
fre-quency (as defined above),|D|- total number of documents in the corpus,df- number of documents where the term appears.
• Headline Score∈ {0,1}, equals to1iff doc-ument headline contains word represented by node.
3.2 The Unsupervised approach
Ranking algorithms, such as Kleinberg’s HITS algorithm (Kleinberg, 1999) or Google’s PageR-ank (Brin and Page, 1998) have been elaborated and used in Web-link analysis for the purpose of optimizating the search performance on the Web. These algorithms recursively assign a numerical weight to each element of a hyperlinked set of doc-uments, determining how important each page is. A hyperlink to a page counts as a vote of support. A page that is linked to by many important pages (with high rank) receives a high rank itself. A similar idea can be applied to lexical or seman-tic graphs extracted from text documents, in or-der to extract the most significant blocks (words, phrases, sentences, etc.) for the summary (Mi-halcea and Tarau, 2004; Mi(Mi-halcea, 2004). In this paper, we apply the HITS algorithm to document graphs and evaluate its performance on automatic unsupervised text unit extraction in the context of the text summarization task. The HITS algorithm distinguishes between ”authorities” (pages with a large number of incoming links) and ”hubs” (pages with a large number of outgoing links). For each node, HITS produces two sets of scores - an ”au-thority” score, and a ”hub” score:
HIT SA(Vi) =
X
Vj∈In(Vi)
HIT SH(Vj) (1)
HIT SH(Vi) =
X
Vj∈Out(Vi)
HIT SA(Vj) (2)
For the total rank (H) calculation we used the following four functions:
1. rank equals to the authority score
H(Vi) =HIT SA(Vi)
2. rank equals to the hub score
H(Vi) =HIT SH(Vi)
3. rank equals to the average between two scores
H(Vi) =avg{HIT SA(Vi), HIT SH(Vi)}
4. rank equals to the maximum between two scores
average merit rank feature
0.192 +- 0.005 1 Frequent words distribution
0.029 +- 0 2 In Degree
0.029 +- 0 3 Out Degree
0.025 +- 0 4 Frequency
0.025 +- 0 5 Degree
0.017 +- 0 6 Headline Score
0.015 +- 0 7 Location Score
[image:4.595.178.423.72.196.2]0.015 +- 0.001 8 Tfidf Score
Table 1: Feature selection results according to GainRatio value
0.824 0.826 0.828 0.830 0.832 0.834 0.836 0.838 0.840 0.842
8 7 6 5 4 3 2 1
size of the feature set
accuracy
NBC accuracy MR lower bound MR upper bound
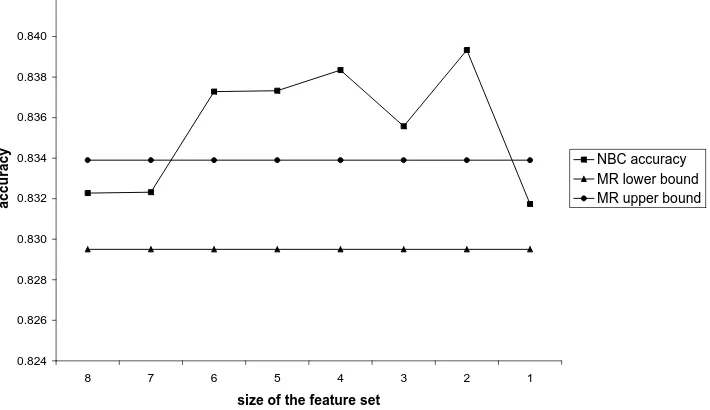
Figure 1: Accuracy for Na¨ıveBayes classifier (NBC) and Majority Rule (MR)
4 Experimental results
All experiments have been performed on the collection of summarized news articles pro-vided by the Document Understanding Conference 2002 (DUC, 2002). This collection contains 566 English texts along with 2-3 summaries per doc-ument on average. The size5 of syntactic graphs
extracted from these texts is196on average, vary-ing from62to876.
4.1 Supervised approach
We utilized several classification algorithms im-plemented in Weka’s software (Witten and Frank, 2005) : J48 (known as C4.5), SMO (Support Vec-tor Machine) and Na¨ıveBayes for building binary classification models (a word belongs to summary / does not belong to the summary). For the training we built dataset with two classes: YES for nodes belonging to at least one summary of the
docu-5We define the size of a graph as the number of its vertices.
ment, and NO for those that do not belong to any summary. The accuracy of the default (majority) rule over all nodes is equal to the percentage of non-salient nodes (83.17%). For better classifica-tion results we examined the importance of each one of the features, described in Section 3.1 using automated feature selection. Table 1 presents the average GainRatio6values (”merits”) and the
aver-age rank of the features calculated from the DUC 2002 document collection, based on 10-fold cross validation.
As expected, the results of J48 and SMO (these algorithms perform feature selection while build-ing the model) did not vary on different feature sets, while Na¨ıveBayes gave the best accuracy on the reduced set. Figure 1 demonstrates the accu-racy variations of Na¨ıveBayes classifier on the dif-ferent feature sets relative to the confidence
inter-6Gain Ratio(A) = Information Gain(A)
Intrinsic Info(A) , where
Intrinsic Info(A) =−PxNx
N log
N
x
N
[image:4.595.118.473.237.442.2]0 0.1 0.2 0.3 0.4 0.5 0.6 0.7 0.8 0.9 1
0 0.1 0.2 0.3 0.4 0.5 0.6 0.7 0.8 0.9 1
False Positives
[image:5.595.157.436.71.245.2]True Positives
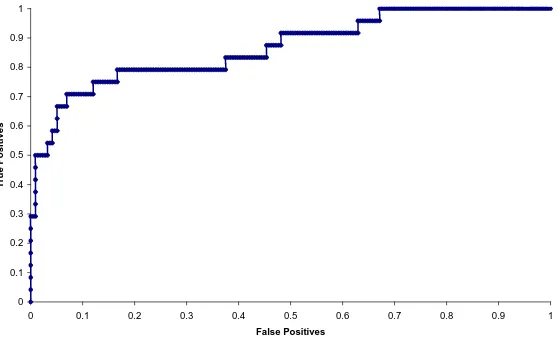
Figure 2: Sample ROC curve for one of the DUC’02 documents
Ranking function Degree vectors Converged vectors
Authority 0.625 0.600
Hub 0.620 0.601
Avg(Authority, Hub) 0.651 0.622
[image:5.595.159.439.278.351.2]Max(Authority, Hub) 0.651 0.624
Table 2: Average AUC for each rank calculating function
val for the majority rule accuracy according to the normal approximation of the binomial distribution with α = 0.05. Table 3 presents classification results for supervised algorithms (for Na¨ıveBayes the results shown on the top 2 features) based on 10-fold cross validation as well as results of unsu-pervised learning.
4.2 Unsupervised approach
We have studied the following research questions: 1. Is it possible to induce some classification
model based on HITS scores?
2. Is it necessary to run HITS until convergence? In order to answer these questions we performed the following two experiments:
1. In the first one, we run HITS only one it-eration. Note, that the ranks resulted from the first iteration are just in-degree and out-degree scores for each node in graph, and may be easily computed without even starting HITS7.
7Initially, both authority and hub vectors (aandh
respec-tively) are set tou = (1,1, . . . ,1). At each iteration HITS sets an authority vector toa = ATh, and the hub vector to h=Aa, whereAis an adjacency matrix of a graph. So, after the first iteration,a = ATuandh =Au, that are the
vec-tors containing in-degree and out-degree scores for nodes in a graph respectively.
2. In the second experiment we run HITS until convergence8 (different number of steps for
different graphs) and compare the results with the results of the first experiment.
After each experiment we sorted the nodes of each graph by rank for each function (see the rank calculating functions described in Section 3.2). After the sorting we built an ROC (Receiver Op-erating Characteristic) curve for each one of the graphs. Figure 2 demonstrates a sample ROC curve for one of the documents from DUC 2002 collection.
In order to compare between ranking functions (see Section 3.2) we calculated the average of AUC (Area Under Curve) for the 566 ROC curves for each function. Table 2 presents the average AUC results for the four functions. According to these results, functions that take into account both scores (average and maximum between two scores) are optimal. We use theaveragefunction for compar-ing and reportcompar-ing the followcompar-ing results. Also, we can see that degree vectors give better AUC results
8There are many techniques to evaluate the convergence
achievement. We say that convergence is achieved when for any vertexiin the graph the difference between the scores computed at two successive iterations falls below a given threshold: |xki+1−xki|
xk
i <10
−3(Kamvar, 2003; Mihalcea and
0 5 10 15 20 25 30 35
1 29 57 85 113 141 169 197 225 253 281 309 337 365 393 421 449 477 505 533 561 589
number of words
cumulative AUC
[image:6.595.142.448.73.297.2]degree-ranked words HITS-ranked words
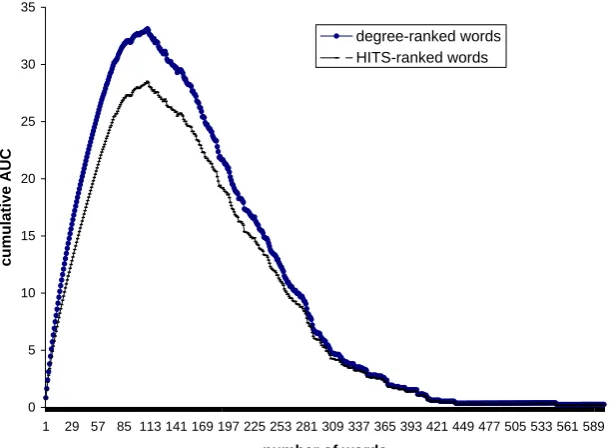
Figure 3: Cumulative AUC curves for degree and converged vectors
Method Accuracy TP FP Precision Recall F-Measure
Classification J48 0.847 0.203 0.022 0.648 0.203 0.309
Na¨ıveBayes 0.839 0.099 0.011 0.648 0.099 0.172
SMO 0.839 0.053 0.002 0.867 0.053 0.100
Degree-based N = 10 0.813 0.186 0.031 0.602 0.186 0.282
Ranking N = 20 0.799 0.296 0.080 0.480 0.296 0.362
N = 30 0.772 0.377 0.138 0.409 0.377 0.388
N = 40 0.739 0.440 0.200 0.360 0.440 0.392
Table 3: Results for each supervised and unsupervised method
than converged ones.
In order to compare between the degree-based vectors and the converged ones we calculated the precision curves9 for each graph in both
ex-periments. Then for each ranking method the curve representing an average cumulative AUC over the566precision curves was calculated. Fig-ure 3 demonstrates the difference between result-ing curves. As we can conclude from this chart, the degree-based vectors have a slight advantage over the converged ones. The ”optimum” point where the average AUC is maximum for both methods is 111 words with the average AUC of
28.4 for degree-based words and 33 for HITS-ranked words. That does not have much signifi-cance because each document has a different ”op-timum” point.
9For each number of top ranked words the percentage of
positive words (belonging to summary) is shown.
Finally, we compared the results of unsuper-vised method against the superunsuper-vised one. For this purpose, we consider unsupervised model based on extracting topN ranked words for four differ-ent values ofN: 10,20,30 and40. Table 3 rep-resents the values for such commonly used met-rics as: Accuracy, True Positive Rate, False Posi-tive Rate, Precision, Recall and F-Measure respec-tively for each one of the tested methods. The op-timal values are signed in bold.
[image:6.595.87.511.343.454.2]against 39%) though our method requires much less linguistic pre-processing and uses a much smaller feature set (466features against8). (Mi-halcea and Tarau, 2004) includes a more similar task to ours (single keyword extraction) though the definition of a keyword is different (”keywords manually assigned by the indexers” against the ”summary keywords”) and a different dataset (In-spec) was used for results presentation.
5 Conclusions
In this paper we have proposed and evaluated two graph-based approaches: supervised and unsuper-vised, for the cross-lingual keyword extraction to be used in extractive summarization of text docu-ments. The empirical results suggest the follow-ing. When a large labeled training set of summa-rized documents is available, the supervised classi-fication is the most accurate option for identifying the salient keywords in a document graph. When there is no high-quality training set of significant size, it is recommended to use the unsupervised method based on the node degree ranking, which also provides a higher F-measure than the super-vised approach. The intuition behind this conclu-sion is very simple: most words that are highly ”interconnected” with other words in text (except stop-words) should contribute to the summary. Ac-cording to our experimental results, we can extract up to 15 words with an average precision above
50%. Running HITS to its convergence is redun-dant, since it does not improve the initial results of the degree ranking.
6 Future work
The next stage of our extractive summarization methodology is generation of larger units from the selected keywords. At each step, we are going to reduce document graphs to contain larger units (subgraphs) as nodes and apply some ranking al-gorithms to the reduced graphs. This algorithm is iterative, where graph reduction steps are repeated until maximal subgraph size is exceeded or another constraint is met. Also, we plan to work on the su-pervised classification of sub-graphs, where many graph-based features will be extracted and evalu-ated.
In the future, we also intend to evaluate our method on additional graph representations of doc-uments, especially on the concept-based represen-tation where the graphs are built from the
con-cepts fused from the texts. Once completed, the graph-based summarization methodology will be compared to previously developed state-of-the-art summarization methods and tools. All ex-periments will include collections of English and non-English documents to demonstrate the cross-linguality of our approach.
References
S. Brin and L. Page. 1998. The anatomy of a large-scale hypertextual Web search engine. Computer Networks and ISDN Systems, 30:1–7.
Document Understanding Documents 2002 [http://www-nlpir.nist.gov/projects/duc/index.html]
Sepandar D. Kamvar, Taher H. Haveliwala, and Gene H. Golub. Adaptive methods for the computation of pagerank. Technical report, Stanford University.
Kleinberg, J.M. 1999. Authoritative sources in a hyperlinked environment. Journal of the ACM, 46(5):604-632.
Last, M. and Markov A. 2005.Identification of terror-ist web sites with cross-lingual classiffication tools. In Last, M. and Kandel, A. (Editors), Fighting Terror in Cyberspace. World Scientific, Series in Machine Perception and Artificial Intelligence, 65:117–143.
Leskovec, J., Grobelnik, M. and Milic-Frayling, N. 2004. Learning Semantic Graph Mapping for Document Summarization. In Proceedings of ECML/PKDD-2004 Workshop on Knowledge Dis-covery and Ontologies.
Mani, I. and Maybury, M.T. 1999. Advances in Auto-matic Text Summarization. MIT Press, Cambridge, MA.
Markov A., Last, M. and Kandel, A. 2007. Fast Categorization of Web Documents Represented by Graphs. Advances in Web Mining and Web Usage Analysis - 8th International Workshop on Knowl-edge Discovery on the Web, WEBKDD 2006, Re-vised Papers, O. Nasraoui, et al. (Eds). Springer Lecture Notes in Computer Science4811:56–71.
Mihalcea R. 2004. Graph-based ranking algorithms for sentence extraction, applied to text summariza-tion. In Proceedings of the 42nd Annual Meeting of the Association for Computational Lingusitics, Barcelona, Spain.
Mihalcea and P. Tarau. 2004. TextRank - bringing or-der into texts. In Proceedings of the Conference on Empirical Methods in Natural Language Processing, Barcelona, Spain.
Nobata, C., Sekine, S., Murata, M., Uchimoto, K., Utiyama, M. and Isahara, H. 2001. Sentence extrac-tion system assembling multiple evidence. In Pro-ceedings of the Second NTCIR Workshop Meeting, 5–213–218.
Salton, G., Wong, A. and Yang, C. S. 1975. A Vector Space Model for Automatic Indexing Communica-tions of the ACM, 18(11):613-620.
Schenker, A., Bunke, H., Last, M., Kandel, A. 2005.
Graph-Theoretic Techniques for Web Content Min-ing, volume 62. World Scientific, Series in Machine Perception and Artificial Intelligence.
Peter D. Turney. 2000. Learning Algorithms for Keyphrase Extraction. Information Retrieval, 2(4):303–336.