Page 1 of 9
Hypoxia-related parameters during septic shock resuscitation:
Pathophysiological determinants and potential clinical
implications
Nicolás Pavez1, Eduardo Kattan2, Magdalena Vera2, Giorgio Ferri3, Emilio Daniel Valenzuela2, Leyla Alegría2, Sebastian Bravo1, Ronald Pairumani3, César Santis3, Vanessa Oviedo2, Dagoberto Soto2, Gustavo Ospina-Tascón4, Jan Bakker2,5,6,7, Glenn Hernández2, Ricardo Castro2
1Departamento de Medicina Interna, Facultad de Medicina, Universidad de Concepción, Concepción, Chile; 2Departamento de Medicina Intensiva,
Facultad de Medicina, Pontificia Universidad Católica de Chile, Santiago, Chile; 3Unidad de Cuidados Intensivos, Hospital Barros Luco-Trudeau, Santiago, Chile; 4Department of Intensive Care Medicine, Fundación Valle del Lili, Universidad ICES, Cali, Colombia; 5Division of Pulmonary, Allergy, and Critical Care Medicine, Columbia University Medical Center, New York, NY, USA; 6Erasmus MC University Medical Center, Department Intensive Care Adults, Rotterdam, CA, The Netherlands; 7Division of Pulmonary, and Critical Care Medicine, New York University-Langone, New York, NY, USA
Contributions: (I) Conception and design: N Pavez, R Castro, G Ferri, E Kattan, G Ospina-Tascón, J Bakker, G Hernández; (II) Administrative support: G Ferri, E Kattan, L Alegría, V Oviedo, R Pairumani, D Soto; (III) Provision of study materials or patients: C Santis, L Alegría, V Oviedo, R Pairumani, G Ferri, S Bravo, M Vera, ED Valenzuela; (IV) Collection and assembly of data: D Soto, C Santis, BA, L Alegría, V Oviedo, R Pairumani, G Ferri, S Bravo, M Vera, ED Valenzuela; (V) Data analysis and interpretation: E Kattan, R Castro, G Hernández, N Pavez, ED Valenzuela; (VI) Manuscript writing: All authors; (VII) Final approval of manuscript: All authors.
Correspondence to: Dr. Ricardo Castro, MD, MPH. Unidad de Paciente Crítico, Hospital Clinico UC-CHRISTUS, Departamento de Medicina Intensiva, Pontificia Universidad Católica de Chile, Diagonal Paraguay 362, Santiago Centro, Chile. Email: rcastro.med@gmail.com.
Background: Assessment of tissue hypoxia at the bedside has yet to be translated into daily clinical practice in septic shock patients. Perfusion markers are surrogates of deeper physiological phenomena. Lactate-to-pyruvate ratio (LPR) and the ratio between veno-arterial PCO2 difference and Ca–vO2 (ΔPCO2/Ca–vO2) have been proposed as markers of tissue hypoxia, but they have not been compared in the clinical scenario. We studied acute septic shock patients under resuscitation. We wanted to evaluate the relationship of these hypoxia markers with clinical and biochemical markers of hypoperfusion during septic shock resuscitation. Methods: Secondary analysis of a randomized controlled trial. Septic shock patients were randomized to fluid resuscitation directed to normalization of capillary refill time (CRT) versus normalization or significant lowering of lactate. Multimodal assessment of perfusion was performed at 0, 2, 6 and 24 hours, and included macrohemodynamic and metabolic perfusion variables, CRT, regional flow and hypoxia markers. Patients who attained their pre-specified endpoint at 2-hours were compared to those who did not.
Results: Forty-two patients were recruited, median APACHE-II score was 23 [15–31] and 28-day mortality 23%. LPR and ΔPCO2/Ca–vO2 ratio did not correlate during early resuscitation (0–2 h) and the whole study period (24-hours). ΔPCO2/Ca–vO2 ratio derangements were more prevalent than LPR ones, either in the whole cohort (52% vs. 23%), and in association with other perfusion abnormalities. In patients who reached their resuscitation endpoints, the proportion of patients with altered ΔPCO2/Ca-vO2 ratio decreased significantly (66% to 33%, P=0.045), while LPR did not (14% vs. 25%, P=0.34).
Conclusions: Hypoxia markers did not exhibit correlation during resuscitation in septic shock patients. They probably interrogate different pathophysiological processes and mechanisms of dysoxia during early septic shock. Future studies should better elucidate the interaction and clinical role of hypoxia markers during septic shock resuscitation.
Introduction
Despite recent advances in septic shock biochemical and
clinical understanding, mortality remains around 40% (1).
Sepsis-induced hypoperfusion leads to tissue hypoxia, cell and mitochondrial dysfunction, finally leading to multiorgan
failure (2). Timely resolution of hypoperfusion through
the judicious administration of fluids and vasoactive drugs,
among other therapies, may deactivate this vicious cycle and lead to an adequate cellular oxygen delivery and recovery of organ function (3).
Available markers of hypoperfusion in the clinical
practice are mere surrogates of deeper physiological
phenomena occurring at the tissue and cellular level. Some markers, like central venous oxygen saturation (SvcO2)
or the veno-arterial PCO2 difference reflect global DO2/
VO2 and flow balances (4-6). Other parameters, like
lactate, represent complex interactions between non-aerobic metabolism, hyperadrenergia, and liver lactate clearance (7). On the other side, regional perfusion assessment, like sublingual microcirculation (8) or near infrared spectroscopy (9), can assess specific tissue-derived parameters, which may not reflect other territories of the economy. Recently, capillary refill time (CRT) has emerged as an interesting perfusion monitor, that has a fast kinetics (10,11), and correlates with other perfusion parameters
such as hepatosplanchnic indices (12). Furthermore, its
behavior also has correlation with severity and mortality
(13,14).
The possibility to assess tissue hypoxia at the bedside has been pursued by clinicians and investigators along the years (15,16), but experimental methods have yet to be successfully translated into clinical practice. One
proposed alternative is the lactate/pyruvate ratio (LPR). If the electron transport chain of the mitochondria fails due
to tissue hypoxia, the cell uses a non-aerobic pathway to synthesize ATP leading to an increase of the LPR. This ratio has been utilized to differentiate hypoxia-related from
other causes of hyperlactatemia, such as increased glycolysis
without hypoxic stress (17,18). On the other hand, according to the Fick equation (19), the ratio between veno-arterial PCO2 difference and Ca–vO2 (ΔPCO2/Ca–vO2)
represents a clinical surrogate for the respiratory quotient
and its increase could signal anaerobic metabolism (20,21). To the best of our knowledge, both parameters have not been yet compared in the clinical scenario.
Recently, the ANDROMEDA-SHOCK trial compared
CRT- versus lactate-guided early resuscitation during
septic shock, demonstrating benefits in mortality,
treatment intensity and organ dysfunction for the CRT
arm (13,14,22,23). In a subsequent randomized controlled trial, we assessed both resuscitation strategies in 42
patients, in order to assess the impact of resuscitation strategy on fluid administration, perfusion and deep
hypoxia markers during the study protocol, focusing on
LPR and ΔPCO2/Ca–vO2 (24).
The objective of this study is to perform an assessment of the relationship between LPR and ΔPCO2/Ca–vO2, and the
relationship between deep hypoxia markers with clinical markers
of hypoperfusion during the initial resuscitation of this cohort
of septic shock patients. We present the following article/case in accordance with the CONSORT reporting checklist (available
at http://dx.doi.org/10.21037/atm-20-2048).
Methods
Patient selection and study protocol
We performed a prospective randomized controlled clinical trial. The design, main outcome and protocolization is detailed in clinicaltrials.gov (NCT03762005). Major
outcomes have been previously reported (24). Data for this analysis was obtained from the final study’s database.
This study was conducted during an 18-months period at two intensive care units of teaching hospitals in Santiago de Chile (Hospital Clínico de la Pontificia Universidad
Catolica de Chile and Hospital Barros Luco Trudeau). Respective IRBs and Ethics committees approved the study.
A signed informed consent was obtained from patients or next of kin before study inclusion.
During the study period, patients equal or older than 18
years old, who fulfilled the following inclusion criteria were considered for randomization:
(I) Septic shock, defined according to SEPSIS-3 criteria (serum lactate >2 mmol/L, with vasopressor
requirements after initial fluid loading of 20–
Submitted Feb 29, 2020. Accepted for publication May 22, 2020. doi: 10.21037/atm-20-2048
30 mL/kg) (3).
(II) Positive fluid responsiveness state (25,26).
Exclusion criteria considered the following: >24 hours of septic shock onset, anticipated surgical or dialytic procedure during study period, pregnancy, active bleeding, liver cirrhosis, do-not-resuscitate status or severe ARDS. Randomization was performed through a computerized software, with a permuted block of eight and an allocation of 1:1 into each study arm. Concealment was maintained through centralization of the randomization process. Patients were allocated either into CRT-targeted or
Lactate-targeted study arms.
The study protocol lasted 6 hours, and a full set of
measurements were performed until hour 24 (see more
detailed information in supplementary material 1). Due
to the difference in target dynamics, CRT arm was tested every 30 minutes, while lactate arm every 2 hours. If the perfusion target was not met, additional interventions could be initiated at discretion by attending physicians. Other therapies were performed according to current guidelines of septic shock management (3).
Measurements and data collection
Demographic and clinical data were registered at baseline and throughout hospitalization until discharge. Relevant clinical variables, multimodal perfusion assessment, and deep hypoxia makers were registered at baseline (T0),
2 hours (T2), 6 hours (T6) and 24 hours (T24).
Hemodynamic and perfusion variables (see more detailed information in supplementary material 1)
(I) Macrohemodynamic variables;
(II) Cardiac output (CO) and derived indices; (III) Metabolic-related perfusion variables (11); (IV) Capillary refill time (13);
(V) Regional flow:
(i) Sublingual microcirculation (27);
(ii) Near infrared spectroscopy (NIRS) (8,9,27);
(iii) Liver blood flow by Indocyanine green plasma disappearance rate (PDR-ICG) (27).
Deep hypoxia variables (see more detailed information in supplementary material 1)
To evaluate the presence of tissue hypoxia, we measured
the LPR and the ΔPCO2/Ca–vO2 ratio. Pyruvate was
determined by using pyruvate assay kit Cayman N°700470. ΔPCO2/Ca–vO2 ratio was calculated using a validated
equation (20,28). In order to ease the interpretation of both markers, data analysis was performed with the percentage of abnormality of each variable, a more intuitive approach for clinicians. For LPR a value of 15 or more was considered abnormal (17). For ΔPCO2/Ca–vO2 ratio, a value of 1.4 or
more was considered abnormal (29).
In order to assess if derangements in clinical perfusion
markers associated with deep hypoxia markers, we assessed the incidence of abnormal hypoxia markers when each clinical parameter presented abnormal values, at any
timepoint.
“Target reachers” analysis
Patients of both study arms who attained their prespecified perfusion target at T2 were considered target reachers, while those who did not were considered target non-reachers. We chose this timepoint as it was the first moment at which new measurements were made in both arms after randomization. Both groups were compared according to baseline characteristics and perfusion state. Evolution of deep hypoxia variables represented as percentage of patients with abnormal values, were compared through time in both
groups.
Statistical analysis
After discarding normal distribution, non-parametric tests were used. Descriptive statistics are shown as median [interquartile range] or percentage (%) accordingly. Mann-Whitney U, chi-square and Fisher’s exact, were used when appropriate. Data were analyzed with Minitab v17 (Minitab Inc, State College, PA) and GraphPad Prism (GraphPad Softwares, La Joya, CA) softwares. Two-tailed P value <0.05 was considered statistically significant.
Results
Forty-two patients were included in this analysis.
Demographic, hemodynamic, and other parameters are
shown in Table 1. Main septic foci were abdominal (57%),
respiratory (19%) and urinary (12%). Among rescue therapies implemented, 18% used steroids, 18% used
epinephrine, and 13% used high-volume hemofiltration. One hundred and twenty-five measurements of LPR and
Table 1 General characteristics of the included population
Parameter Value
Age (years) 63 [47–75]
Female (%) 55
APACHE-II 23 [15–31]
SOFA 10 [7–13]
Charlson index 1 [0–4]
Septic foci (%)
Abdominal 57
Respiratory 19
Urinary 12
Other 12
Surgical (%) 60
Pre ICU fluids (mL) 2,250 [1,000–3,025]
MAP (mmHg) 71 [63–76]
HR (bpm) 104 [93–130]
CVP (mmHg) 8 [5–11]
Cardiac index (L/min/m2) 2.9 [2–3.6]
Norepinephrine dose (mcg/kg/min) 0.29 [0.17–0.48]
CRT (s) 6 [3–6]
Lactate (mmol/L) 3.6 [2.9–6.4]
ScvO2 (%) 70 [62–78]
Delta pCO2(v-a) (mmHg) 8 [4.8–11]
ΔPCO2/Ca–vO2 1.9 [1.1–2.8]
LPR 8.7 [4.2–13.8]
MV days 5 [2–10]
ICU LOS (days) 8 [4–15]
Hospital LOS (days) 25 [9–56]
28-day mortality (%) 23
APACHE II, Acute Physiology and Chronic Health Evaluation II; SOFA, Sequential Organ Failure Assessment score; MAP, mean arterial pressure; DBP, diastolic blood pressure; CVP, central venous pressure; CRT, capillary refill time; ScvO2, central venous oxygen saturation Delta pCO2(v-a), difference between central venous carbon dioxide pressure and arterial carbon dioxide pressure; ΔPCO2/Ca–vO2, ratio between veno–arterial PCO2 difference and Ca–vO2; LPR, lactate/pyruvate ratio; MV, mechanical ventilation; LOS, length of stay.
during the study period. In 94 occasions both indices were
measured simultaneously at specific time-points, and 51 of these measurements corresponded to the first 2 hours.
Of these, 22% of LPR and 52% of ΔPCO2/Ca–vO2 ratio
exhibited abnormal values. Figure 1 shows the lack of correlation between both hypoxia markers, both at early resuscitation (0-2 h, panel A) and the whole study period
(0–24 h, panel B).
Patients with abnormal LPR at baseline (6), compared to those with normal LPR (27) had higher CRT {7 [5–14] vs. 4 [3–6], P=0.02}, but similar APACHE score, lactate levels, NE dose, and 28-day mortality. Patients with abnormal ΔPCO2/Ca–vO2 ratio at baseline (19), compared to those
with normal ratio (14), presented higher baseline lactate levels {6.1 [3–8.4] vs. 3.4 [2.7–4.1], P=0.049}, but similar
severity scores and mortality.
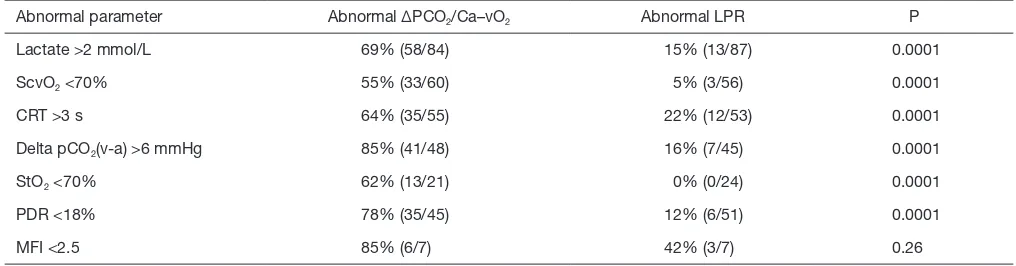
The incidence of abnormal hypoxia markers when different perfusion-related parameters were abnormal at any time point is shown in Table 2. As seen, abnormal values
Figure 1 Concordance between LPR and ΔPCO2/Ca–vO2 at
initial septic shock resuscitation (0–2 h) and the whole study period (24 h). LPR, lactate/pyruvate ratio; ΔPCO2/Ca–vO2: ratio between veno–arterial PCO2 difference and Ca–vO2.
60
40
20
0
60
40
20
0
0 2 4 6
ΔPCO2/Ca-vO2
0 2 4 6
ΔPCO2/Ca-vO2
R2=0.12
R2=0.09
LPR
LPR
A
[image:4.595.47.281.96.554.2]Table 2 Presence of abnormal hypoxia markers in patients with abnormal perfusion markers
Abnormal parameter Abnormal ΔPCO2/Ca–vO2 Abnormal LPR P
Lactate >2 mmol/L 69% (58/84) 15% (13/87) 0.0001
ScvO2 <70% 55% (33/60) 5% (3/56) 0.0001
CRT >3 s 64% (35/55) 22% (12/53) 0.0001
Delta pCO2(v-a) >6 mmHg 85% (41/48) 16% (7/45) 0.0001
StO2 <70% 62% (13/21) 0% (0/24) 0.0001
PDR <18% 78% (35/45) 12% (6/51) 0.0001
MFI <2.5 85% (6/7) 42% (3/7) 0.26
ΔPCO2/Ca–vO2, ratio between veno–arterial PCO2 difference and Ca–vO2; LPR, Lactate/pyruvate ratio; CRT, Capillary refill time; ScvO2, central venous oxygen saturation Delta pCO2(v-a), difference between central venous carbon dioxide pressure and arterial carbon dioxide pressure; StO2, Tissue oxygen saturation; PDR-ICG, liver blood flow by Indocyanine green plasma disappearance rate; MFI, mean flow index.
of ΔPCO2/Ca–vO2 ratio were significantly more prevalent
than LPR alterations in the context of any abnormal
perfusion-related parameter.
In 50% of patients cardiac output increased with fluid loading between T0 and T2, while the others it remained
constant or decreased. LPR and ΔPCO2/Ca–vO2 tended
to improve in patients who increased cardiac output [delta LPR: 0.89 (0.15–4) vs. −0.12 (−2–2.2), P=0.12; delta ΔPCO2/Ca–vO2 ratio: 0.48 (0.04–1) vs. −0.01 (−0.42–0.3),
P=0.11].
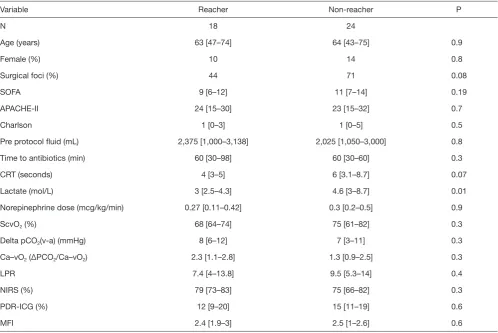
Eighteen patients were considered target reachers at 2 hours, while 24 patients were not. Table 3 shows the main
clinical, demographic, severity and perfusion characteristics
of both subgroups. As shown in Figure 2, target reachers
significantly decreased the proportion of abnormal ΔPCO2/
Ca–vO2 ratio between 0 and 2 hours, while this did not
occur in LPR. On the other hand, target non-reachers maintained similar proportions of abnormal deep hypoxia markers.
Discussion
Our study showed that in a population of fluid responsive patients with septic shock according to SEPSIS-3 (septic patients with hyperlactatemia and vasopressors for arterial hypotension), the presence of concurrent abnormal values of deep tissue hypoxia markers is erratic during early resuscitation. In addition, measured hypoxia markers do not exhibit concordance between them. However, further analysis of our results suggests that both LPR and ΔPCO2/
Ca–vO2 ratio interrogate different pathways on the hypoxia/
hypoperfusion processes of septic shock.
Lactate prognostic value and response to therapy is
well established in the literature (30,31), and is still the main resuscitation target recommended by the Surviving Sepsis Campaign for septic shock (3). Its use was primarily
advocated under the hypothesis that decreases in tissue
blood flow cause tissue hypoxia that increases non-aerobic lactate production due to low mitochondrial oxygen availability (30,32). This latter condition results in tissue injury that leads to organ failure and subsequent morbidity
and mortality.
Nevertheless, though by shock definition each patient in our series had hyperlactatemia, only few of them presented a high LPR. We believe that the explanation for these findings can be drawn after reviewing previous reports on
the topic:
Levy studied 60 patients with septic shock, lactic acidosis
and vasopressor requirements (33). In them, higher lactate
levels were closely related with elevated LPRs with a notable direct progression between severity of the septic shock
according to norepinephrine requirements, hyperlactatemia
levels and LPR. In the subgroup these authors called ‘intractable septic shock’, the APACHE II score was 32 and the norepinephrine dose 2.3 μg/kg/min. The authors concluded their study stating that hyperlactatemia with an elevated LPR is associated with the development of multiple
organ failure and death (33).
In the same line, Rimachi studied 17 hyperlactatemic septic patients, and 13 of them (75%) presented high
the data indicate that these patients were sicker and,
consequently, a higher proportion of them presented an
elevated LPR as well.
In contrast, Suistomaa studied LPR in 98 patients
admitted to the ICU, and 32% of them presented
hyperlactatemia (34). Although there were few septic
patients (8/98) in this series and data on norepinephrine
dose and mortality was not provided, it is specifically mentioned that hyperlactatemia was not associated with LPR elevation. Moreover, their APACHE II score was around 16, indicating that those patients were less severely ill. The no elevation in LPR is concordant with our data.
Considering the previously published evidence, we can speculate that the low prevalence of an elevated LPR may be explained by inclusion of less severe cases of septic shock
in our study, which is consistent with the mortality of only
23%.
Regarding ΔPCO2/Ca–vO2 ratio, a retrospective
study reported a close correlation between blood lactate
concentration and the ΔPCO2/Ca–vO2 ratio in a cohort
of critically ill patients (29). Monnet demonstrated that
ΔPCO2/Ca–vO2 ratio was able to predict an increase in
VO2 in fluid responsive septic shock patients subjected to volume expansion (35), a fact confirmed later by Mallat et al. (36).
Even though we didn’t assess VO2 systematically,
our results are in line with these previous reports. As hypoperfusion resolution is the ultimate goal of VO2
[image:6.595.51.550.95.428.2]increase, we expanded the findings to a clinical scenario where hypoperfusion resolution was assessed at the bedside.
Table 3 Comparison between demographic, severity scoring, and baseline perfusion variables in target reachers and non-reachers
Variable Reacher Non-reacher P
N 18 24
Age (years) 63 [47–74] 64 [43–75] 0.9
Female (%) 10 14 0.8
Surgical foci (%) 44 71 0.08
SOFA 9 [6–12] 11 [7–14] 0.19
APACHE-II 24 [15–30] 23 [15–32] 0.7
Charlson 1 [0–3] 1 [0–5] 0.5
Pre protocol fluid (mL) 2,375 [1,000–3,138] 2,025 [1,050–3,000] 0.8
Time to antibiotics (min) 60 [30–98] 60 [30–60] 0.3
CRT (seconds) 4 [3–5] 6 [3.1–8.7] 0.07
Lactate (mol/L) 3 [2.5–4.3] 4.6 [3–8.7] 0.01
Norepinephrine dose (mcg/kg/min) 0.27 [0.11–0.42] 0.3 [0.2–0.5] 0.9
ScvO2 (%) 68 [64–74] 75 [61–82] 0.3
Delta pCO2(v-a) (mmHg) 8 [6–12] 7 [3–11] 0.3
Ca–vO2 (ΔPCO2/Ca–vO2) 2.3 [1.1–2.8] 1.3 [0.9–2.5] 0.3
LPR 7.4 [4–13.8] 9.5 [5.3–14] 0.4
NIRS (%) 79 [73–83] 75 [66–82] 0.3
PDR-ICG (%) 12 [9–20] 15 [11–19] 0.6
MFI 2.4 [1.9–3] 2.5 [1–2.6] 0.6
In practical terms, a ΔPCO2/Ca–vO2 ratio normalization
could work as a surrogate for an effective rise on DO2 with
a concurrent correction of the oxygen debt, or an effective flow rectification. In other words, in this scenario, fluid responsiveness with ΔPCO2/Ca–vO2 ratio improvement
after fluid loading could be an indirect marker of VO2
improvement as evidence of flow responsiveness. This can ultimately explain the reason why LPR and ΔPCO2/
Ca–vO2 ratio are not concordant as they interrogate
different mechanisms and subcellular processes of the pathophysiology of septic shock. Of course, another possibility is that the lack of correlation simply is due to the slower kinetics of recovery of lactate as compared to the rapid changes in O2 and CO2 metabolism/production.
Despite the fact that LPR clinical use has been abandoned due to technical complexities and that ΔPCO2/
Ca–vO2 ratio has not found its place as a functional marker
for hypoxia in septic shock, in light of our results, we think that these markers may have a relevant place in the clinical understanding and management of the septic shock patient.
Limitations
This study has several limitations. First, this is a post hoc
analysis of a randomized controlled trial. Second, there were some missing values of perfusion variables, mainly
due to problems in the preanalytical phase. Third, some technical issues around pyruvate measurements were present. However, our lab personnel have a long-time experience with biologic samples handling and processing. Finally, there is no universal acceptance on the best method
to clinically assess the respiratory quotient (i.e., the ratio
between VCO2 and VO2), including the use of central
venous gases over mixed venous gases and the use of CO2
and O2 pressures over arterial and venous content (21,37,38).
Despite this, recent evidence has provided support for this
practical approach (28), which is the one we used in our
study.
Conclusions
To our knowledge, this is the first time that the LPR and ΔPCO2/Ca–vO2 ratios were compared as hypoxia markers.
Despite the huge experimental and theoretical backgrounds, at first, we found no evident correlation between their kinetics. Nevertheless, exploring the contexts for these markers we believe that LPR may help on the assessment of
the depth of the dysoxia state and eventually as a prognostic
marker, and that the ΔPCO2/Ca–vO2 ratio may serve as
a more precise signal for flow rectification in previously hypoperfused fluid responsive patients subjected to fluid resuscitation. Undoubtedly, further information on the best scenarios where LPR and ΔPCO2/Ca–vO2 ratios may
exhibit their full usefulness is still to be gathered.
Acknowledgments
Funding: ClinicalTrials.gov Identifier: NCT03762005
(Retrospectively registered on December 3rd 2018). Grant
FONDECYT Chile 1170043.
Footnote
Reporting Checklist: The authors have completed the
CONSORT reporting checklist. Available at http://dx.doi. org/10.21037/atm-20-2048
Data Sharing Statement: Available at http://dx.doi.
org/10.21037/atm-20-2048
Provenance and Peer Review: This article was commissioned
by the Guest Editors (Glenn Hernández and Guo-wei Tu)
for the series “Hemodynamic monitoring in critically ill
[image:7.595.78.263.88.280.2]patients” published in Annals of Translational Medicine. The
Figure 2 Evolution of patients with abnormal hypoxia related
parameters between 0–2 hours in target reachers and non-reachers. LPR, lactate/pyruvate ratio; ΔPCO2/Ca–vO2, ratio between veno– arterial PCO2 difference and Ca–vO2.
0 h 2 h
0 h 2 h P=0.045
P=0.34
Patients with Abnormal Δ
PCO
2
/Ca-vO
2
(%)
Patients with Abnormal
LPR (%)
Reacher Non Reacher 100
75
50
20
0
100
75
50
20
0
P=0.5
P=0.5 0 h 2 h
article was sent for external peer review organized by the Guest Editors and the editorial office.
Conflicts of Interest: All authors have completed the ICMJE uniform disclosure form (available at http://dx.doi. org/10.21037/atm-20-2048). The series “Hemodynamic
monitoring in critically ill patients” was commissioned by the editorial office without any funding or sponsorship. GH served as the unpaid Guest Editor of the series. The other authors have no other conflicts of interest to declare.
Ethical Statement: The authors are accountable for all aspects of the work in ensuring that questions related to the accuracy or integrity of any part of the work are appropriately investigated and resolved. The study was conducted in accordance with the Declaration of Helsinki (as revised in 2013) and approved by Respective IRBs and Ethics committees. Informed consent was taken from all individual participants or their next of kin before study inclusion.
Open Access Statement: This is an Open Access article distributed in accordance with the Creative Commons Attribution-NonCommercial-NoDerivs 4.0 International License (CC BY-NC-ND 4.0), which permits the non-commercial replication and distribution of the article with
the strict proviso that no changes or edits are made and the
original work is properly cited (including links to both the formal publication through the relevant DOI and the license). See: https://creativecommons.org/licenses/by-nc-nd/4.0/.
References
1. Singer M, Deustchman C, Warren Seymour C, et al. The Third International Consensus Definitions for Sepsis and Septic Shock (Sepsis-3). JAMA 2016;315:801-10.
2. Cecconi M, Evans L, Levy M, Rhodes A. Sepsis and septic shock. Lancet 2018;392:75-87.
3. Rhodes A, Evans L, Alhazzani W, et al. Surviving Sepsis Campaign: International Guidelines for Management of Sepsis and Septic Shock: 2016. Crit Care Med
2017;45:486-552.
4. Gavelli F, Teboul JL, Monnet X. How can CO2-derived indices guide resuscitation in critically ill patients? J Thorac Dis 2019;11:S1528-37.
5. Bauer P, Reinhart K, Bauer M. Significance of
venous oximetry in the critically ill. Med Intensiva. 2008;32:134-42.
6. Scheeren TWL, Wicke JN, Teboul JL. Understanding the
carbon dioxide gaps. Curr Opin Crit Care 2018;24:181-9. 7. Hernandez G, Bellomo R, Bakker J. The ten pitfalls
of lactate clearance in sepsis. Intensive Care Med 2019;45:82-5.
8. Hernandez G, Bruhn A, Luengo C, et al. Effects of dobutamine on systemic, regional and microcirculatory perfusion parameters in septic shock: A randomized, placebo-controlled, double-blind, crossover study.
Intensive Care Med 2013;39:1435-43.
9. Lima A, Van Bommel J, Sikorska K, et al. The relation of near-infrared spectroscopy with changes in peripheral
circulation in critically ill patients. Crit Care Med 2011;39:1649-54.
10. Lara B, Enberg L, Ortega M, Leon P, et al. Capillary refill time during fluid resuscitation in patients with
sepsis-related hyperlactatemia at the emergency department is
related to mortality. PLoS One 2017;12:e0188548. 11. Hernandez G, Pedreros C, Veas E, et al. Evolution of
peripheral vs metabolic perfusion parameters during septic shock resuscitation. A clinical-physiologic study. J Crit
Care 2012;27:283-8.
12. Brunauer A, Koköfer A, Bataar O, et al. Changes in
peripheral perfusion relate to visceral organ perfusion in
early septic shock: A pilot study. J Crit Care 2016;35:105-9. 13. Hernández G, Ospina-Tascon G, Petri Damiani L, et al.
Effect of a Resuscitation Strategy Targeting Peripheral Perfusion Status vs Serum Lactate Levels on 28-Day Mortality Among Patients With Septic Shock. The ANDROMEDA-SHOCK Randomized Clinical Trial. JAMA 2019;321:654-64.
14. Zampieri FG, Damiani LP, Bakker J, et al. Effects of a Resuscitation Strategy Targeting Peripheral Perfusion Status Versus Serum Lactate Levels Among Patients With Septic Shock. A Bayesian Reanalysis of the ANDROMEDA-SHOCK Trial. Am J Respir Crit Care
Med 2020;201:423-9.
15. MacIntyre NR. Tissue hypoxia: Implications for the
respiratory clinician. Respir Care 2014;59:1590-6. 16. Third European Consensus Conference in Intensive Care
Medicine. Tissue hypoxia: How to detect, how to correct, how to prevent? Société de Réanimation de Langue Française. The American Thoracic Society. European Society of Intensive Care Medicine. Am J Respir Crit Care
Med 1996;154:1573-8.
17. Rimachi R, Bruzzi De Carvahlo F, et al. Lactate/pyruvate ratio as a marker of tissue hypoxia in circulatory and septic shock. Anaesth Intensive Care 2012;40:427-32.
Opin Crit Care 2006;12:315-21.
19. Cohen IL, Roberts KW, Perkins RJ, et al. Fick-derived hemodynamics; Oxygen consumption measured directly vs oxygen consumption calculated from CO2 production
under steady state and dynamic conditions. Chest 1992;102:1124-7.
20. Ospina-Tascón GA, Hernández G, Cecconi M. Understanding the venous–arterial CO2 to arterial– venous O2 content difference ratio. Intensive Care Med
2016;42:1801-4.
21. Ospina-Tascón GA, Umaña M, Bermúdez W, et al. Combination of arterial lactate levels and venous-arterial CO2 to arterial-venous O2 content difference ratio as markers of resuscitation in patients with septic shock.
Intensive Care Med 2015;41:796-805.
22. Hernández G, Cavalcanti AB, Ospina-Tascón G, et al. Statistical analysis plan for early goal-directed therapy using a physiological holistic view - The Andromeda-Shock: A randomized controlled trial. Rev Bras Ter
Intensiva 2018;30:253-63.
23. Hernández G, Cavalcanti AB, Ospina-Tascón G, et al.
Early goal-directed therapy using a physiological holistic
view: the ANDROMEDA-SHOCK—a randomized
controlled trial. Ann Intensive Care 2018;8:52.
24. Hernandez G, Castro R, Alegria L, et al. Peripheral perfusion versus lactate-targeted fluid resuscitation in septic shock: the ANDROMEDA SHOCK physiology
study: preliminary report. Crit Care 2019;23:P097.
25. Monnet X, Teboul JL. Assessment of fluid responsiveness: Recent advances. Curr Opin Crit Care 2018;24:190-5. 26. Kattan E, Ospina-Tascón GA, Teboul JL, et al. Systematic
assessment of fluid responsiveness during early septic shock resuscitation: secondary analysis of the ANDROMEDA-SHOCK trial. Crit Care 2020;24:23.
27. Hernandez G, Regueira T, Bruhn A, et al. Relationship of
systemic, hepatosplanchnic, and microcirculatory perfusion
parameters with 6-hour lactate clearance in hyperdynamic septic shock patients: an acute, clinical-physiological, pilot
study. Ann Intensive Care 2012;2:44.
28. Ospina-Tascón GA, Calderón Tapia LE. Venous-arterial CO2 to arterial-venous O2 differences: A physiological meaning debate. J Crit Care 2018;48:443-4.
29. Mekontso-Dessap A, Castelain V, Anguel N, et al. Combination of venoarterial PCO2 difference with arteriovenous O2 content difference to detect anaerobic metabolism in patients. Intensive Care Med
2002;28:272-7.
30. Weil MH, Afifi AA. Experimental and clinical studies on
lactate and pyruvate as indicators of the severity of acute
circulatory failure (shock). Circulation 1970;41:989-1001. 31. Kompanje EJO, Jansen TC, Van Der Hoven B, et al. The first demonstration of lactic acid in human blood in shock by Johann Joseph Scherer (1814-1869) in January 1843.
Intensive Care Med 2007;33:1967-71.
32. Broder G, Weil MH. Excess lactate: An index of reversibility of shock in human patients. Science
1964;143:1457-9.
33. Levy B, Sadoune L-O, Gelot A-M, et al. Evolution of lactate/pyruvate and arterial ketone body ratios in the early course of catecholamine-treated septic shock. Crit Care
Med 2000;28:114-9.
34. Suistomaa M, Ruokonen E, Kari A, Takala J. Time-pattern of lactate and lactate to pyruvate ration in the first 24 hours of intensive care emergency admissions. Shock
2000;14:8-12.
35. Monnet X, Julien F, Ait-Hamou N, et al. Lactate and venoarterial carbon dioxide difference/arterial-venous oxygen difference ratio, but not central venous oxygen saturation, predict increase in oxygen consumption in fluid
responders. Crit Care Med 2013;41:1412-20.
36. Mallat J, Lemyze M, Meddour M, et al. Ratios of central venous-to-arterial carbon dioxide content or tension to arteriovenous oxygen content are better markers of global anaerobic metabolism than lactate in septic shock patients.
Ann Intensive Care 2016;6:10.
37. Dubin A, Ferrara G, Kanoore Edul VS, et al. Venoarterial PCO2-to-arteriovenous oxygen content difference ratio is a poor surrogate for anaerobic metabolism in hemodilution:
an experimental study. Ann Intensive Care 2017;7:65.
38. Jakob SM, Groeneveld ABJ, Teboul JL. Venous– arterial CO2 to arterial–venous O2 difference ratio as a resuscitation target in shock states? Intensive Care Med
2015;41:936-8.
Cite this article as: Pavez N, Kattan E, Vera M, Ferri G,
Study protocol
Each study arm had a specific perfusion target (normalization or 20% decrease of serum lactate levels, or normalization of CRT). When there was an abnormal perfusion target, fluid challenges were performed (500 of crystalloids in 30 minutes) until normalization of target,
negativization of fluid responsiveness or pre-defined safety
limits were met (i.e., raise in central venous pressure of 5 cmH2O or more).
Hemodynamic and perfusion variables
Macrohemodynamic variables, including, mean arterial pressure, CV, heart rate, norepinephrine dose (NE dose);
fluid responsiveness state; fluid boluses, fluid balance, and
outputs.
Cardiac output (CO) and derived indices, measured
either with a pulse-contour CO technique (PiCCO device)
or a pulmonary artery catheter.
Metabolic-related perfusion variables, such as arterial lactate, central venous-arterial (pCO2) gradient [P(cv-a)
CO2] (6), and central venous oxygen saturation (ScvO2) (5).
Capillary refill time measured with a standardized
technique (13).
Regional flow
Sublingual microcirculation
Assessed through side dark field (SDF) device. At least five 10–20 second videos were recorded by an expert user and
analyzed manually according to recent recommendations. Then, we calculated the microcirculatory flow index
(MFI). A value ≤2.5 was considered microcirculatory
hypoperfusion (27).
Near infrared spectroscopy (NIRS)
A NIRS probe was placed in the skin of the thenar
eminence, in order to assess muscle oxygen saturation (StO2), with a tissue spectrometer (InSpectra Model 325;
Hutchinson Tc, Mn, USA). Values of StO2 <70% was
considered abnormal (8,9,27).
Liver blood flow
Indocyanine green plasma disappearance rate (PDR-ICG) was measured with a transcutaneous assessment if ICG
clearance, measured through a finger clip and connected
to a liver function monitor (LiMON-Pulsion Medical Systems, Munich, Germany) 0.25 mg/kg of ICG was
injected through a central line. Normal ranges described for
PDR-ICG is 18% to 25% per minute, and we considered a value <15%/min as categorically abnormal, thus suggesting
liver hypoperfusion assuming stable liver function (27).
Deep hypoxia variables
Briefly, plasma from venous blood (using EDTA as an
anticoagulant) was obtained by centrifugation of the sample and then deproteinate followed by centrifugation and posterior neutralization with potassium carbonate. The pyruvate level was fluorescently determined by enzymatic
reaction coupled to resorufin production. The relationship
was then calculated as lactate divided to pyruvate, and a
value of 15 or more was considered abnormal (17).
PaCO2 − PvCO2/[(SaO2 − SvO2) × Hb × 1.36]; whereas
PaCO2 and PvCO2 are arterial and central venous carbon
dioxide, respectively, SaO2 is arterial saturation of oxygen and Hb is hemoglobin. A value of 1.4 or more was