T Tauri binary systems
Sebastian Daemgen
T Tauri binary systems
Sebastian Daemgen
Dissertation
an der Fakult¨
at f¨
ur Physik
der Ludwig–Maximilians–Universit¨
at
M¨
unchen
vorgelegt von
Sebastian Daemgen
aus Wuppertal
Zweitgutachter: Priv. Doz. Achim Weiss
Abstract xi
1 Introduction 1
1.1 Star formation in the Solar neighborhood . . . 1
1.1.1 Observational signatures of T Tauri Stars. . . 3
1.1.2 Young low-mass multiple stars . . . 7
1.2 Protoplanetary disks and their evolution . . . 9
1.2.1 The influence of stellar companions on circumstellar disks. . . 10
1.2.2 A short note on planets in binaries . . . 13
1.3 Open issues and the aim of this thesis. . . 14
1.4 Structure and content of this thesis . . . 15
2 Adaptive Optics spectroscopy 17 2.1 Close visual binaries: the need for high-spatial resolution spectroscopy. . . 17
2.2 A short introduction to Adaptive Optics . . . 18
2.3 Spectroscopy with Adaptive Optics . . . 21
2.3.1 Long-slit spectroscopy with NACO . . . 22
2.3.2 Integral field spectroscopy with SINFONI. . . 24
3 Disk & star parameters of T Tauri binaries of the Orion Nebula Cluster 27 3.1 Observations and data reduction. . . 28
3.1.1 Sample definition . . . 28
3.1.2 NACO imaging: photometry and astrometry . . . 30
3.1.3 Spectroscopy with NACO . . . 34
3.1.4 NIFS-NIRI imaging and spectroscopy . . . 40
3.2 Results . . . 40
3.2.1 Extinctions and color-excess – the color-color diagram. . . 40
3.2.2 Spectral types and veiling . . . 44
3.2.3 Luminosity, effective temperature, and radius . . . 47
3.2.4 Accretion: equivalent width, accretion luminosity, and mass accre-tion rate . . . 50
3.3 Discussion . . . 54
3.3.2 Disk evolution around the components of visual ONC binaries . . . 57
3.3.3 Is the existence of an inner disk linked to planet formation in binaries? 66 3.4 Conclusions . . . 67
4 Disks and stellar parameters in Chamaeleon I binaries 69 4.1 Observations and data reduction. . . 70
4.1.1 Sample definition . . . 70
4.1.2 NACO imaging: photometry and astrometry . . . 71
4.1.3 SINFONI H+K-band IFU spectroscopy . . . 77
4.2 Results . . . 82
4.2.1 The color-color diagram: photometric extinctions and color excesses 82 4.2.2 Spectral types, extinction & veiling . . . 87
4.2.3 Effective temperatures & luminosities: the HR-diagram . . . 94
4.2.4 Accretion . . . 97
4.2.5 The new companion candidate to T 33 B . . . 99
4.3 Discussion . . . 100
4.3.1 Stellar parameters & sample biases . . . 100
4.3.2 The evolution of disks in Cha I binary components . . . 105
4.4 Conclusions . . . 114
5 Binary disk evolution across different star-forming regions 117 5.1 The combined results from various star-forming regions . . . 118
5.1.1 The decay of the disk frequency in binaries with age. . . 118
5.1.2 Differential disk evolution . . . 123
5.1.3 The independence of mass accretion rate and binarity . . . 125
5.1.4 Binary disk evolution vs. planet formation . . . 127
5.2 Summary . . . 128
6 Conclusions & outlook 131 A Statistical evaluation of the disk frequency 135 A.1 Derivation of the formulae . . . 135
A.1.1 The probability density for k disks in n targets. . . 136
A.1.2 The weighting factors p(k|D) . . . 136
A.1.3 Application to the ONC . . . 139
B Best-fit spectral templates 141 B.1 ONC K-band spectra and best-fit templates . . . 141
B.2 Best fit spectral templates for all Cha I spectra . . . 155
Bibliography 171
1.1 Star formation. . . 2
1.2 Emission line spectrum of a T Tauri star . . . 4
1.3 Near-IR excess in T Tauri stars . . . 6
1.4 Disk fraction as a function of SFR age . . . 10
2.1 Schematic diagram of an Adaptive Optics system . . . 19
2.2 Slit losses as a function of FWHM . . . 23
3.1 NACO H-band imaging of ONC binaries . . . 31
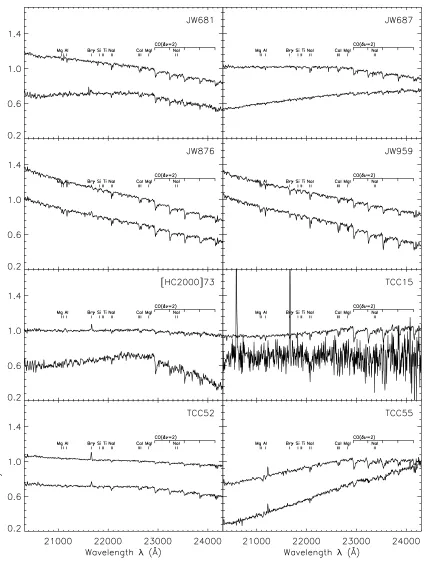
3.2 Target component spectra . . . 38
3.3 Color-color diagram of the ONC binary components . . . 41
3.4 Equivalent widths of Na I and Ca I as a function of spectral type . . . 45
3.5 Contour plot of χ2 as a function of extinction and K-band excess. . . . 47
3.6 Example of spectral type fitting . . . 48
3.7 HR-diagram of the ONC targets . . . 49
3.8 Brackett-gamma equivalent width as a function of near-IR excess . . . 51
3.9 Target component spectral types . . . 54
3.10 Extinction in primary and secondary comoponents. . . 55
3.11 Relative ages of primary and secondary in ONC binaries . . . 56
3.12 Binary separation as a function of component accretion type . . . 59
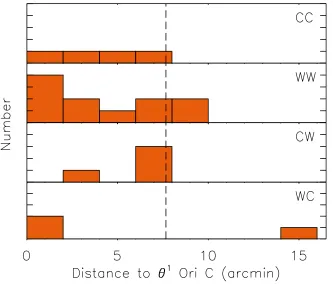
3.13 Distance to Theta 1 Ori C as a function of accretion type . . . 61
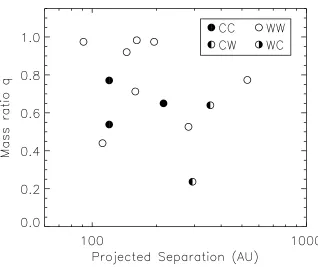
3.14 Mass ratios of ONC binaries vs. binary separation . . . 62
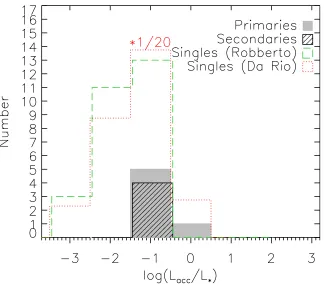
3.15 Distribution of accretion luminosities . . . 64
3.16 Mass accretion rates versus stellar mass . . . 65
4.1 NACO Ks-band imaging of Cha I binaries . . . 74
4.2 NACO Ks-band imaging of triples with unresolved components. . . 75
4.3 NACO Ks-band imaging of the newly discovered binary T 33 B . . . 75
4.4 Stellar PSF traced in SINFONI data cube . . . 81
4.5 SINFONI spectroscopy of Cha I binaries . . . 83
4.6 Color-color diagrams . . . 86
4.7 Comparison of Cha I target components to dwarf and giant spectra . . . . 88
4.9 Comparison of Cha I target components to dwarf and giant spectra . . . . 91
4.10 Spectroscopic versus photometric extinctions . . . 94
4.11 HR diagram of Cha I target components with models of Siess et al. . . 95
4.12 HR diagram of Cha I target components with models of Palla & Stahler. . 96
4.13 Br-gamma absorption strength in dwarfs . . . 97
4.14 Relative motion of T 33 Ba and Bb . . . 100
4.15 Spectral types histogram . . . 102
4.16 Primary versus secondary extinction . . . 103
4.17 Primary age versus secondary age . . . 104
4.18 Near-infrared excess E(Ks-L’) of primary and secondary components . . . . 107
4.19 Brackett-gamma emission vs. near-infrared color excess E(Ks-L’) . . . 108
4.20 Accretion status as a function of binary separation . . . 109
4.21 Mass ratio as a function of binary separation . . . 111
4.22 Mass accretion rate as a function of stellar mass . . . 112
4.23 Mass accretion rate as a function of binary separation . . . 113
5.1 Decay of accretion and inner dust disk frequencies of binary components with age . . . 120
5.2 Accretion type as a function of binary separation . . . 124
5.3 Mass accretion rate as a function of stellar mass for different SFR . . . 126
A.1 Probability density function . . . 136
B.1 Target spectra and best-fitting dwarf templates of ONC targets . . . 141
3.1 ONC targets and observations . . . 29
3.2 Relative photometry and astrometry of the observed binaries . . . 33
3.3 Non-resolved photometry of the observed binaries . . . 34
3.4 Individual component apparent magnitudes . . . 35
3.5 Spectral features identified in the observed spectra. . . 37
3.6 Individual component properties . . . 42
4.1 Cha I targets and observations . . . 72
4.2 Individual component apparent magnitudes . . . 78
4.3 Spectroscopic individual component properties . . . 92
4.4 Equivalent widths of Brackett-gamma in dwarfs . . . 98
Binary stars are among the most common outcome of star formation. However, many details remain to be explored of how binarity influences the evolution of primordial cir-cumstellar disks, the birthplaces of planets. Tidal interactions and irradiation can change disk geometries and lifetimes, dust properties, and thus the conditions for planet formation. This thesis presents high-spatial resolution near-infrared photometric and spectroscopic observations of 52 visual multiple stars with projected separations of 25–1000 AU in the Orion Nebula Cluster and Chamaeleon I star-forming regions. It represents the largest coherent study of protoplanetary disks around the individual components of T Tauri binary stars in the two regions, and is among the largest of its kind in nearby star-forming regions to date. The data are used to infer individual stellar (e.g. effective temperature, luminosity, age, mass) and binary parameters (separation, component mass ratio). These are brought into context with disk parameters of each component: ongoing accretion is inferred from the strength of Brackett-γ emission and the existence of hot dust at the inner rim of the circumstellar disk is measured from near-IR excess emission.
The new results show a significant reduction of the frequency of accretion disks around binary components compared to single stars in the same regions. The effect is strongest in close binaries with <100 AU projected separation where the frequency of accretors among the binary components is less than 1/2 of the single star accretor fraction. While these close systems also show a mild reduction of targets with hot circumstellar dust, wider binaries have a dust disk fraction comparable to single stars. The derived mass accretion rates were measured to not depend on the fact that stars are accompanied by binary companions at separations of ∼100–1000 AU.
The new results are put into context with findings from the fields of star formation, disk evolution, and planet formation to derive the following conclusions: (a) Binary com-ponents form simultaneously. Capture is not the major binary formation process. (b) Disk evolution is accelerated in binary stars of separations<100 AU compared to single stars of the same mass. (c) Opposite to single star disk evolution, the disk around the less massive component has on average a shorter lifetime than the more massive component’s disk. (d) While the lifetime of a disk depends on the diameter of a disk, mass accretion rates are independent of a disk’s size and lifetime. A possible reason is a decoupling of inner and outer disk properties. (e) The correlation of disk and planet statistics around binary com-ponents supports a rapid formation of gas planets with masses&1 MJup (through e.g. disk
Doppelsterne geh¨oren zu den am h¨aufigsten gebildeten Objekten im Sternentstehungspro-zess. Dennoch ist der Einfluss von stellaren Begleitern auf die Entwicklung zirkumstellarer Scheiben, dem Geburtsort der Planeten, bisher wenig verstanden.
Die vorliegende Arbeit beschreibt und diskutiert Nahinfrarotbeobachtungen von 52 stel-laren Vielfachsystemen mit projizierten Abst¨anden von 25 bis 1000 Astronomischen Ein-heiten (AE) in den Sternentstehungsregionen desOrion Nebula Cluster und Chamaeleon I. Damit handelt es sich um die gr¨oßten homogenen Studien protoplanetarer Scheiben in T Tauri-Doppelsternen in diesen beiden Regionen und um eine der umfangreichsten Unter-suchungen dieser Art bisher. Die aufgenommenen Beobachtungsdaten erlauben die Bestim-mung von individuellen stellaren (z.B. Effektivtemperatur, Leuchtkraft, Alter, Masse) und Systemparametern (Abstand der Komponenten, Massenverh¨altnis). Zus¨atzlich dient die Detektion von Brackett-γ-Emission als Anzeichen f¨ur aktive Akkretion w¨ahrend zirkum-stellarer Staub in der inneren Scheibe mittels Nahinfrarotfarbexzess nachgewiesen wird.
Die Ergebnisse zeigen, dass der Anteil an Doppelsternkomponenten mit intakter Akkre-tionsscheibe signifikant geringer ist als der von Einzelsternen vergleichbarer Masse in beiden Regionen. In engen Systemen mit weniger als 100 AE projiziertem Abstand ist die Akkre-tionsscheibenh¨aufigkeit auf etwa die H¨alfte des Einzelsternwertes reduziert. Heißer Staub in der inneren Scheibe ist in engen Doppelsystemen <100 AE jedoch nur leicht verringert und f¨ur >100 AE identisch zu der von Einzelsternen. Die gemessenen Massenakkretions-raten in Doppelsternkomponenten erweisen sich als ununterscheidbar von denen in Einzel-und Doppelsystemen anderer Sternentstehungsregionen.
Die gesammelten Daten lassen folgende Schl¨usse zu: (a) Die Komponenten von Dop-pelsternen enstehen vorrangig gleichzeitig, was gegenEinfang urspr¨unglich isolierter Kom-ponenten als haupts¨achlichen Doppelsternenstehungsmechanismus spricht. (b) Scheiben in Doppelsternen enger als ∼100 AE entwickeln sich, und verschwinden, schneller als Einzel-sternscheiben. (c) Im Gegensatz zur Scheibenentwicklung in Einzelsternen ist die Le-benszeit einer Scheibe um die masse¨armere Komponente eines Doppelsterns k¨urzer als die um den Prim¨arstern. (d) W¨ahrend die Lebenszeit einer Scheibe durch ihren ¨außeren Durchmesser (also indirekt durch den Doppelsternabstand) bestimmt wird, sind die Mas-senakkretionsraten universell. Dies ist ein Hinweis auf eine Entkopplung der Entwicklung der inneren und ¨außeren Scheibe. (e) Die Parallelen in der H¨aufigkeit von Scheiben um Komponenten von Doppelsternen und der Detektion von Planeten in vergleichbaren Sys-temen legt einen schnellen Planetenenstehungsprozess f¨ur massereiche (>1 MJup)
Penny: Who’s Radiohead?
Sheldon: I have a working knowledge of the important things.
Introduction
The question of how stars form is among the oldest questions asked by astronomers, and two facts seem to have crystallized from investigations over the last few decades: (a) a significant fraction of stars forms in binary systems and (b) at birth, almost every star is surrounded by a circumstellar disk1. Accordingly, binary star formation and the evolution
of their disks must be a significant part of stellar formation research and any comprehensive theory must be able to explain the observed binary star properties such as mass ratios, separations, and disk lifetimes. In addition to star formation itself, the disk material is the basic ingredient for planet formation. And although the existence of more than 50 planets in binary systems is known today, it is not clear how and why some of their characteristics are different from single star planets, like the observation that planetary masses are a function of binary separation (Roell et al. 2012;Duchˆene 2010). Exploration of the preceding phase of circumstellar disk evolution will provide information about the conditions that planets experience when forming in a binary system.
In the following I will summarize part of what is known in the area of (multiple) star formation research in order to prepare the discussion of the topic of this thesis,the evolution of protoplanetary disks in T Tauri binary systems.
1.1
Star formation in the Solar neighborhood
There are a number of regions within the nearest few hundred parsec from the Sun that harbor large amounts of interstellar gas and dust. These molecular clouds, and the dense cores within, provide the location and basic ingredients for the formation of stars and planets. The fact that we can still observe high-density molecular clouds means that these regions have not yet lost all their material to the production of stars and planets or been blown away by strong nearby radiation sources. This, in turn, indicates the relative youth of stars associated with these particular regions, which are typically called Young Stellar Objects or YSOs.
Figure 1.1: Principle stages of star formation as originally proposed by Shu et al. (1987) with the
new classifications byLada(1987) andAndre et al.(1993). Overdense regions in the molecular cloud
collapse to a starless core (Class 0) which subsequently forms a protostar in its center (Class I). Through angular momentum conservation, any initial rotation will result in the formation of a disk around the forming star accompanied by strong outflows along the rotation axis. After a few hundred kyr the star becomes visible at optical and near-infrared wavelengths (Class II), surrounded by an optically thick disk. Outflows and accretion cease within a few Myr after the collapse and the star’s circumstellar disk evolves to an optically thin disk (Class III) and a planetary system may form.
To name a few examples of nearby star-forming regions (SFR): molecular clouds in Ophiuchus, Taurus-Auriga, Chamaeleon, and Orion, in order of increasing distance to the Sun, have been targeted by a large number of studies to investigate the birth and early evolution of stellar and sub-stellar objects. Within these regions, the evolution from an initial so called molecular cloud core to a fully grown star can be described by a model first proposed byShu et al. (1987) which was later refined and complemented by a number of follow-up studies (see McKee & Ostriker 2007, and references therein).
usually called a protostar or, after the classification scheme ofLada (1987) using infrared spectral slope indices2, a Class I object. This stage is characterized by a stellar core
sur-rounded by a disk of primordial cloud material, both of which are deeply embedded in a dense molecular cloud core. These objects, about 0.1 Myr after the initial cloud collapse, are often accompanied by strong outflows along the stellar rotation axis powered by the disk magnetosphere, the disk, or the star itself (e.g. Bouvier et al. 2007).
Until an age of 1–10 Myr, the continuing accretion of material from the envelope and disk will have cleared the surroundings of the young star to reveal the stellar photosphere to the observer. This is called the Class II stage and members of this class are named depending on their mass: stars with masses above ∼2M and up to ∼8M are called
Herbig Ae/Be stars (see Herbig 1960) and stars of lower mass after their prototype T Tau,
T Tauri stars, which was later refined toclassical T Tauri Stars(CTTS). The latter show, in addition to possible outflows and a peculiar near-infrared signature caused by the combined emission from the stellar photosphere and a circumstellar disk (see Fig. 1.3), a wealth of strong emission lines. These are mostly from Hydrogen, but also Helium, Calcium, and a few weaker lines are seen in emission (e.g. Muzerolle et al. 1998b). The responsible mechanism, magnetospheric accretion (briefly outlined in Sect. 1.2), ceases within a few Myrs and leaves behind a Class III star that shows only a weak signature of circumstellar dust and weak emission lines. The designative name for low-mass stars of this category is “weak-line T Tauri Stars” (WTTS). The contraction of the central stellar object has now come to a halt, and the star nearly reached its final size and mass on the main sequence.
As T Tauri stars, both weak-line and classical, are the subject of this thesis, I will discuss them in further detail in the following Sect. 1.1.1.
1.1.1
Observational signatures of T Tauri Stars
The class of T Tauri stars was first phenomenologically defined by Joy (1945) and later refined by Herbig (1962) and Bastian et al. (1983) to contain highly variable late-type (later than F-type) stars with peculiar emission line spectra, associated with bright and dark nebulosity. In addition, it has been found that T Tauri stars, in particular WTTS can be associated with strong X-ray emission and high stellar rotation velocities on the order ofvsini≈10 km s−1 (e.g.Pallavicini et al. 1981). A detailed physical explanation of all the
phenomena at work is still part of current research, although first attempts to describe the basic principles of were made soon after their discovery (e.g.Lynden-Bell & Pringle 1974; Rucinski 1985; Hartigan et al. 1994, and references therein).
In the following I will discuss the observables of T Tauri stars in a little more detail and also give some background on the underlying mechanism of magnetospheric accretion.
2α
IR=dlogλFλ/dlogλis measured between∼2 and∼20µm. Class I:αIR>0, Class II:−1.5< αIR<
Figure 1.2: The star TW Hya observed with X-shooter as an example of a typical emission line spectrum of a CTT star in the optical and near-infrared wavelength range. (Figure from N. Rudolf, pvt. comm.).
Emission lines in T Tauri spectra: magnetospheric accretion
In Fig. 1.2 we see a typical representation of an emission line spectrum of a T Tauri star. The most prominent line is typically the Balmer-α or Hα line at 6563˚A. Other lines frequently found in emission include hydrogen lines such as Paschen-β(12800˚A), and Brackett-γ (Brγ, 21665˚A), as well as Helium (HeI, 5876˚A), the Sodium doublet (NaI,
5890˚A), Oxygen (OI at 7773˚A and 8446˚A), and the Calcium triplet (CaII) at 8542˚A
(Muzerolle et al. 1998b). The excitation of these to the strong levels observed is assumed to be a consequence of the accretion of disk material onto the star channeled along magnetic field lines.
As was inferred from the strong Zeeman broadening and circular polarization of mag-netically sensitive lines, T Tauri stars are usually host to strong magnetic fields powered by a convective dynamo (Bouvier et al. 2007;Reiners 2012). The first measurements byBasri et al. (1992) found values of &1 kG for the weak-line T Tauri star Tap 35 and many more measurements have been made in the meantime suggesting typical magnetic field strengths of several 100 Gauss up to values of more than 5 kG(3) (Reiners 2012;Bouvier et al. 2007).
The existence of strong fields provides the basis to explain most of the observed features of T Tauri stars in the framework of magnetospheric accretion:
The associated dense magnetic fields sweep up the material in the inner disk and channel it along their field lines towards the stellar surface. The removal of disk material causes a truncation of the disk at the corotation radius, i.e., the radius at which the Keplerian velocity of circumstellar material is the same as the speed of the magnetospheric field lines which themselves are coupled to the stellar rotation. While material inside this radius is accelerated towards the star through gravitational attraction, material outside
3compare this to the Solar dipole field of a few Gauss and the maximum field strength inside Sun spots
the corotation radius is flung outward (Bouvier et al. 2007). The accreted gas – essentially freely falling from the corotation radius at a few stellar radii down to the stellar surface – is accelerated to very high velocities. The accumulated kinetic energy is finally radiated away as hot continuum emission when the material shocks at the stellar surface.
The effects of this mechanism are readily observable. (a) broad emission lines are produced by the fast-moving hot gas in the accretion flow and (b) continuum emission in excess of the stellar and disk emission, typically referred to asveiling since absorption lines in the stellar photospheric spectrum appear “filled up”, i.e., veiled. The very good match between the predictions of the magnetospheric accretion model and observations make this the currently favored model of accretion in T Tauri stars. Most previously proposed models such as “boundary layer accretion” (Lynden-Bell & Pringle 1974) appear to be obsolete. The inferred mass accretion rates from the magnetospheric accretion model are consistently on the order of 10−10–10−7M
yr−1 in the T Tauri star mass range (e.g. Natta et al. 2006).
Hα as an accretion indicator. As emission lines are the most easily accessible feature
of accretion, many studies use the equivalent width, or the width at 10% peak height, of Hα emission. The use of Hα is slightly compromised by the fact that emission is not purely generated by accretion but also by chromospheric activity. It has been found, however, that stable lower limits exist below which one can assume that emission is mostly of chromospheric origin and the line strengths above can be used to infer accretion. These are∼5˚A for K-type,∼10˚A for early M stars and&20˚A for the Hαequivalent widths of stars later than M5 (measured by Barrado y Navascu´es & Mart´ın 2003 from Hα measurements of T Tauri stars with no signs of accretion). These are the limits that can be applied to distinguish classical (i.e. accreting) from weak-line (i.e. not accreting) T Tauri stars.
The use of Brackett-γ as an accretion indicator. Accretion measurements in this
thesis rely on the presence or absence of Brγ emission to decide whether a T Tauri star is still in the early phase of active accretion or already ceased to accrete and moved on to the subsequent weak-line T Tauri phase. The use of Brγ instead of the defining Hα
Figure 1.3: The near-IR spectrum of T Tauri and Herbig Ae/Be stars, illustrated here by the example of AB Aurigae. This shows the inherently composite nature of the spectrum consisting of a stellar
part and a bump caused by hot (1600 K) dust at the inner rim of the disk (Figure fromDullemond &
Monnier 2010).
Near-infrared excess
Although 99% of the disk material around a T Tauri star is made up of gas, the near- and far-infrared continuum radiation at λ&2.3µm is dominated by the signature of optically thick dust. The most prominent feature in this wavelength range is the near-infrared emission in excess over a pure stellar spectrum. Fig. 1.3 shows an example for such a spectrum, which can be described as a composite of a stellar spectrum and a ∼1600 K blackbody. The extra radiation has its origin in the inner rim of the circumstellar dust disk. Inside the radius at which the temperature gradient imposed by the heating from the central star exceeds the sublimation temperature of the highly abundant primordial silicates4 (∼1600 K,Duschl et al. 1996) the disk becomes optically thin. This is equivalent
to the existence of an inner hole in the dust disk – first proposed by Bertout et al. (1988) – of a few tenths of AU in size. An inner hole also explains why most T Tauri stars show radiation from a diskand the stellar photosphere, independently of the viewing angle onto the disk. Only in the few cases where the disk is viewed almost edge-on, the stellar light suffers from high extinctions when passing radially through part of the disk material.
Observationally, near-infrared excess can be easily detected by the characteristic colors of T Tauri stars. Meyer et al.(1997) found that the dereddened colors of their sample of 30 classical T Tauri stars align tightly around straight lines in (J−H)–(H−K) and (H−K)– (K−L) color-color diagrams respectively. This distinguishes them from weak-line T Tauri
stars which lie close to the dwarf locus. Representations of these linear relations called
Classical T Tauri Star locus orCTTS locus are shown in Figs. 3.3 and 4.6.
Photometric variability
As was noticed already in the original definition by Joy (1945), T Tauri stars are subject to strong and mostly irregular variability on timescales from hours to months and years. This is true for the broad-band photometry at all wavelengths (radio to X-ray) as well as for the superimposed emission features. On top of a periodic signal due to star spots and modulated by stellar rotation, the reason for this type of variability is stellar youth apparent through coronal flaring and variable accretion and/or extinction (Herbst et al. 1994).
The extensive simultaneous multiwavelength studies of Carpenter et al. (2001, 2002) find that the bulk of T Tauri stars shows photometric variability on the order of 0.2 mag-nitudes in J HKs and ∼0.05 mag in the respective near-infrared colors. The long term
ROTOR study of 72 CTTS over 20 years by Grankin et al. (2007) find a similar picture in the optical: wavelength range variability of CTTS is typically .0.4 mag in V band. Similarly, accretion signatures vary. For example, Nguyen et al. (2009) show for the Hα
10% width and CaII-λ8662 that the derived mass accretion rates vary on the order of
0.35–0.65 dex.
While variability can be used to identify young stellar objects, it also makes observations more complex. Only simultaneous observations can guarantee a proper derivation of, e.g., colors and their correlation with accretion features. And only repeated measurements can reveal the range of values that the parameters of a particular target can assume. Whenever observations at different epochs are taken, one has to account for the possibility that the star under consideration is in a state of weak or strong accretion and the derived numbers may not reflect its typical or average activity.
1.1.2
Young low-mass multiple stars
In their seminal studies,Duquennoy & Mayor(1991),Fischer & Marcy(1992), and Ragha-van et al. (2010) determined the parameters of solar-type and lower-mass main-sequence multiple stars. Around half of all G-type and 42% of all M-type stars are found to be multiples with typical separations between a few and a few hundred AU with a slight ten-dency towards more equal mass components with decreasing primary mass. The picture of young stars in nearby clusters and associations is similar to some degree, though with a few peculiarities owing to the partly dense stellar environment and the dynamically young state of star forming regions.
Multiple stars in nearby star-forming regions
(ONC) and Lupus show companion star fractions that are comparable to the fraction in the field (in the same separation and spectral type range, Duchˆene 1999), others including Taurus-Auriga and Ophiuchus show binary fractions that are up to twice as high (Leinert et al. 1993; Prosser et al. 1994; Brandner et al. 1996; Padgett et al. 1997; Petr et al. 1998; Duchˆene 1999; K¨ohler et al. 2006). Furthermore, mass ratios seem to vary from one region to another and there is evidence for a radial dependence of binary parameters on the distance to the densest parts of star forming clusters. For example, while typical binary separations are∼40 AU in nearby star forming regions (Simon et al. 1995), binaries in the center of the Orion Nebula Cluster appear to be, on average, tighter than their counterparts in the cluster’s outskirts (Reipurth et al. 2007). Some of these observations can be explained by the increased chance of dynamical interactions with other cluster members or with passage through the gravitational potential well in the cluster center. Others are likely a direct consequence of the formation process of these “dynamically young” multiple stars which have had only little time for interaction after their formation in regions of low stellar density.
In addition to binaries (i.e. multiples consisting of 2 stars) higher-order multiples also exist in significant numbers. For example,Correia et al. (2006) find 7 triples and 7 quadru-ples among their 52 observed systems in several star forming regions. For reasons of dy-namical stability, these multiples often take the form of hierarchical multiples, i.e., they consist of a close binary system orbited by a wide component which itself can be multiple. In the further course of this thesis, I will usually not make a clear distinction between binaries and higher-order multiples since the hierarchy allows me to treat, e.g., triples as two binaries: the close binary system and another binary consisting of the combined close system and the wide tertiary component.
The formation of multiple stars
From the observation that we find at least as many binaries in young star-forming regions as in the field we can infer that binary formation must have happened before an age of at most a few Myr. However, the mechanisms at work are not yet understood. Since the details of binary star formation do not have direct consequences for the results of this thesis they will not be discussed in depth here. I will give only a short summary of the current scenarios and the interested reader is recommended to consult the comprehensive review byTohline (2002) or, more recently, Goodwin et al. (2007).
simulations can reproduce all observed binary parameters and it is up to future studies to prove either mechanism to be more or less likely at work in multiple star formation.
Observational evidence with implications for the binary formation process comes, for example, from optical and near-infrared studies. The high fraction of binaries with coeval components, deduced by comparing component luminosities and effective temperatures with theoretical isochrones, is a clear indication for simultaneous formation through frag-mentation (e.g. Hartigan et al. 1994; Brandner & Zinnecker 1997; White & Ghez 2001; Kraus & Hillenbrand 2009). Furthermore, there are indications that grain evolution is indeed similar for both components of a binary (Skemer et al. 2011), again suggesting simultaneous formation of all binary components during the same process.
1.2
Protoplanetary disks and their evolution
In addition to the mostly phenomenological definition in the last section it will be fruitful to discuss the physical properties of T Tauri stars a little bit more. As it is the most striking characteristic of the class of T Tauri stars, I will focus here on the circumstellar disk. The evolution and lifetime of primordial circumstellar disks is particularly worthwhile to discuss since it not only reflects the timescale for the formation of the star itself, but it also dictates the maximum time available for planet formation. An alternative name for circumstellar disk which does justice to the fact that planets may form from the primordial disk material (see e.g. Sect. 1.2.2) is protoplanetary disk. Both terms will be used synonymously in the following, however with a preference for “protoplanetary” when the formation of planets is discussed.
We learned briefly in Sect. 1.1 that disks are formed in the early evolution of a star to satisfy angular momentum conservation during collapse. First direct imaging evidence that circumstellar material actually takes the shape of a disk came from observations with the
Hubble Space Telescope (HST) which shows dark disk-like structures in front of the bright nebular background of the Orion Nebula (O’Dell et al. 1993;McCaughrean & O’dell 1996). The exact distribution and evolution of material in these disks has since been discussed in many theoretical studies (Dullemond & Monnier 2010, and references therein).
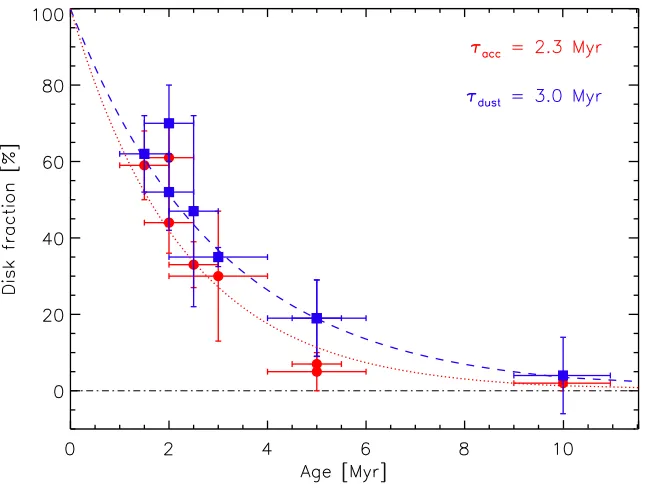
Optical, near-infrared, and sub-mm observations seem to have secured the following facts about protoplanetary disks: (a) initial disk masses are correlated with the central star mass with typical values ofMdisk ≈100M⊕ (Natta et al. 2000;Wyatt 2008), (b) disk sizes are typically found to be on the order of a few ten to a few hundred AU (Dutrey et al. 1996;Vicente & Alves 2005;Williams & Cieza 2011), and (c) disks have lifetimes of at most∼10 Myr (Haisch et al. 2001;Fedele et al. 2010). The latter fact is nicely visible in Fig. 1.4. It suggests an exponential decay of disk frequency with cluster age with a time constant of ∼2–3 Myr.
Figure 1.4: The decay of disk frequency with the age of the star-forming region. Blue squares
show the fraction of objects with IRAC [3.6]−[8.0] excess in each star-forming region, indicating the
presence of hot dust in the inner disk. Red circles show the fraction of targets with Hαexcess, i.e.,
ongoing accretion. The blue dashed line and red dotted line show the best fit exponential decay to
the two distributions (after Fedele et al. 2010).
2007; Andrews & Williams 2005). The conclusion from the combination of observations at different wavelengths: After the formation and evolution of a disk over a timescale of up to 10 Myr the disk disperses very rapidly within less than 0.5 Myr (Cieza et al. 2007). Predictions of the onset of disk dispersal for an individual target cannot yet be made and it remains unclear why some stars loose their disk already before an age of 1 Myr and some retain their disks up to several times this age.
1.2.1
The influence of stellar companions on circumstellar disks
The most striking impact of a stellar companion on the evolution of a circumstellar disk is the truncation of the disk through tidal interaction. This was first theoretically discussed byPapaloizou & Pringle (1977) andArtymowicz & Lubow (1994) who derive a maximum outer disk radius that is roughly 1/3 of the binary separation for an equal mass binary5
with vanishing orbital eccentricity.
Despite the seemingly simple direct consequence – a smaller than usual circumstellar disk – the implications of stellar binarity for disk evolution are complex and mostly lack confident predictions by theory. To explore the implications of the existence of stellar
5For mass ratios q < 1, the primary disk is a bit larger and the secondary disk a bit more strongly
companions to disk-bearing stars, observational evidence was gathered in a number of recent studies. Most of these rely on rather small samples or are compiled from heteroge-neous sources that make an interpretation difficult. Though, building on this evidence new studies, including the present thesis, will help to substantiate (or invalidate) the following hypotheses with better statistics.
The evolution of the inner disk in binaries
A lot of our knowledge about the evolution of circumstellar disks comes from optical and near to mid-infrared studies of spatially resolved and unresolved binaries. These provide information mostly about the innermost parts of the disk, less than a few AU from the star, where the high temperatures and ongoing accretion processes produce significant radiation in the 0.5–20µm regime. These inner disk surveys can stand on their own but can also be interpreted with respect to the finding that the existence of an inner disk is in general correlated with the existence of dust material in the outer disk (Andrews & Williams 2005).
T Tauri binaries come in all combinations of disk/no-disk. The absence of T Tauri binaries with only one component surrounded by a disk, as inferred from the accretion indicator Brγand fromK−Lexcess, ledPrato & Simon(1997) to the conclusion that mixed systems are rare. Although this was shortly later confirmed using Hα (Duchˆene et al. 1999), both studies suffered from small sample sizes and possibly from observing a star forming region (Taurus) that is not representative for the general evolution of disks in binaries. As was discussed byMonin et al.(2007), Taurus does show a slightly lower fraction of mixed pairs than other regions (∼10% of Taurus binaries are mixed), but in general a high abundance of mixed pairs of around 20% was found by larger studies in several regions and with good statistics (White & Ghez 2001; Hartigan & Kenyon 2003; Prato et al. 2003).
Disks in binaries are shorter lived. As expected by theory (see considerations in e.g. Monin et al. 2007), it was observed that close binaries lose their disks earlier than wide binaries and single stars. This was inferred from the observation that only few binaries with separations .40 AU show signs of disk presence (Bouwman et al. 2006; Cieza et al. 2009;Kraus et al. 2012). Under the likely assumption that there is no systematic preference for binaries to form earlier than singles in the same cluster, disk evolution in most close binaries must have finished already before an age of ∼1 Myr, while single stars were found with disks up to much longer timescales of several Myr. Interestingly, 1/3 of all close binary components do not lose their disk early. Part of these can be explained by the fact that usually only minimum (projected) binary separations are known and the factual binary separation is much wider than it appears. Other proposed mechanisms are the feeding from circumbinary reservoirs or the same, currently unexplained, process that determines why some single star disks disappear after 1 Myr and others only after 5 Myr.
The disk around the less massive component disappears first. The number of mixed pairs with an accreting primary was found to be significantly higher than the number of mixed pairs with an accreting secondary (White & Ghez 2001; Monin et al. 2007). Considering that the components of a binary are usually coeval (Hartigan et al. 1994; Brandner & Zinnecker 1997; White & Ghez 2001; Prato et al. 2003; Kraus & Hillenbrand 2009), this can be used as an indicator that disks around the less massive binary component evolve faster than primary disks. Although this is against the trend that less massive single stars retain their disks for longer (Carpenter et al. 2006), it might be explained by the more severe truncation of the less massive components’ disks and a consequential earlier disk exhaustion. Alternatively, it could be that some observational studies are biased by the possibility that the more massive primaries are stronger accretors (White & Ghez 2001) and thus more easily detected. The trend for more strongly accreting primaries, however, was not confirmed by all subsequent studies (e.g.Prato et al. 2003).
Disk parameters co-evolve in binary components. Similar to the observation that binary components are of similar age, it was also observed that other disk-related stellar param-eters are more similar between the components of a binary than between randomly paired single stars. Optical and near-infrared studies find that accretion luminosities, mass accre-tion rates, near-infrared excess, and dust grain evoluaccre-tion are similar between the compo-nents of binaries at all separations (Hartigan & Kenyon 2003; McCabe et al. 2006;Skemer et al. 2011).
Another observation was made by White & Ghez (2001), who find that close systems with separations <200 AU are less often mixed pairs than wider binaries. This leads to the interpretation that disk evolution is synchronized in close systems, while in wide sys-tems it is not. Explanations for this phenomenon range from a similar angular momentum distribution at birth to feeding of the individual disks from a circumbinary reservoir.
Mass accretion rates show no dependence on binary parameters. The mass accretion rate inferred from Hα observations by Hartigan & Kenyon (2003) suggest that there is no difference between components of binary stars and singles. Another surprising result given the rather different environment that a truncated disk poses to the sustainment of a disk. The interpretation of this observation is difficult (see also Question 3 in Sect.1.3).
The cold outer disk material in binaries
There are a few studies that use sub-/mm observations to assess the evolution of the cold outer disk material in binary stars. Since spatially resolved observations of close binaries are difficult to obtain for a significant number of binaries, most of the previous studies observe cold dust and gas with no information about whether the circumstellar material is located around either binary component or in a circumbinary reservoir. Only very few and recent studies acquired spatially resolved radio data for a large number of targets.
sepa-ration) binary stars is significantly weaker than from wider binaries and single stars. This finding is in good agreement with the expected truncation of disks through tidal inter-actions and was confirmed by studies of Andrews & Williams (2005) and Harris et al. (2012). In addition to component disk truncation,Jensen et al. (1996) find that the mass of circumbinary disks around <100 AU binaries can be at most ∼5MJup, although a few
exceptions with circumbinary disks of higher mass do exist (e.g. GG Tau, Dutrey et al. 1994).
A recent study uniquely capable of assessing the differential evolution of disks in bi-naries was published byHarris et al. (2012), who present high-spatial resolution sub-/mm interferometry of 23 binaries in Taurus, 14 of which have spatially resolved disk detections. Surprisingly, the measured individual disk sizes do not agree with theoretical predictions of tidal disk truncation. This indicates that not only truncation but also other processes (for example accretion) must be involved in the determination of disk parameters like their size.
1.2.2
A short note on planets in binaries
If the conditions imposed on a circumstellar disk by the presence of a stellar companion are not entirely hostile to planet formation, we expect to see at least some binaries with planetary systems. Owing to the efforts of several dedicated observing programs (e.g. Eggenberger et al. 2007; Daemgen et al. 2009; Eggenberger & Udry 2010; Muterspaugh et al. 2010; Roell et al. 2012), we know of more than 50 stellar binary systems which are host to planets (for a recent list see Roell et al. 2012) and an additional number of new candidates will likely come from the evaluation of recently acquired data from the Kepler satellite (see e.g. Adams et al. 2012). Since most of the properties of these planets are determined during their formation, they must reflect the conditions in the circumstellar disk. Hence, studying the population of planets in binaries will contribute additional information about disk evolution in binaries.
While many interesting studies of planets in binaries were published in the recent years, I would like to focus on one interesting finding in particular. More information can be found in the short discussion in Sect. 3.3.3 and, e.g., the article by Eggenberger & Udry (2010). Duchˆene (2010) compiled the projected separations and minimum planet masses of all planets found around a binary component known at the time. The striking feature in the
msini–separation diagram is the absence of close (<100 AU) binaries with planets below 1MJup. Although an observational bias cannot be ruled out completely6, this observation
can possibly give information about the planet formation process in binaries. Together with the finding that in close binaries the disk evolution timescale is shorter than in wide binaries, this could point to a different formation process for high- and low-mass planets respectively. For example, if low-mass planets are formed by a rather slow process (like core accretion, see e.g. Pollack et al. 1996) and higher mass planets are formed before the
6The detection of planets in binaries with the radial velocity technique is particularly difficult in close
rapid dispersal of close binary disks (e.g. via gravitational instability, Boss 1997), then this signature would be expected. With the currently rapid increase of highly sensitive observations targeting planets and disks it will soon be possible to place strong constraints on the planet formation process in binaries and thus planet formation in general.
1.3
Open issues and the aim of this thesis
The previous sections give a brief summary of today’s knowledge about the formation and evolution of protoplanetary disks in low-mass binary stars. The current picture of binary star formation, however, is still incomplete and ever evolving. This thesis presents the largest spatially resolved study of T Tauri binaries in a clustered star forming region, the Orion Nebula Cluster, and the most complete study of inner disks around binary components in Chamaeleon I. It aims at addressing some of the currently open questions that naturally arise from the increasing set of observations and theoretical expectations about stellar formation with focus on multiple systems. In particular, I will address and attempt to answer the following items:
Are disks around components of visual T Tauri binaries in the ONC and
Cha I shorter-lived than single star disks?
The presence and properties of disks around single stars in nearby star-forming regions including the ONC and Cha I have been subject of many previous studies. The derived fractions of single star accretors of ∼50–55% in the ONC and ∼44% in Cha I agree well with the suggested decay of disk frequency in Fig. 1.4. The inferred timescales for disk evolution set the timescales available for the formation of the stars themselves and for planet formation. The evolution of material in disks around the components of binary stars is disturbed and disks are truncated. This influence can cause disks to evolve on different timescales with implications for star and planet formation. This thesis presents an assessment of the frequency of binary components with ongoing accretion and/or hot circumstellar dust with the help of the currently two largest nearly-simultaneous spatially-resolved photometric and spectroscopic observations of binaries in the ONC and Cha I. The measured disk frequencies are compared to the corresponding single star values in order to measure the impact of binarity in a separation range of∼25–1000 AU.
What is the lifetime of disks around the components of T Tauri binaries?
individual binary components dissolve. This evolution is compared to the single star disk frequency, which is known to decay approximately exponentially with a time constant of 2–3 Myr.
Is the mass accretion universal, i.e., independent of binarity or star forming
region?
The mass accretion rates of low-mass single stars in various star-forming regions are known to be consistently on the order of ∼10−9 to ∼10−7Myr−1. The environments of disks around the components of T Tauri binary stars of separations up to a few 100 AU are, however, significantly different to that of single stars: disks are smaller, less massive, and their evolution is disturbed by the gravitational and radiative influence of the stellar com-panion. Is accretion, i.e., the transport of material from the disk onto the stellar surface, sensitive to those changes at the outer edge of the disk? Or is it primarily determined by the conditions in the innermost parts of the disk where the accretion overflow takes place and which are barely influenced by the presence of a stellar companion? The present data are used to measure the mass accretion rates in the individual components of∼25–1000 AU binaries. Correlations with component masses and binary separations are explored to sta-tistically assess the influence of binarity on mass accretion rates.
1.4
Structure and content of this thesis
This thesis analyzes and discusses the evolution of protoplanetary disks around the indi-vidual components of T Tauri binary stars in nearby star-forming regions. The discussion of these observations and the implications for the field of binary disk evolution in low-mass binary systems are organized as follows.
Chapter 2 introduces adaptive optics spectroscopy with which a major part of the
ob-servational data were acquired. The chapter explains why near-infrared adaptive optics observations are required for this project and summarizes the basic principles of the tech-nique. Details are provided about the impact of the use of adaptive optics on spectroscopic observations with a long slit and an integral field unit by the examples of NACO and SIN-FONI instruments on ESO’s Very Large Telescope (VLT), respectively.
Chapter 3 presents a near-infrared photometric and spectroscopic study of the
individ-ual components of 26 T Tauri binaries in the Orion Nebula Cluster, the currently largest study of this kind in a clustered star-forming environment. The strength of Brγ emission is used to infer the presence and strength of active magnetospheric accretion in each stellar component. H−Ks color excess indicates the presence of hot circumstellar dust. These
ra-tios. Differential disk evolution, mass accretion rates, and implications for the formation of planets around the components of binaries with∼100–600 AU in the ONC are discussed.
Chapter 4 presents the currently largest nearly-simultaneous 1.25–3.5µm photometric
and spectroscopic study of spatially resolved multiple stars in the Chamaeleon I star form-ing region. The presence of hot circumstellar dust is inferred from Ks−L0 color excess and
ongoing accretion is indicated by Brγemission for each individual binary component. The data return spectral types, luminosities, masses, and ages of all stellar components which are discussed in terms of their influence on the presence of disks and the measured mass accretion rates in binaries of separations between ∼25–1000 AU.
Chapter 5 compares the findings of the ONC and Cha I studies in this thesis and
sup-plements these with literature data from surveys of the Taurus star-forming region. Con-clusions about the measured disk frequencies are brought into context with the age of the respective population and with binary separations to measure disk evolution timescales.
Chapter 6 summarizes the conclusions from the previous sections. An outlook is
Adaptive Optics spectroscopy
Most of the observational data of this thesis require observations in the near-infrared with an angular resolution as high as possible. The currently most efficient technique to observe a large number of targets close to the theoretical resolving limit of today’s largest ground-based telescopes isAdaptive Optics (AO) which can be combined with both imaging and spectroscopic observations. This chapter gives a short introduction to the scientific and technical aspects of high-spatial resolution spectroscopy with AO. As most observations were taken with NAOS-CONICA (NACO) and SINFONI on ESO’s Very Large Telescope (VLT), these two instruments will serve as examples for the implementation of the techniques of long-slit and integral field AO spectroscopy, respectively.
2.1
Close visual binaries: the need for high-spatial
resolution spectroscopy
In order to disentangle the effects of stellar, binary, and disk parameters on disk evolu-tion, investigations of binaries must study the individual stellar components for their disk properties. While unresolved, combined-light studies can determine the presence ofat least one disk in a binary system they cannot give information about whether the more or less massive component is host to the circumstellar material or both. The important correla-tion of the individual disk lifetimes with stellar mass1 is thus inaccessible with unresolved
observations. In addition, there is evidence that mixed systems with only one accreting component exist in probably all star-forming regions (Monin et al. 2007). The underlying mechanisms that determine therelative speed of disk evolution require further study with necessarily spatially resolved binary observations.
One of the most interesting ranges of binary separations for the study of the evolu-tion of circumstellar disks is the range between ∼10 AU and a few times 100 AU. On one hand, the observed binary separation distribution of young stars peaks at ∼30 AU (
Lein-1In binaries, individual component disk sizes are a function of binary separation and component masses
ert et al. 1993), which renders this range particularly worthwhile studying as binaries are most common with these separations. On the other hand, while the truncation of the outer disk to ∼1/3 of the binary separation (Artymowicz & Lubow 1994) is stronger the closer the binary system and is most severe in systems with separations <100 AU, wide systems 100 AU are not expected to significantly alter disk evolution (Monin et al. 2007). Bi-naries with separations in the range of ∼10–1000 AU accordingly contain both disks with significant truncation and disks with rather unchanged properties. These binary separa-tions are therefore suited to explore a wide range of possible impacts of stellar companions with the outer disk material.
The nearest star-forming regions are located at ∼140–160 pc from the Sun. At this distance, the closest binaries in the identified separation range appear with angular sepa-rations of down to ∼000.1. This is below the seeing limit of ground-based observations and accordingly spatially resolved observations require either the use of space-based observa-tories or high-spatial resolution techniques from the ground. While inner disk signatures (accretion/circumstellar dust at ∼1000 K) are strongest in the optical and near-infrared wavelength range, the longer near-IR wavelengths enable the observer to more deeply pen-etrate the regions of strong extinction, which are a common feature of star-forming regions. The currently most efficient method for near-IR observations at high spatial resolution is
Adaptive Optics. While it enhances angular resolutions from the seeing limit (&000.5 at the best observing sites) to close to the theoretical diffraction limit (∼000.06 atλ= 2µm on an 8 m telescope) it also provides sufficient sensitivity to observe faint low-mass stars at
>100 pc at a good signal to noise ratio (SNR) and can be combined with both imaging and spectroscopic instruments. Observations with the latter are required for the study of disks in binaries to measure accretion signatures such as emission lines and simultaneously obtain a measurement of the spectral type and extinction of the target source.
In summary, observations for the purpose of studying the evolution of inner circumstel-lar disks around low-mass stars require imaging and spectroscopy at high spatial resolutions at near-infrared wavelengths. This is done most efficiently for a large number of targets with ground-based observations supported by adaptive optics.
2.2
A short introduction to Adaptive Optics
Adaptive optics are by now a well-established part of astronomical instrumentation. Every large ground-based observatory operates AO facilities to extend the range of application of their instruments to observations at high angular resolution. This section will therefore only summarize the basics of this technique and the interested reader is recommended to refer to the pertinent literature (e.g.Beckers 1993;Hartmann 1998;Davies & Kasper 2012, and references therein). The focus of this chapter shall be on the use of adaptive optics with near-infrared spectroscopy, which is described in the subsequent sections.
The Earth’s atmosphere is subject to turbulences caused by patches of air of different temperatures, densities, and humidity, causing a constant change of the refractive index n
Tip Tilt mirror
Deformable Mirror Science Camera
Wavefront Sensor
Computer Distorted wavefront
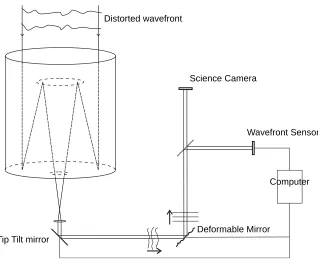
Figure 2.1: Schematic diagram of an Adaptive Optics system integrated into the light path of a telescope. The distorted light enters the telescope, is reflected via the tip-tilt mirror and a deformable mirror onto a beam splitter that redirects part of the light to a wavefront sensor and lets the rest pass to the science camera. The signal from the wavefront sensor is measured, interpreted, and forwarded to the tip-tilt and deformable mirrors which flatten the incoming wavefront.
of interest. The imposed chaotic wavefront distortions of theseturbulence cells – caused by the fact that the speed of light in air is a function of temperature – cause a seeing-induced
full width at half-maximum FWHMseeing = λ/r0 which is equal to a value of ∼000.7 at a
wavelength ofλ = 2.2µm, assuming the canonical value ofr02.2µm≈0.6 m for the size of the turbulence cells, called Fried parameter r0 (see e.g. Fried 1965; Glindemann et al. 2000).
This is rather large compared to the width of the ideal diffraction limited point spread function (PSF) of a circular telescope aperture of width D, calledAiry function, of
FWHMAiry= 1.03 λ
D (2.1)
which returns a more than ten times better resolution of FWHM = 000.06 at λ= 2.2µm with current 8 m telescopes. While the theoretical diffraction limit becomes smaller with decreasing wavelength the seeing limit is larger at optical wavelengths due to the wavelength dependence of the Fried parameter ofr0∝λ6/5 (Fried 1965; Karo & Schneiderman 1978).
measured and corrected in real-time. Reflection off adeformable mirror (DM)2, adapted to assume the measured shape, leaves the reflected wavefront ideally with no atmospherically induced aberrations. The quality of the correction is limited by the fact that turbulent changes in the atmosphere happen on rather short timescales. The typical coherence time
τ0 ≈r0/|v|, i.e., the time during which the aberrations through the atmosphere can be
assumed to be constant, is on the order of a few times 10 ms (assuming a wind speed v
of a few 10 ms−1,Beckers 1993; Glindemann et al. 2000). This is the maximum time that is available between measuring the shape of the wavefront and its correction. Corrections that are applied slower than the coherence time can at best partly correct the imposed aberrations since the atmosphere already changed significantly.
The demands on the wavefront measuring routine are accordingly high: at a rate of up to 1 kHz it needs to take an acquisition of the incoming wavefront, determine its shape, and pass this information to the deformable mirror. This requires a suitable wavefront reference which is ideally (i) a point source above the atmosphere (to be able to assume that the undisturbed wavefront is approximately flat and passed all of the medium that generates the turbulences), (ii) which provides enough light to be imaged with millisecond snapshots, and (iii) that is close enough to the scientific object of interest to experience the same aberrations. This is usually provided by a star within 3000 of the science target3
with a minimum brightness determined by the used instrumentation, e.g., V <16.7 mag or
K <12–13 mag in the case of NACO/VLT (see Sect. 2.3.1).
To measure the shape of the wavefront, so-called wavefront sensors are used which receive part of the light reflected from the deformable mirror. Three principally differ-ent designs are currdiffer-ently favored: Shack-Hartmann-type, curvature sensing, and Pyra-mid wavefront sensors. The first two are used by the NAOS (Sect. 2.3.1) and SINFONI (Sect.2.3.2) adaptive optics modules, respectively. Shack-Hartmann wavefront sensors use arrays of lenses (so called lenslets) to measure the distortion of individual parts of the wavefront. While the undistorted wavefront passing the lenslet array creates a regular pat-tern of spots on a CCD, wavefront aberrations cause a displacement of the individual spots. This displacement is converted into a distortion model which is used as an input signal for the actuators of the DM. Curvature sensing exploits the fact that a distorted wavefront will not focus exactly in the focal plane like in the undistorted case. Measurement of an increase of the intensity in front of or behind the focal plane indicates the degree and shape of a distortion and is passed on to the DM to correct the incoming wave. Limitations of both techniques are the high demand on computing power to update the correct shape of the DM within a coherence period and the limited number of actuators that can be placed
2The “Tip” and “Tilt” signals, i.e., uniform gradients of the wavefront in x and y direction, often
require the use of a separate optical component, e.g., aTip-Tilt mirror, since they are typically too large for correction with the DM.
3The quality of the correction is a function of the size of theisoplanatic angle, i.e., the angle under which
on the DM to correct for high-order aberrations4.
The performance of adaptive optics can be measured by means of theStrehl Ratio, which is defined as the ratio of the measured and theoretical, purely diffraction-limited peak flux of a point source. While seeing-limited Strehl ratios are typically less than a few per cent, AO-corrected observations can improve the Strehl ratio to more than 40% at λ= 2µm, depending on reference source brightness and seeing conditions. At these high Strehl ratios, the angular resolution is nearly identical to the theoretical resolution power of the telescope (see e.g.Le Louarn et al. 1998). The correction is wavelength-dependent due to an increase of the coherence times and lengths with wavelength. Accordingly, high Strehl ratios are mainly obtained at infrared wavelengths, while optical corrections require comparably large instrumental and computing effort to achieve even minor improvements. Already over a wavelength range from∼2.2µm (K-band) to ∼1.25µm (J-band), the typical Strehl value can decrease from ideally &50% down to .10%. A Strehl ratio <100% implies that the detected flux is not distributed in the shape of an ideal Airy pattern. In fact, the shape of an AO PSF can be described as a superposition of a diffraction-limited core and a seeing-limited “halo”.
The above describes the basic concept and characteristics of reducing the impact of atmospheric turbulence on ground-based astronomical observations with adaptive optics. Constraints on the applicability of this concept to a particular scientific question arise, however, for example from the limited sky coverage due to guide star magnitude limits, the improvable Strehl ratio in particular at short wavelengths, or the small isoplanatic angle. Concepts to tackle these and other points do exist and are either already in use or are currently being installed (Laser guide star AO,ground-layer AO; e.g.Wizinowich et al. 2006;Rabien et al. 2010), have proven their feasibility (multi-conjugate AO;Beckers 1988; Marchetti et al. 2003), or are planned for special purposes such as the direct imaging of planets (extreme AO; e.g. Sauvage et al. 2010).
2.3
Spectroscopy with Adaptive Optics
The gain of the use of AO for observations of close visual binary stars is obvious: the high spatial resolution allows to separately obtain spectral information from both components of a binary. Additionally, most of the light is concentrated into the central peak of the PSF which is equivalent to an increase of the S/N. In the following I will discuss the implications of the use of adaptive optics for stellar spectroscopy with a long slit by the example of NACO (Sect. 2.3.1) and the principally different method of integral field spectroscopy with SINFONI (Sect. 2.3.2).
4The number of actuators limits the number of different aberrationmodes that can be generated with
2.3.1
Long-slit spectroscopy with NACO
NACO, short for NAOS-CONICA, is an imaging and spectroscopy instrument at the VLT consisting of the Nasmyth Adaptive Optics System (NAOS) operated in the visible and infrared, and theCONICAcamera sensitive at all near-infrared wavelength bands between ∼1 and 5µm (Lenzen et al. 2003; Rousset et al. 2003). Among other observing modes, spectroscopy is offered as grism spectroscopy with a long slit of dimensions 000.086 or 000.172 × 2800 with a spectral resolution ofR=400–1400 for wavelengths between ∼1 and ∼4µm.
Wavelength-dependent slit losses. A prominent feature uniquely attributable to the
use of AO in spectroscopy is a wavelength dependence of the PSF in Strehl ratio and shape, owing to the wavelength-dependent efficiency of the AO correction. This has implications for both integral field and long-slit spectroscopy, but in particular the latter can suffer from wavelength-dependentslit losses, i.e., the fact that only the central part of the light bundle can pass if the PSF is significantly wider than the slit. While wavelength-independent slit losses can easily be calibrated, the induced slope on the extracted science spectra can mimic a different level of interstellar extinction than actually present (see Sect. 3.2.2 for the derivation of extinction in NACO spectra of ONC binary components). It is therefore important to have control over the impact of slit losses on the extracted spectral slope.
The magnitude of the wavelength-dependent losses can be estimated with, e.g., the information from the NACO manual5 that a NACO Strehl ratio in K-band (2.2µm) can
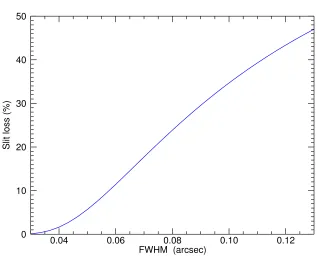
be larger than 30% under good conditions while in J-band (1.25µm) only a few per cent may be achieved. If we assume good observing conditions, values of 40% at 2.2µm and 10% at 1.25µm are reasonable. The corresponding FWHM of 000.075 inK-band and 000.059 inJ6 combined with the use of the 000.086 wide slit of NACO imply that considerably more flux in J-band passes the slit than atK wavelengths. While a simulation of AO PSFs is highly complex (e.g. Tristram & Prieto 2005), an order-of-magnitude estimate of the slit losses as a function of FWHM was simulated using Gaussian PSFs, shown in Fig.2.2. The inferred 11% slit loss at a FWHM of 000.059 (i.e.J-band) and 21% slit loss at FWHM = 000.075 (K-band) support the qualitative considerations about the wavelength dependence of the slit losses.
Since slit losses also depend on the – timely variable – Strehl ratio of the individual observations, calibration of the spectra can be complicated. This is particularly true when a wide spectroscopic wavelength range is assumed as in the above example. Observations of binary components in the Orion Nebula Cluster in this thesis, however, use a short wave-length range of ∼2–2.5µm. The effect of wavelength-dependent slit-losses is accordingly significantly smaller. To estimate the magnitude of the wavelength-dependent slit losses for these observations, we conservatively assume that the FWHM increases from 000.07 to 000.08 from the blue (∼2µm) to the red edge (∼2.5µm) of the observation (estimated from the increase of the FWHM between J and K-band from 000.06 to 000.075). Approximation
5http://www.eso.org/sci/facilities/paranal/instruments/naco/doc/
6Simulated with the NAOS preparation software, http://www.eso.org/sci/observing/phase2/
0.04 0.06 0.08 0.10 0.12 FWHM (arcsec)
0 10 20 30 40 50
Slit loss (%)
Figure 2.2: Slit losses as a function of the FWHM of a Gaussian PSF. The simulations estimate the fraction of light that does not pass the spectroscopic slit assuming the instrumental parameters of
NACO, i.e., a 000.086 wide slit and a pixel scale of 000.01326 pix−1.
with a Gaussian function enables me to estimate the change change in slit loss to be∼5% (Fig. 2.2). This would induce an artificial slope in the spectra which can be falsely inter-preted as a reduced extinction of ∼0.8 mag, smaller than the typical uncertainty in this study (see Sect.3.2.2for the derivation of extinction from NACO slit spectra). In addition, the increase of 5% is only an upper limit since the composite AO PSF is not Gaussian but keeps a significant fraction of its light in the wings of the airy pattern and the seeing-limited halo which has a size independent of the Strehl ratio (and will thus be truncated to the same degree by the slit) and the real increase of FWHM within K-band is likely smaller than the anticipated conservative 000.01. The real change of slit-losses between 2µm and 2.5µm is accordingly likely 5% and will only add to the noise budget of the derived parameters with no significant consequences for the scientific considerations in this thesis.
Line shape. In addition to a wavelength dependence, AO PSFs are subject to temporal