281 |
P a g e
APPLICATION OF RANDOM FOREST IN VARIOUS
FIELDS AS THE MOST RELIABLE AND EFFECTIVE
DATA MINING TECHNIQUE
Mayank Chauhan
1, Neha Chauhan
21, 2
Bachelor of Technology, Computer Engineering, College of Technology, Pantnagar, (India)
ABSTRACT
This paper reviews the work done in various papers in the field of random forest to emphasize its importance as
an important data analysis algorithm while comparing it with other algorithm at some places and sometimes
using the algorithm with other methods for better accuracy at tree learning. It also studies the practical
experiments done to establish the superiority of random forest over other algorithms and thus suggests
extending its use in other important sectors where it has not yet been implemented. The use of random forest in
the field of analyzing student performance, predicting financial crisis in business and predicting disease risk
from highly imbalanced data has been studied here which will give an outline on how it will work for other
fields in which its use will be suggested.
I. INTRODUCTION
Decision trees are a popular method for various machine learning tasks. Tree learning comes closest to meeting
the requirements for serving as an off-the-shelf procedure for data mining because it is invariant under scaling
and various other transformations of feature values, is robust to inclusion of irrelevant features, and produces
inspectable models. In particular, trees that are grown very deep tend to learn highly irregular patterns: they
overfit their training sets, because they have low bias, but very high variance. Random forests are a way of
averaging multiple deep decision trees, trained on different parts of the same training set, with the goal of
reducing the variance. This comes at the expense of a small increase in the bias and some loss of interpretability,
but generally greatly boosts the performance of the final model.
Bagging-:The training algorithm for random forests applies the general technique of bootstrap aggregating, or
bagging, to tree learners. Given a training set X = x1, …, xn with responses Y = y1, …, yn, bagging repeatedly
selects a random sample with replacement of the training set and fits trees to these samples:
For b = 1, …, B:
Sample, with replacement, n training examples from X, Y; call these Xb, Yb.
Train a decision or regression tree fb on Xb, Yb.
After training, predictions for unseen samples x' can be made by averaging the predictions from all the
individual regression trees on x':or by taking the majority vote in the case of decision trees.
This bootstrapping procedure leads to better model performance because it decreases the variance of the model,
without increasing the bias. This means that while the predictions of a single tree are highly sensitive to noise in
its training set, the average of many trees is not, as long as the trees are not correlated. Simply training many
training algorithm is deterministic); bootstrap sampling is a way of de-correlating the trees by showing them
different training sets. Random forest : The above procedure describes the original bagging algorithm for trees.
Random forests differ in only one way from this general scheme: they use a modified tree learning algorithm
that selects, at each candidate split in the learning process, a random subset of the features. This process is
sometimes called "feature bagging". The reason for doing this is the correlation of the trees in an ordinary
bootstrap sample: if one or a few features are very strong predictors for the response variable (target output),
these features will be selected in many of the B trees, causing them to become correlated. Typically, for a
dataset with p features, √p features are used in each split.
This random forest algorithm is then used in the following fields:
1.1 Education
A large number of educational institutes in the world have employed the academic credit system in training and
education. The educational data in these organizations gets larger over time. Mining such data for educational
decision making support has been of interest recently called the educational data mining. Due to flexibility of an
academic credit system, educational data mining in this system is full of difficulties which have not yet been
addressed properly.
1.2 Business
The exact prediction of financial crisis has become an essential research task for decision makers. In previous
years, simple data mining techniques were successfully used for the purpose, but due to the increasing amount
and complexity of the data gathered it has become difficult to analyze thus the random forest acts as an efficient
method to handle these complexities with great ease. Along with RF another theory i.e. Rough set theory(RST)
is also used to handle the uncertainty and vagueness of the business related data.
1.3 Predicting Disease Risk
A method is presented which utilizes healthcare cost and utilization project dataset for predicting disease risk of
individuals based on their medical diagnosis history. Data taken from National Inpatient Sample (NIS) data,
which is publicly available was used to train the random forest classifiers for disease prediction. Since the data
was highly imbalanced, an ensemble learning approach based on repeated random sub-sampling was
implemented. This technique divides the training data into multiple sub-samples, while ensuring that each sub-
sample is fully balanced. The performance of support vector machine(SHM), bagging and RF to predict the risk
of various chronic disease is discussed.
II. USE OF RANDOM FOREST IN EDUCATION
Universities now a days have become increasingly free the students in the university now have more choices of
courses and increased number of subjects required for each courses, but this has also increased the complexity
for the colleges to keep a check on the performance of the students. Where in earlier days this work could be
done by simple sorting now with increased number of factors affecting the performance of the student it is
difficult to judge accurately how a student will perform with simple methods. So the use of RF has been
suggested to deal with the complexities and accurately keep a check on their performance and help the students
who are thought to be lagging behind. Approach used for educational data classification in an academic credit
283 |
P a g e
with a hybrid scheme of oversampling and under sampling, and 3) classifier building process with randomforest.
Fig.1 The Proposed Approach For Imbalanced Educational Data Classification
Step 1. Data preprocessing -: this step is responsible for missing grade handling and data transformation.
Missing grades are replaced with zeroes for the lowest level of knowledge a student has obtained. The reason for
such missing data handling is that we doubt about the effect of incomplete subjects on the final status that a
student might get at the end of the standard period of time if effect may prevent him from completing the course
on time we take special care of that student as early as possible so that he can pass the examination on time.
Step 2 rebalancing with a hybrid scheme of oversampling and undersampling -: imbalanced data classification is
performed using cost effective learning methods. If the oversampling is performed then the cost will exceed
what it is expected and if undersampling is performed then there would be small data sets that will make our
data ineffective.
Step 3.classifier building process with random forest-: it is the characterstic of educational data set to have
different courses for different students and the position of missing subject also varies so this complexity can
only be handeled by the random forest.
2.1 Case study 1
Vo thi ngoc chau[1] performed an experiment on 361 students in 2005, 342 students in 2006, 319 students in
2007, and 312 students in 2008. Total number of students was 1334. Also data set was prepared for year 2 to 5
year courses. The data was not performed for 1st year students because there was not enough information to
predict their final year result. The result of the students was predicted using random forest method and
accordingly more emphasis was given on the students who were more likely to fail in their exam on the basis of
the information available thus there was a considerable improvement in the performance of the students in the
successive years.
III. PREDICTION OF FINANCIAL CRISIS IN THE MARKET
The exact prediction of financial crisis is an essential research task for decision makers. In recent years many
simple data mining techniques have been used to make the prediction about the market but with globalization
and opening of markets there has been a considerable increase in the factors which effect them. Therefore these
simple data mining techniques are no longer enough to accurately predict the markets. So for accurately
3.1 Working of Random Forest for Market Monitoring
Random forest is one of the ensemble learning technique which is suitable for handling complexity that occur
while monitoring the conditions that are encountered in the business decision making. Different attributes that
effect the decision of the managers are divided into sub trees and these subtrees are joined together to form a
random forest which has given the best result compared with other algorithm that have been applied on them.
In modern construction process this technique generates various cart like tree, each trained on a bootstrapped
sample of the original training data, and searches only across a randomly selected subset of the input variable to
determine a split. For classification task each tree in RF casts a unit vote for the most popular class at input x.
the final output of the classifier is determined by majority vote of trees. The number of parameter is a user
defined variable but is not sensitive to it. Normally the value is set to square root of the number of inputs.
Eventually the trees in RF are not pruned, further decreasing the computational complexity
3.2 Rough Set Theory (RST)
Rough set theory is an emerging mathematical tool that can be utilized to tackle uncertainity and vagueness. It
focuses on the discovery of patters in inconsistent data structures and can be employed on this basis to perform
formal reasoning under uncertainity, machine learning and knowledge discovery. This method has its specific
merits compared to other machine learning process. RST does not require any pre-defined or additional
information about the empirical training data, such as probability distribution in statistics or grades of
membership in set theory. And RST can generate knowledge in logic statements and express comprehensive
rules in If(condition) then(decision) format.
These two methods were used to perform the experiment mentioned below
3.3 Case Study 2
Mushang Lee [2] performed the experiment on the Taiwan stock exchange and the database of the Taiwan
Economic Journal, Taiwan experienced financial distress from 2007 to 2010. The financial distress criteria for
sampling required a firm to announce that stocks needed to be “traded” or “terminated”. The companies were
characterized under 1) having a credit crisis 2)having a net operating loss, 3) failing to pay debts, 4) violating
regulations. The size of matched sample was 194 firms, including 97 in financial distress and 97 finantially
sound corporations. In this study then applied feature selection method was used, called RF method to identify
the informative features and then was fed into the RST model to construct an emerging pre-warning system. The
outcome of the above study was that a pre warning model or system was developed by the combination of RF
and RST which was useful in accurately making decisions pertaining the risks involved in the market. And
rather then giving complicated mathematical mathematical equations the model presents a comprehensible
decision rules for decision mkers to make reliable judgements.
IV. PREDICTING DISEASE RISKS FROM HIGHLY IMBALANCED DATA
A large amount of data is available from the doctors and hospitals about the patients who have come to the
hospital or shown sine of a disease or are susceptible to certain disease may be because of living conditions,
family history or past experiences etc. people are recomende to get regular chackups and the information about
285 |
P a g e
care quality(AHRQ ) and US department of health and human sources. Thus the disease predictability is appliedto the data to give a prediction about the disease from which people with different features may suffer.
4.1 Using the Random Forest
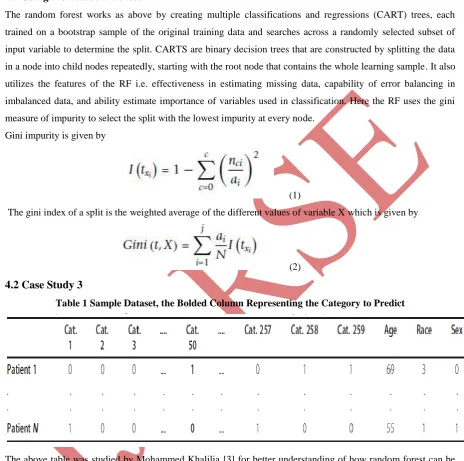
The random forest works as above by creating multiple classifications and regressions (CART) trees, each
trained on a bootstrap sample of the original training data and searches across a randomly selected subset of
input variable to determine the split. CARTS are binary decision trees that are constructed by splitting the data
in a node into child nodes repeatedly, starting with the root node that contains the whole learning sample. It also
utilizes the features of the RF i.e. effectiveness in estimating missing data, capability of error balancing in
imbalanced data, and ability estimate importance of variables used in classification. Here the RF uses the gini
measure of impurity to select the split with the lowest impurity at every node.
Gini impurity is given by
(1)
The gini index of a split is the weighted average of the different values of variable X which is given by
(2)
4.2 Case Study 3
Table 1 Sample Dataset, the Bolded Column Representing the Category to Predict
The above table was studied by Mohammed Khalilia [3] for better understanding of how random forest can be
used for prediction of disease. In this for every record we extract the age, race and sex and 15 diagnosis
categories. Every record is represented as a d=262 dimensional feature vector. Features 1-259 are binary, one for
each disease category. The remaining three features are age, race and sex. We denote the samples that contain a
given disease category as “active” and the remaining ones as “inactive”. The active and inactive data samples
are defined only from the point of view of the disease being classified. For example in table 1, sample 1 is active
for disease category 50, while sample N is inactive. Thus the above data is analyzed using the random forest and
the result gives the most accurate possible prediction of diseases thus increasing the chances of early detection
of diseases. This study was specially done for the detection of following categories: breast cancer, type 1
diabetes, type 2 diabetes, hypertension, coronary arthrosclerosis, peripheral atherosclerosis, other circulatory
V. CONCLUSION
The random forest technique is a reliable data mining technique which utilizes the ability of machine learning.
As introduced in the cases above the technique can also be used in other fields as follows
5.1 In Mining of Minerals
The random forest technique can give us the idea of which mineral is present in which part of land and in what
amount this will be helpful in saving both time and money of the organization in testing etc as the results of
random forest are found to be satisfactory.
5.2 Astronomical Researches
The technique can be used to determine the type and amount of various elements that may be present on a
planet, comet or any other celestial body just by feeding the analyzed information and feeding the data about the
celestial body which is supposed to be studied.
5.3 Providing High Paid Jobs
This technique can be used to provide high paid jobs to the people who deserve it. The past data about what type
of people became successful in what kind of job can be provided to the random forest which can give useful
predictions on whether a person will be successful in particular kind of job.
5.4 Controlling and Monitoring Population of Animals Both In Land and In Water
The population of the land and ocean animals can be monitored by inputting the conditions in which various
animals have thrived and the condition which is harmful for certain breeds of animals. This prediction can help
us in monitoring the conditions which has lead to poor population of various animals. Apart from these the
random forest technique can be used in various other fields which require accurate data mining and accurate
prediction of best possible course of action.
REFERENCES
[1] Vo Thi Ngoc Chau, Nguyen Hua Phung, Imbalanced educational data classification: an effective approach
with resampling and random forest, IEEE RIVF international conference on computing and technologies-
research innovation, and vision for the future (RIVF).
[2] Mushang Lee, Ching-Hui Shih, Tsui chih Wu, the emerging financial pre-warning systems, sixth
international conference on innovative mobile and interne services in Ubiquitous Computing.
[3] Mohammed Khalilia, Sounak Chakraborty, Mihail Popescu, predicting disease risks from highly
imbalanced data using random forest, BMC Medical Informatics & decision making.
[4] Wikipedia, introduction to random forest.
[5] The Internet, working of random forest