OncoTargets and Therapy
Comparison of imaging-based gross tumor
volume and pathological volume determined
by whole-mount serial sections in primary
cervical cancer
Ying Zhang1,* Jing Hu1,* Jianping Li1
Ning Wang1
Weiwei Li1
Yongchun Zhou1
Junyue Liu1
Lichun Wei1
Mei Shi1
Shengjun Wang2
Jing Wang2
Xia Li3
Wanling Ma4
1Department of Radiation Oncology, 2Department of Nuclear Medicine, 3Department of Pathology, 4Department of Radiology,
Xijing Hospital, Xi’an, People’s Republic of China
*These authors contributed equally to this work
Correspondence: Mei Shi; Lichun Wei Department of Radiation Oncology, Xijing Hospital, Fourth Military Medical University, 17 Changle Western Road, Xi’an 710032, People’s Republic of China Tel +86 29 8477 5425
Fax +86 29 8477 5425 Email [email protected]; [email protected]
Objective: To investigate the accuracy of imaging-based gross tumor volume (GTV) compared with pathological volume in cervical cancer.
Methods: Ten patients with International Federation of Gynecology and Obstetrics stage I–II cervical cancer were eligible for investigation and underwent surgery in this study. Magnetic resonance imaging (MRI) and fluorine-18 fluorodeoxyglucose positron emission tomography (18F-FDG PET)/computed tomography (CT) scans were taken the day before surgery. The
GTVs under MRI and 18F-FDG PET/CT (GTV-MRI, GTV-PET, GTV-CT) were calculated
automatically by Eclipse treatment-planning systems. Specimens of excised uterine cervix and cervical cancer were consecutively sliced and divided into whole-mount serial sections. The tumor border of hematoxylin and eosin-stained sections was outlined under a microscope by an experienced pathologist. GTV through pathological image (GTV-path) was calculated with Adobe Photoshop.
Results: The GTVs (average ± standard deviation) delineated and calculated under CT, MRI, PET, and histopathological sections were 19.41 ± 11.96 cm3, 12.66 ± 10.53 cm3,
11.07 ± 9.44 cm3, and 10.79 ± 8.71 cm3, respectively. The volume of GTV-CT or GTV-MR was
bigger than GTV-path, and the difference was statistically significant (P , 0.05). No significant difference was observed between GTV-PET and GTV-path (P . 0.05). Spearman correlation analysis showed that GTV-CT, GTV-MRI, and GTV-PET were significantly correlated with GTV-path (P , 0.01). There was no significant difference in the lesion coverage factor among the three modalities.
Conclusion: The present study showed that GTV defined under 40% of maximum standardized uptake value in PET images was very similar to the pathological volume of cervical cancer. This result should be replicated in a larger number of patients with cervical cancer in a future study of ours.
Keywords: MRI, 18F-FDG PET/CT, pathological tumor volume, gross tumor volume, cervical
cancer
Introduction
In modern radiation oncology, treatment techniques have been improved from a two-dimensional to a three-dimensional approach, which requires the use of vari-ous imaging modalities to adequately identify and delineate tumor structures. The gross tumor volume (GTV) is the target volume to be irradiated and covered by the radical dose level. Accurate delineation of target volumes is essential for optimal
Dove
press
O R i g i N A L R E S E A R C H
open access to scientific and medical research
Open Access Full Text Article
OncoTargets and Therapy downloaded from https://www.dovepress.com/ by 118.70.13.36 on 26-Aug-2020
For personal use only.
Number of times this article has been viewed
This article was published in the following Dove Press journal: OncoTargets and Therapy
radiation treatment to get high-dose coverage for the tumor and maintain an acceptable dose to adjacent organs at risk. Computed tomography (CT) and magnetic resonance imag-ing (MRI) are widely available and have become the refer-ence imaging modality for treatment planning. They have the significant advantage of showing the anatomy in high resolution, also called anatomical imaging.
In recent years, biological imaging methods visualizing metabolic characteristics have been developed. Fluorine-18
fluorodeoxyglucose positron emission tomography (18F-FDG
PET) is one of the most used methods, especially combined
with anatomic imaging, such as CT (18F-FDG PET/CT), which
gives information on molecular and morphologic character-istics, and potentially provides the most accurate information
for staging of many malignancies.1 18F-FDG PET/CT has been
widely used in tumor diagnosis, staging, showing lymph-node metastasis, and radiotherapy.2–4 The accuracy of 18F-FDG PET/
CT in the diagnosis of gynecologic cancer (including cervical
cancer) is higher than conventional imaging.3 Recently, PET/
CT has also shown a positive value in the detection and radio-therapy of recurrent cancer. GTV delineation in 56% of cases was significantly changed when information from metabolic
imaging was used in the treatment-planning process.5
GTV confirmed by histopathological specimen should be the basis by which to identify the target of radiotherapy in different imaging methods. There is not much evidence about the best image modality to delineate targets of radiotherapy. The aim of the present study was to test the value of the images in delineating GTV of cervical cancer through comparing GTV from CT, MRI, and FDG PET with GTV calculated by histopathological specimen.
Materials and methods
Patients
From March 2010 to November 2010, ten patients with his-tologically proven cervical cancer at Xijing Hospital were enrolled in this study. All patients accepted preoperative imaging examination and underwent radical hysterectomy
and pelvic lymphadenectomy. MRI and 18F-FDG PET/CT
scans were done the day before surgery. The eligibility crite-ria were patients with International Federation of Gynecology and Obstetrics stage I–II, without diabetes, and no cancer-related treatment previously.
image acquisition
High-resolution MRI and 18F-FDG PET/CT examinations
were performed the day before surgery in Xijing Hospital. All patients agreed to participate in this study. The protocol
was approved by the hospital’s Protection of Human Subjects Committee (Xijing Hospital, Fourth Military Medical University, Clinical Ethics Committee).
Magnetic resonance imaging
The MR images were acquired with a 3-T MR scanner (Tim Trio; Siemens, Erlangen, Germany). The patients were asked to empty their intestines before the MRI scan and were scanned in a supine position. The high-resolution anatomic MR images were acquired by using a 3-D fast field-echo sequence with the
following parameters: matrix size of 512 × 512, field of view
of 20 × 20 cm2 and slice thickness of 4 mm, no gap between
slices. The repetition time/echo time was 10,050 ms/95 ms for
axial turbo spin-echo T1-weighted and 6000 ms/102 ms for
axial, coronal, sagittal turbo spin-echo T2-weighted images.
Fluorodeoxyglucose positron emission tomography/computed tomography
18F-FDG PET/CT scans were performed using a hybrid
PET System (Biograph 40; Siemens, Malvern, PA, USA). All patients were asked to fast for at least 6 hours before the examination and normal blood glucose level was tested before tracer injection. After intravenous injection
of 5.55–7.40 MBq/kg of 18F-FDG, emission images were
acquired. High-quality CT images were provided, with a slice thickness of 3 mm, a 50 cm displayed field of view, and a rota-tional speed of 0.75 seconds per rotation. The patients were in a supine position and scanned from L3 to ischial tuberosity.
gross tumor volume
To avoid bias, two experienced radiation oncologists and one radiologist took part in the GTV delineation of all patients. Acquired images of MRI and PET/ CT for each patient were transferred to Eclipse treatment-planning systems, version 8 (Varian Medical Systems, Palo Alto, CA, USA), and the GTVs were calculated automatically after the tumor border outlined on each floor of MR and PET/CT images.
MRI-based GTV (GTV-MRI) was determined from T2-weighted
images, and T1-weighted images were used as reference. The
GTV on the PET images (GTV-PET) was shown by using an isointensity line based upon 40% of the maximum
standard-ized uptake value, based on a previous study.6 The GTV on
CT image (GTV-CT) was outlined on 400 HU window width and 60 HU window level.
Pathology procedure
All the patients underwent radical hysterectomy and pelvic lymphadenectomy the next day after MRI and PET/CT Dovepress
Zhang et al
OncoTargets and Therapy downloaded from https://www.dovepress.com/ by 118.70.13.36 on 26-Aug-2020
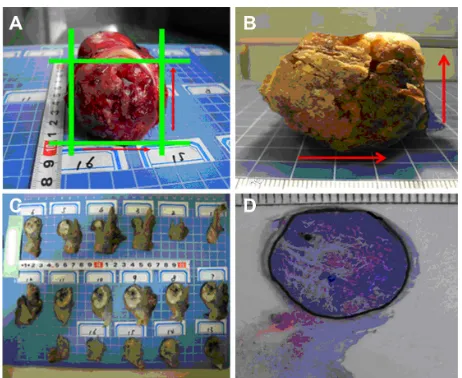
image examinations. Once the fresh specimen was collected after the operation, the maximum tumor diameters vertically and horizontally were documented by digital photography with a ruler (Figure 1A). The specimens were subsequently fixed in 10% formalin for at least 24 hours. The dimensions of the fixed tumor samples were also documented in the same way to determine the volume reduction due to fixation (Figure 1B). Then the fixed tumor specimens were sliced into consecutive tissue sections with intervals of 4 mm, so-called thick slices (Figure 1C). Each thick slice was numbered and photographed using a digital camera. After conventional pathological pro-cessing, the 4 mm-thick slices were embedded in paraffin and
sliced into 4 µm sections on a microtome (Microm HM 450;
GMI, Ramsey, MN, USA) and stained with hematoxylin and eosin (Figure 1D). The tumor-containing area on the 4 µm hematoxylin and eosin-stained section was outlined under light microscopy at 20× magnification, reviewed and
con-firmed at 100× magnification by an experienced pathologist.
The outlined section was then photographed and saved. With Photoshop 7.01 (Adobe Systems, San Jose, CA, USA), the tumor-containing area (Ai) for each slide was measured, and the GTV on pathology (GTV-path) for each specimen was
calculated as GTV-path = Σi Ai/R, where R was defined as
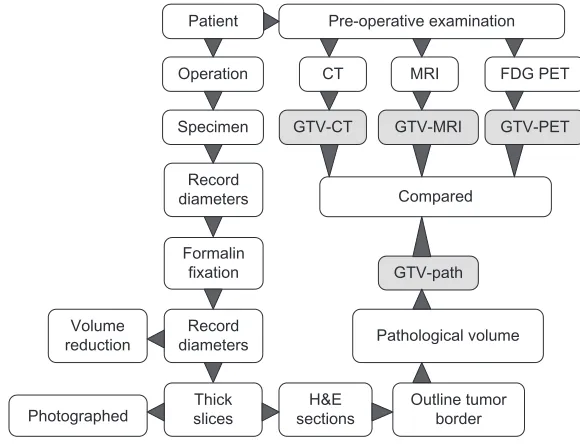
the ratio of the sample dimensions before and after fixation, respectively. The workflow of the processes to acquire all the imaging is briefly schematized in Figure 2.
Volume analysis
Data of the different volumes – GTV-CT, GTV-MRI, GTV-PET,
and GTV-path – were expressed as means ± standard deviation.
The differences between GTV-CT, GTV-MRI, and GTV-PET with GTV-path were analyzed using paired t-test with SPSS software (version 15.0; IBM, Armonk, NY, USA). The cor-relation between different imaging volumes and pathological volume were also analyzed by the Spearman correlation test.
A P-value of ,0.05 was considered statistically significant.
The conformity index (CI) and lesion-coverage factor (LCF) were used to compare the correspondence among GTV-CT,
GTV-MRI, and GTV-PET.7 The CI means the relative
con-cordance between the two different modalities, which was defined as GTV-A/GTV-B. The LCF means the percentage of overlap between the two different modalities, which was defined as overlap between GTV-A and GTV-B divided by GTV-A.
Results
Patient characteristics
All ten patients were from northwest China, confirmed with squamous cell carcinoma after operation, and had no lymph-node metastasis or obviously parametrical violation. The median age of the patients was 40 years (range 32–55 years). Clinical stages (International Federation of Gynecology and Obstetrics) were two IB, three IIA, and five IIB. On FDG PET images, significantly abnormal radioactive uptake in tumor
(standardized uptake value .2.5) was found on all patients. No
patient showed abnormal lymph nodes in the pelvic cavity.
gross tumor volume
GTV-path was indicated with a reduction to 85% ± 10% of
the original tumor volumes (range 65%–97%) by comparing the tumor samples before (Figure 1A) and after (Figure 1B) formalin fixation (Table 1). There was no further volume shrinkage and changes in tissue shape during subsequent pathological procedures.
The tumor volumes of each case are shown in Table 1. The averages of GTV-CT, GTV-MRI, and GTV-PET were 19.41 ± 11.96 cm3, 12.66 ± 10.53 cm3, and 11.07 ± 9.44 cm3,
respectively. The actual pathological volume of tumors was
10.79 ± 8.71 cm3 on average. One case example of CT, MRI,
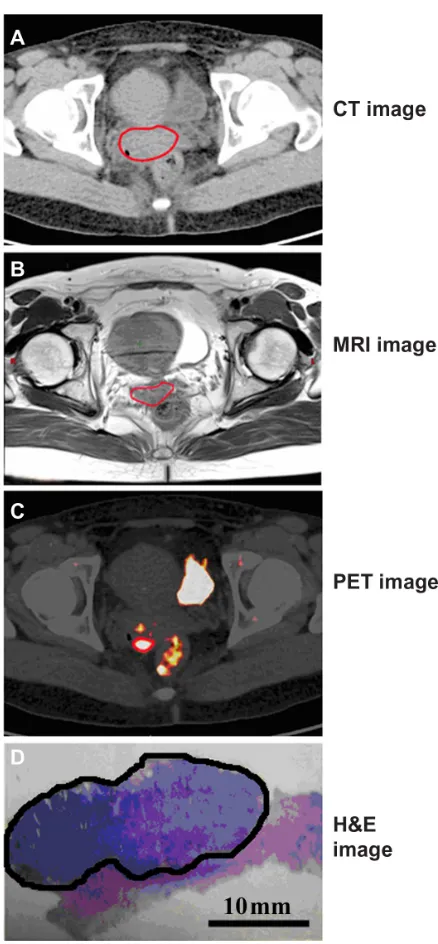
FDG PET imaging, and surgical pathological specimen is representatively shown in Figure 3.
Paired t-test results showed that the differences between GTV-CT, GTV-MRI, and GTV-path were statistically
signifi-cant (P = 0.001, P = 0.019). GTV-CT and GTV-MRI were
both bigger than GTV-path, but GTV-MRI was much closer to the actual pathologic volume. GTV-MRI was larger than GTV-path by approximately 17.3%, and GTV-CT was larger than GTV-path by close to two times.
Figure 1 (A–D) Pathology procedure. The specimens are collected from surgery (A) and fixed in 10% formalin (B). The fixed specimens are sliced in 4 mm-thick consecutive transverse slices (C). Each slice is embedded in paraffin, sectioned, and processed for hematoxylin and eosin staining (D).
Dovepress Accurate target definition of cervical cancer
OncoTargets and Therapy downloaded from https://www.dovepress.com/ by 118.70.13.36 on 26-Aug-2020
There was no statistical difference between GTV-PET
and GTV-path (P = 0.512), even though the GTV-PET was
bigger than the actual pathologic volume. Furthermore, com-paring the GTV-MRI and GTV-PET, a significant difference
(P = 0.048) was observed. GTV-PET was much smaller than
GTV-MR and closer to GTV-path.
Spearman correlation analysis
Spearman correlation analysis showed that CT, GTV-MRI, and GTV-PET were significantly correlated with
GTV-path (r = 0.8545, P = 0.0029; r = 0.9879, P , 0.0001;
r = 0.9879, P , 0.0001; Figure 4A–C).
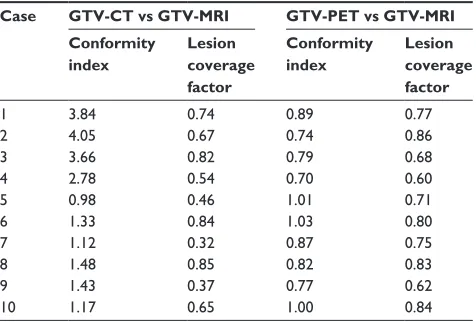
GTV-MRI was used as a reference in the CI and LCF vol-ume relative concordance analysis, because GTV-MRI is most widely used in brachytherapy planning of cervical cancer. The CI and LCF for comparisons between GTV-CT, GTV-PET, and GTV-MRI are shown in Table 2. The average CI and
LCF for GTV-CT versus GTV-MRI were 2.18 ± 1.25 and
0.63 ± 0.20, and the average CI and LCF for GTV-PET versus
GTV-MRI were 0.86 ± 0.12 and 0.75 ± 0.09, respectively.
Photographed slicesThick sectionsH&E Outline tumorborder Pathological volume
GTV-path Formalin
fixation Record diameters Specimen Operation
Patient Pre-operative examination
CT MRI FDG PET
GTV-CT GTV-MRI GTV-PET
Compared
Record diameters Volume
reduction
Figure 2 Workflow of image acquisition and pathological procedure.
Abbreviations: CT,computed tomography; MRI, magnetic resonance imaging; FDG-PET, fluorodeoxyglucose positron emission tomography; GTV-path, gross tumor volume through pathological image; H&E, hematoxylin and eosin.
Table 1 Summary on gTVs in patients with cervical cancer for each case
Case Volume retraction (%)
GTV-path (cm3)
Actual GTV-path (cm3)*
GTV imaging (cm3)
CT MRI PET
1 88 1.04 1.18 5.76 1.5 1.34
2 95 1.76 1.85 10.94 2.7 2.01
3 78 3.64 4.67 18.13 4.95 3.92
4 97 4.34 4.47 15.92 5.72 3.98
5 65 4.89 7.52 7.64 7.81 7.89
6 72 6.80 9.44 12.35 9.28 9.59
7 86 12.13 14.10 18.47 16.4 14.25
8 87 13.42 15.43 27.89 18.84 15.39
9 90 20.84 23.15 42.04 29.32 22.46
10 92 24.04 26.13 34.99 30.03 29.88
Mean 10.79 19.41 12.66 11.07
SD 8.71 11.96 10.53 9.44
P value vs gTV-path
0.001 0.019 0.512
Note: *Actual gTV-path calculated as gTV-path divided by the volume-retraction ratio.
Abbreviations: gTV-path, gross tumor volume through pathological image; CT, computed tomography; MRi, magnetic resonance imaging; PET, positron emission tomography; SD, standard deviation.
Dovepress
Zhang et al
OncoTargets and Therapy downloaded from https://www.dovepress.com/ by 118.70.13.36 on 26-Aug-2020
According to the differential prognosis described in
previ-ous research,8 tumor size was divided into a ,14 cm3 group
and a .14 cm3 group based on MRI to be further analyzed. For
GTV-CT and GTV-MRI, when the ,14 cm3 group (average
GTV-MRI 5.33 ± 2.95 cm3), the CI was 2.77 ± 1.33 and LCF
was 0.68 ± 0.15, while the CI fell to 1.30 ± 1.33 and LCF to
0.55 ± 0.25 in the .14 cm3 group. The result of t-tests showed a
significant deference for CI (P = 0.0.0027); there was no
signifi-cant deference for LCF (P = 0.45). between the two cohorts.
For GTV-PET and GTV-MRI, a mean CI of 0.86 ± 0.14
and LCF of 0.74 ± 0.09 was found in the ,14 cm3 group,
while a mean CI of 0.0.87 ± 0.10 and LCF of 0.76 ± 0.10 was
found in the .14 cm3 group. The CI and LCF differences
between cohorts were not statistically significant (P = 0.34
and 0.67, respectively).
Discussion
Image-guided radiotherapy requires adequate knowledge of tumor extent so it can deliver a high and accurate radiation
dose to the targets.9 CT and MRI are widely used in GTV
delineation for tumor radiation-therapy treatment planning to improve the accuracy of radiotherapy.
A number of publications from the American College of Radiology Imaging Network and the Gynecologic Oncology
Group have demonstrated that traditional T1/T2-weighted
MRI is superior to CT for tumor delineation in cervical can-cer, due to its high soft-tissue contrast for the evaluation of
local tumor extension.10 In stage IIB cervical cancer, MRI had
91% diagnostic accuracy, 67% sensitivity, and 92% specific-ity in assessing infiltration of the vaginal fornices, and 89% diagnostic accuracy, 28% sensitivity, and 100% specificity in the assessment of the lymph nodes, with a cutoff value
of 1 cm.11 However, both CT and MRI cannot show the
pri-mary tumor’s metabolic characteristics, while FDG PET can provide information concerning the metabolic activity of a tissue region. Clinical results show that FDG PET seems to be particularly valuable in target-volume definition and lymph-node status definition for lung, head-and-neck, genitourinary,
Figure 3 (A–D) One representative case (case 4) on CT image, MRi, PET image, and H&E image of surgical pathological specimen of cervical cancer. The tumor border is delineated by the red lines on CT (A), MRi (B), and PET (C), and by the black line on whole-mount section of tumor (D).
Abbreviations: CT, computed tomography; MRi, magnetic resonance imaging; PET, positron emission tomography; H&E, hematoxylin and eosin.
0 0 10 20 30 40 50
A
10
Pathological volume (cm3)
CT volume (cm
3)
20 30 00 10 20 30
B
10
Pathological volume (cm3) Pathological volume (cm3)
MRI volume (cm
3)
20 30 00 10 20 30
C
10
PET volume (cm
3)
20 30
Observed Linear
Figure 4 (A–C) Correlation of the different gross tumor volumes among imaging modalities and the surgical specimen. (A) CT; (B) MRi; (C) PET.
Abbreviations: CT, computed tomography; MRi, magnetic resonance imaging; PET, positron emission tomography.
Dovepress Accurate target definition of cervical cancer
OncoTargets and Therapy downloaded from https://www.dovepress.com/ by 118.70.13.36 on 26-Aug-2020
and brain tumors and cervical cancer. Prior publications have highlighted the utility of FDG PET/CT simulation in defining
nodal target areas and assessing posttreatment response.12 It
may become possible to improve tumor delineation further by depiction of the metabolic activity of the tumor.
However, neither CT and MRI can show the primary tumor’s metabolic characteristics, while FDG PET can pro-vide information concerning the metabolic activity of a tissue region. Clinical studies’ results of the integration of PET in target-volume definition for lung, head-and-neck, genitouri-nary, and brain tumors were analyzed, and FDG PET seems to be particularly valuable in lymph-node status definition in cervical cancer. The authors proposed that PET showed advantages in terms of tumor delineation and the description of biological processes when doing treatment planning in
radiotherapy.12 It can be assumed that with depiction of the
metabolic activity of the tumor, further improvement in tumor delineation may become possible. Prior publications have highlighted the utility of FDG PET/CT simulation in defining
nodal target areas and assessing posttreatment response.12
It is generally accepted that the volume of surgical speci-mens is the gold standard for target-delineating studies. The whole-mount serial section technique was used in 3-D volu-metric reconstruction in malignant tumors, including breast
cancer, lung cancer, and laryngeal cancer.13–15 Whole-mount
serial section could offer advantages in correct documenta-tion of tumor size, lesion distribudocumenta-tion, disease extent, and surgical margins, and facilitate better understanding of the complex morphology of tumors. Large histopathology slides are optimal tools for confirming the correlations between radiology and pathology. In this study, we first used the whole-mount serial sections technique to reconstruct the cervical cancer pathological volume.
Recently, different imaging modalities have been introduced to delineate and calculate GTV for cervical cancer. Dahele et al compared the discrepancies of tumor volume between FDG PET and MRI for cervical cancer. They found that MRI provided better visualization of larger tumors than smaller tumors in reference to FDG PET/CT. Also, FDG PET/CT visualized tumor volumes differently
from T2-weighted MRI, especially in tumors ,14 cc.15
In the present study, we demonstrated the feasibility of pathology-validated target definition for cervical cancer. The results from the ten patients indicated that current target volumes based on CT, MRI, and PET data overestimate the real tumor volume. We found that GTV-CT and GTV-MRI overestimated GTV-PET volume in all ten patients, which
is in agreement with the results from Dahele et al’s study.15
A major difference between our outcomes and those of Dahele et al’s study is that we were able to compare pathological volumes by 3-D reconstruction rather than areas or maximal tumor diameters. By comparing with GTV-path, we found that PET-based GTVs were the most accurate method in the three imaging modalities for radiation-treatment planning. The other difference was that there was no significant difference between FDG PET visualized tumor volumes from MRI in our
study, whenever the tumor volume was ,14 cm3 or .14 cm3.
Similar to Dahele et al’s study, no significant difference in CI was observed in the two different tumor-volume subgroups. However, Dahele et al found that differences in LCF of tumor
volume were statistically significant (P , 0001) between FDG
PET and MRI, especially for tumors ,14 cm3, which meant
that the tumor location was varying particularly for small tumor volumes. No significant difference in CI or LCF between FDG PET and MRI was shown in our research. A high level of LCF represented a high degree of overlap between the GTV-FDG PET and GTV-MRI despite the small tumor volume.
There are few studies on the comparison tumor volumes from different imaging modalities with those of surgical specimens. For oropharyngeal tumors, laryngeal, or hypopha-ryngeal tumors, Daisne et al found that the average GTVs delin-eated by CT or MRI showed no significant difference, whereas GTVs determined by FDG PET most accurately matched the pathologic volumes by 3-D reconstruction in pharyngolaryngeal squamous cell tumors. However, no approach could adequately depict superficial tumor extension, due to the lower spatial reso-lution when the surgical specimen was available.16,17
A major finding of our study is that the GTVs delineated by FDG PET were closest to the reference volume assessed from the surgical specimens, which could have tremendous implications for radiation-therapy treatment planning in
Table 2 Relative concordance among gTV-CT, -MRi, and -PET
Case GTV-CT vs GTV-MRI GTV-PET vs GTV-MRI Conformity
index
Lesion coverage factor
Conformity index
Lesion coverage factor
1 3.84 0.74 0.89 0.77
2 4.05 0.67 0.74 0.86
3 3.66 0.82 0.79 0.68
4 2.78 0.54 0.70 0.60
5 0.98 0.46 1.01 0.71
6 1.33 0.84 1.03 0.80
7 1.12 0.32 0.87 0.75
8 1.48 0.85 0.82 0.83
9 1.43 0.37 0.77 0.62
10 1.17 0.65 1.00 0.84
Abbreviations: gTV, gross tumor volume; CT, computed tomography; MRi, magnetic resonance imaging; PET, positron emission tomography.
Dovepress
Zhang et al
OncoTargets and Therapy downloaded from https://www.dovepress.com/ by 118.70.13.36 on 26-Aug-2020
OncoTargets and Therapy
Publish your work in this journal
Submit your manuscript here: http://www.dovepress.com/oncotargets-and-therapy-journal OncoTargets and Therapy is an international, peer-reviewed, open access journal focusing on the pathological basis of all cancers, potential targets for therapy and treatment protocols employed to improve the management of cancer patients. The journal also focuses on the impact of management programs and new therapeutic agents and protocols on
patient perspectives such as quality of life, adherence and satisfaction. The manuscript management system is completely online and includes a very quick and fair peer-review system, which is all easy to use. Visit http://www.dovepress.com/testimonials.php to read real quotes from published authors.
patients with cervical squamous cell carcinoma. In addition, compared to the actual volume of the tumor, the CT-derived tumor volumes had a bigger deviation than those from MRI or FDG PET. However, the delineated tumor volumes had a relatively good degree of overlap among the three modalities. The higher deviation of CT-derived tumors would be related to the CT scan without contrast. GTV-CT would include some normal tissue of the cervix.
To the best of our knowledge, the present study is the only research on comparing volume from different imaging modali-ties with that of the corresponding surgical specimens in cervi-cal cancer. The limitations of the study were the small number of cases and singleness of pathological kind. In future, more patients with other histopathological types will be enrolled to verify the results of the study. Another limitation was the failure to overlap the volumes from imaging and pathology stereotactically, because of the lack of reliable markers in pathological sections. Although there were a few limitations, certain insights have been derived in the delineation of target volumes using PET/CT images for radiation therapy.
Conclusion
In conclusion, the present study has demonstrated a potential role of FDG PET imaging for the delineation of GTV in squamous cell carcinoma of cervical cancer. Research in a larger number of patients with cervical cancer will need to be performed to prove the relationship between GTV-PET and GTV-path in the near future.
Acknowledgments
The study was supported by grants from the National High Technology Research and Development Program (2007AA02Z437) and the National Nature Science Foundation of China (30970862, 81272346). The authors thank Professor Zhe Wang and Yi Huan of Xijing Hospital, and Professor Jinming Yu and Dianbin Mu of Shandong Cancer Hospital and Institute for their valuable support in this study.
Disclosure
The authors report no conflicts of interest in this work.
References
1. Chiti A, Kirienko M, Grégoire V. Clinical use of PET-CT data for radiotherapy planning: what are we looking for? Radiother Oncol. 2010;96(3):277–279.
2. Kim EE. Whole-body positron emission tomography and positron emission tomography/computed tomography in gynecologic oncology. Int J Gynecol Cancer. 2004;14(1):12–22.
3. Grisaru D, Almog B, Levine C, et al. The diagnostic accuracy of 18F-fluorodeoxyglucose PET/CT in patients with gynecological malignancies. Gynecol Oncol. 2004;94(3):680–684.
4. Chung HH, Jo H, Kang WJ, et al. Clinical impact of integrated PET/CT on the management of suspected cervical cancer recurrence. Gynecol Oncol. 2007;104(3):529–534.
5. Ciernik IF, Dizendorf E, Baumert BG, et al. Radiation treatment planning with an integrated positron emission and computer tomography (PET/CT): a feasibility study. Int J Radiat Oncol Biol Phys. 2003;57(3):853–863. 6. Miller TR, Grigsby PW. Measurement of tumor volume by PET to
evaluate prognosis in patients with advanced cervical cancer treated by radiation therapy. Int J Radiat Oncol Biol Phys. 2002;53(2):353–359. 7. Feuvret L, Noel G, Mazeron JJ, Bey P. Conformity index: a review.
Int J Radiat Oncol Biol Phys. 2006;64(2):333–342.
8. Narayan K, Fisher R, Bernshaw D. Significance of tumor volume and corpus uteri invasion in cervical cancer patients treated by radiotherapy. Int J Gynecol Cancer. 2006;16(2):623–630.
9. Ford EC, Herman J, Yorke E, Wahl RL. 18F-FDG PET/CT for image-guided and intensity-modulated radiotherapy. J Nucl Med. 2009;50(10): 1655–1665.
10. Mitchell DG, Snyder B, Coakley F, et al. Early invasive cervical cancer: tumor delineation by magnetic resonance imaging, computed tomography, and clinical examination, verified by pathologic results, in the ACRIN 6651/ GOG 183 Intergroup Study. J Clin Oncol. 2006;24(36):5687–5694. 11. Manfredi R, Gui B, Giovanzana A, et al. Localized cervical cancer
(stage ,IIB): accuracy of MR imaging in planning less extensive surgery. Radiol Med. 2009;114(6):960–975.
12. Dolezelová H, Slampa P. The impact of positron emission tomogra-phy in the radiotherapy treatment planning. Minireview. Neoplasma. 2007;54(2):95–100.
13. Clarke GM, Peressotti C, Mawdsley GE, Yaffe MJ. Design and char-acterization of a digital image acquisition system for whole-specimen breast histopathology. Phys Med Biol. 2006;51(20):5089–5103. 14. Clarke GM, Eidt S, Sun L, Mawdsley G, Zubovits JT, Yaffe MJ.
Whole-specimen histopathology: a method to produce whole-mount breast serial sections for 3-D digital histopathology imaging. Histopathology. 2007;50(2):232–242.
15. Dahele M, Hwang D, Peressotti C, et al. Developing a methodology for three-dimensional correlation of PET-CT images and whole-mount histopathology in non-small-cell lung cancer. Curr Oncol. 2008;15(5): 62–69.
16. Ma DJ, Zhu JM, Grigsby PW. Tumor volume discrepancies between FDG-PET and MRI for cervical cancer. Radiother Oncol. 2011;98(1): 139–142.
17. Daisne JF, Duprez T, Weynand B, et al. Tumor volume in pharyngo-laryngeal squamous cell carcinoma: comparison at CT, MR imaging, and FDG PET and validation with surgical specimen. Radiology. 2004;33(1):93–100.
Dovepress
Dove
press
Accurate target definition of cervical cancer
OncoTargets and Therapy downloaded from https://www.dovepress.com/ by 118.70.13.36 on 26-Aug-2020