THEORETICAL MODELING OF A METAL-CLAD PLA-NAR WAVEGUIDE BASED BIOSENSORS FOR THE DE-TECTION OF PSEUDOMONAS-LIKE BACTERIA
V. Singh and D. Kumar
Department of Physics Banaras Hindu University Varanasi, U. P., India
Abstract—In this paper, a metal-clad planar optical waveguide
biosensor with five layer structure is studied theoretically for the detection of Pseudomonas and Pseudomonas-like bacteria. Using a very simple boundary matching technique, we derive the mode equation and other necessary formulae for the proposed biosensor and analyse its performance under different conditions related to its constituents. The numerical results presented in this paper leads to a significant optimization of the important design parameters to sense micro-scale biological objects. Also, we compare our computed results with the results given for a biosensor with four layer structure. In addition, we discuss the importance and need of the inclusion of the thickness of an affinity layer as fifth layer in the four layer structure of the metal clad planar waveguide.
1. INTRODUCTION
A biosensor is a self contained integrated device which can provide specific and quantitative analytical information about the presence or the concentration of biological molecules, structures and microorganism ranging in size from nanometers to micrometers such as DNA, proteins, lipid bilayers, bacteria and whole cell behaviour. In a classic paper [1], Tiefenthaler and Lukosz introduced for the first time, a planar optical waveguide for sensing gas and humidity by measuring a change in the refractive index (RI) of the material contained in the cover of waveguide. Thereafter, tremendous advances in optical waveguide sensors have taken place for humidity sensing, heavy metal
ions sensing, chemical sensing, biochemical sensing and biosensing [2– 6]. The tremendous international interest in optical sensors can be seen from the very large number of research, technical and review articles published in several international journals of repute [7–9, 31– 33]. Optical fiber based biosensors have been the focus of a large volume of research in the past few years. Enzyme optical fiber based biosensors continue to be the most commonly reported type [10]. However, the number of publications on immunoassay, nucleic acid and whole cell optical fiber based biosensors has greatly increased [9– 11]. Presently Surface Plasmon Resonance (SPR) sensor technology has been commercialized, and SPR biosensors have become a central tool for characterizing and quantifying bimolecular interactions [12, 13]. The optical waveguide sensor is also known as evanescent wave sensor because of the evanescent wave entering into the cover medium whose RI is to be measured. But the probing depth of the evanescent field has an upper limit of 100–150 nm. Therefore, such sensors can only detect biological substances in the close vicinity to the sensor surface limited to below 200 nm. But for whole-cell behaviour and micron sized biological objects, the probing depth of the evanescent field must be increased. Recently Horwath et al. [14] have shown that probing depth can be increased much using reverse symmetry configuration for detecting whole-cell behaviour and micron sized biological objects.
no surface charge [26–30].
In the present investigation, we report a theoretical analysis of a metal-clad planar waveguide based biosensor having five layers for the detection of Pseudomonas and Pseudomonas-like bacteria. Here we propose to take 1 mm thick glass plate as a substrate [nS = 1.48534(FK51A)], a metal cladding of 30 nm silver (nM = 0.065 +i4.0) or gold (nM = 0.15 +i3.2), a 500 nm thick polystyrene (PS) film (nF = 1.59); the affinity layer is approximately 30–60 nm thick and coated with carbon source or hydrophobic plastic. The necessary formulas are derived and given in appendix to study the performance of proposed biosensor under different conditions related to its constituents. The numerical results presented in this article are compared with those of metal clad planar waveguide biosensor having four layers [16]. Comparison leads to a significant optimization of the important design properties to sense micron-scale biological objects like Pseudomonas and Pseudomonas-like bacteria.
The present study is organized in the following way. Section 2 is the modeling section where description of the modeling is given in brief and related equations which are given in appendix in detail. Section 3 is concerned with the application of our formulation for a new structure for some chosen parameters. Here we examine the sensing features and the different behaviours of our proposed structure theoretically. Finally, in Section 4, conclusions are presented and it has been emphasized that dip type silver metal clad planar waveguide biosensor is more preferable for microbial detection. In this section, we will present several numerical results to demonstrate the need of the inclusion of the thickness of an affinity layer as the fifth layer in the four layer structure of the metal clad planar waveguide [15, 16].
2. THEORETICAL MODELING
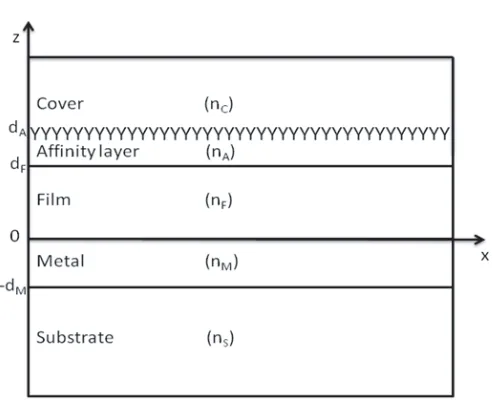
A schematic configuration of the proposed waveguide is shown in Fig. 1. It consists of five layers of a substrate (S), a metal (M), a film (F), an affinity layer (A) and a cover (C). A thin metallic layer with permittivity εM, permeability μM, and thickness dM is sandwiched between a semi-infinite substrate with permittivity εS, permeabilityμS, and a guiding layer with permittivityεF, permeability
Figure 1. Schematic diagram of a five-layer waveguide with their refractive indices.
we solve Maxwell’s equations for the five-layered structure and get the Helmholtz equations which are outlined in appendix in more details with their solutions.
Now applying the boundary conditions and considering that the fields and their first derivative should be continuous at the substrate-/metal, metal-film, film-affinity, affinity-cover media boundaries. As a result of this matching we get the following dispersion relation for the proposed five layered waveguide.
2πm= 2kFdF −φF, M, S−φF, A, C (1) where all the terms are defined in appendix.
Finally, by using some straightforward steps the reflectance of the proposed waveguide can be written as
R=|rS, M, F, A, C|2 =
rS,M+rM, F, A, C e2ikMdM 1 +rS, MrM, F, A, C e2ikMdM
2 (2)
all the terms are defined in appendix.
By matching the field at the boundaries we get a set of eight equations having eight unknown constants. These equations are written as
where Δ is 8×8 determinant having elements given in appendix.
ψ= (AC, AA, BA, AF, BF, AM, BM, BS);
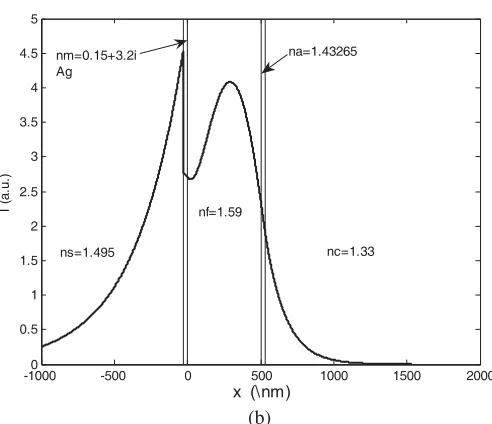
The modal profile of a waveguide mode for a proposed waveguide structure with a given width and the corresponding effective refractive index and calculated from Eq. (3) can now be calculated from Eq. (5) by assuming one of the field amplitude AF = 1. Moreover the sensitivity of the waveguide is the function of effective refractive indexN, affinity refractive indexnA, film refractive indexnF, affinity thicknessdA and film thickness dF.
S =S(N, nA, nF, dA, dF) (4) Hence affinity sensitivity with respect to affinity refractive index and affinity thickness are approximately defined as
dN dnA
= ∂S ∂nA
∂S ∂N
(5)
dN d(dA)
= ∂S ∂dA
∂S ∂N
(6)
-10000 -500 0 500 1000 1500 2000
1 2 3 4 5 6
ns=1.495
nf=1.59
x (\nm)
I (
a
.u
.)
nf=1.59
nc=1.33 nf=1.59
nm=0.065+4i na=1.43265
Ag
-10000 -500 0 500 1000 1500 2000 0.5
1 1.5 2 2.5 3 3.5 4 4.5 5
ns=1.495
nf=1.59
x (\nm)
I (
a
.u
.)
nc=1.33 nm=0.15+3.2i
Ag
na=1.43265
(b)
Figure 2. (a) Modal field distribution of a metal clad planar
waveguide sensor with a silver cladding for TE component. (b) Modal field distribution of a metal clad planar waveguide sensor with a gold cladding for TE component.
3. NUMERICAL RESULTS AND DISCUSSION
We have chosen the following parameters: an operating wavelength
λ0 = 0.6328µm, the refractive indices of the substrate, metal, and film
are nS = 1.495, nM = 0.064 + 4i (silver), nM = 0.15 + 3.2i (gold),
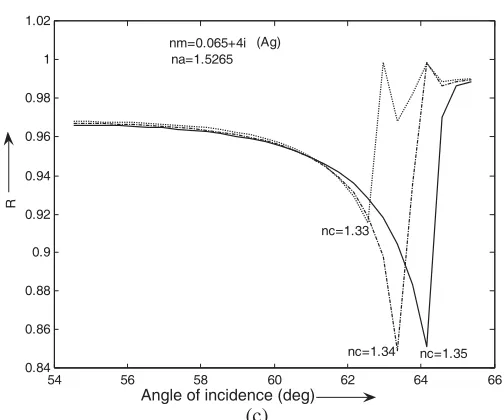
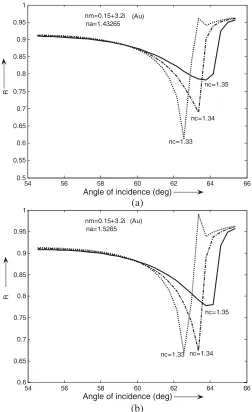
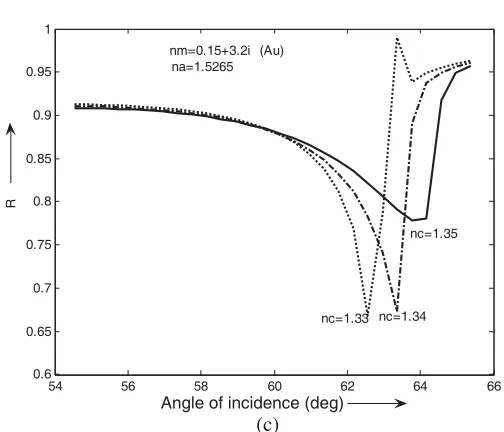
the reflectance of the waveguide. Hence we compute the values of reflectance reflectance R using Eq. (2) for various values of incident angleθIand we plot the curves betweenRandθI as illustrated in Fig. 3 and Fig. 4.
It is clear from Fig. 3 and Fig. 4 that as the cover refractive index changes from nC = 1.33 to nC = 1.35 the dip of reflectance shifts towards higher value of θ1. This will be the signature of bacteria and
the shift in the angleθ1 is totally dependent on the concentration and
54 56 58 60 62 64 66
0.82 0.84 0.86 0.88 0.9 0.92 0.94 0.96 0.98 1
R
nm=0.065+4i na=1.43265
nc=1.33
nc=1.34
nc=1.35 (Ag)
(a)
54 56 58 60 62 64 66
0.82 0.84 0.86 0.88 0.9 0.92 0.94 0.96 0.98 1
R
nc=1.33
nc=1.34 nc=1.35 nm=0.065+4i
na=1.49368 (Ag)
(b)
Angle of incidence (deg)
54 56 58 60 62 64 66 0.84
0.86 0.88 0.9 0.92 0.94 0.96 0.98 1 1.02
R
nm=0.065+4i na=1.5265
nc=1.33
nc=1.34 nc=1.35 (Ag)
(c) Angle of incidence (deg)
Figure 3. (a) Calculated Fresnell reflectance for T E polarized light for proposed waveguide with silver cladding. The refractive indices and thickness used are: nS= 1.49, nF = 1.59, dM = 0.03µm,dF = 0.5µm,
dA = 0.06µm. (b) Calculated Fresnell reflectance for T E polarized light for proposed waveguide with silver cladding. The refractive indices and thickness used are: nS = 1.49, nF = 1.59, dM = 0.03µm,
dF = 0.5µm, dA = 0.045µm. (c) Calculated Fresnell reflectance for T E polarized light for proposed waveguide with silver cladding. The refractive indices and thickness used are: nS = 1.49, nF = 1.59,
dM = 0.03µm, dF = 0.5µm, dA= 0.04µm.
Fig. 4 (gold) then in all the three cases the dip is blunt at nc = 1.35 for gold and have tendency to become sharp for higher refractive index materials for both metallic films. In this way we can say that the silver coating substrate-metal surface will give better information than gold coating. Here we also conclude that if the refractive index of affinity layer (nA = 1.5265) is large then the dip is sharp and we get more reliable information regarding the detection of Pseudomonas and
54 56 58 60 62 64 66
0.5 0.55 0.6 0.65 0.7 0.75 0.8 0.85 0.9 0.95 1
R
nm=0.15+3.2i na=1.43265
nc=1.35
nc=1.34
nc=1.33 (Au)
(a)
54 56 58 60 62 64 66
0.6 0.65 0.7 0.75 0.8 0.85 0.9 0.95 1
R
nm=0.15+3.2i na=1.5265
nc=1.33 nc=1.34 nc=1.35 (Au)
(b)
Angle of incidence (deg)
54 56 58 60 62 64 66 0.6
0.65 0.7 0.75 0.8 0.85 0.9 0.95 1
R
nm=0.15+3.2i na=1.5265
nc=1.33 nc=1.34 nc=1.35 (Au)
(c) Angle of incidence (deg)
Figure 4. (a) Calculated Fresnell reflectance for T E polarized light for proposed waveguide with gold cladding. The refractive indices and thickness used are: nS= 1.49, nF = 1.59, dM = 0.3µm,dF = 0.45µm,
dA = 0.025µm. (b) Calculated Fresnell reflectance for T E polarized light for proposed waveguide with gold cladding. The refractive indices and thickness used are: nS = 1.49, nF = 1.59, dM = 0.3µm,
dF = 0.45µm, dA = 0.05µm. (c) Calculated Fresnell reflectance for
T E polarized light for proposed waveguide with gold cladding. The refractive indices and thickness used are: nS = 1.49, nF = 1.59, dM = 0.3µm, dF = 0.45µm, dA= 0.03µm.
other bacteria.
The variation of sensitivity to refractive index changes ∂n∂N
A, in
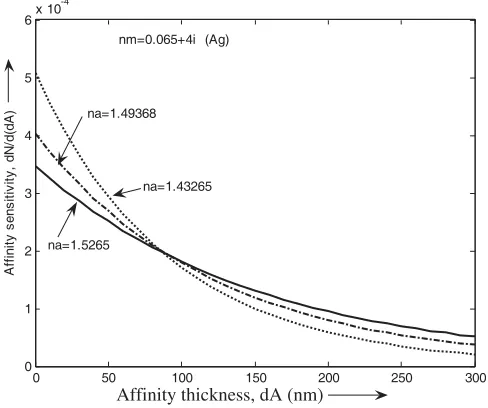
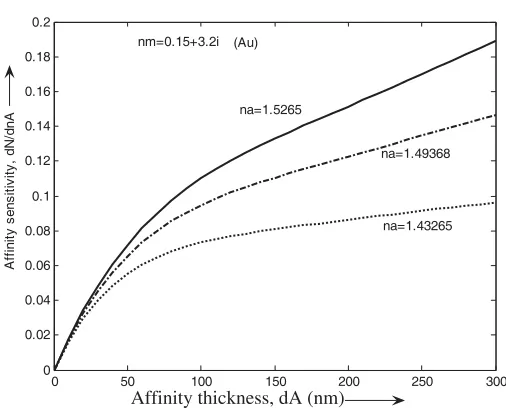
the affinity layer with affinity thickness dA for above three chosen materials is given in Fig. 5 (silver) and Fig. 7 (gold). In both cases we find the higher sensitivity for nicotine whose refractive index is higher than that of toluene and poly(trifluoroethyl methacrylate). The variation of sensitivity to thickness changes ∂d∂N
A, in the affinity layer
0 50 100 150 200 250 300 0
0.02 0.04 0.06 0.08 0.1 0.12 0.14 0.16 0.18 0.2
A
ff
ini
ty
s
e
ns
it
iv
it
y
, d
N
/d
nA
na=1.5265
na=1.49368
na=1.43265 nm=0.065+4i (Ag)
Affinity thickness, dA (nm)
Figure 5. Sensitivity to refractive index changes ∂n∂N
A, in the affinity
layer with affinity thicknessdA for silver coated waveguide.
0 50 100 150 200 250 300
0 1 2 3 4 5 6x 10
-4
Affi
n
ity s
e
n
s
it
iv
it
y
, d
N
/d(dA
)
na=1.5265 na=1.49368
na=1.43265 nm=0.065+4i (Ag)
Affinity thickness, dA (nm)
Figure 6. Sensitivity to thickness changes ∂d∂N
A, in the affinity layer
0 50 100 150 200 250 300 0
0.02 0.04 0.06 0.08 0.1 0.12 0.14 0.16 0.18 0.2
A
ff
ini
ty
s
ens
it
iv
it
y
, dN
/dnA
nm=0.15+3.2i
na=1.5265
na=1.49368
na=1.43265 (Au)
Affinity thickness, dA (nm)
Figure 7. Sensitivity to refractive index changes ∂n∂N
A, in the affinity
layer with affinity thicknessdA for gold coated waveguide.
0 50 100 150 200 250 300
0 1 2 3 4 5 6x 10
-4
Affi
n
ity
s
e
n
s
it
iv
it
y, d
N
/d(dA
)
nm=0.15+3.2i
na=1.49368
na=1.43265
na=1.5265
(Au)
Affinity thickness, dA (nm)
Figure 8. Sensitivity to thickness changes ∂d∂N
A, in the affinity layer
is also found in the case of gold coated substrate-metal surface in Fig. 7. Such type of behaviour is not given in [16]. Again, the variation of sensitivity to thickness changes ∂d∂N
A, in the affinity layer
with affinity thickness dA for nicotine is smaller than both toluene and poly(trifluoroethyl methacrylate). Now we are in a position to compare our computed results with the results given for four layer structure. Considering Fig. 5 and Fig. 7 it is clear that in our case the sensitivity due to ∂n∂N
A against dA is less than 0.2 where as in the case
of four layer structure it is greater than 0.5. But when we examine Fig. 6 and Fig. 8 we note that in our case the sensitivity due to ∂d∂N
A
againstdAis nearly equal to 5.0×10⁻⁴nm where as it is 3.0×10⁻⁴nm for the four layer structure. Thus we find that the sensitivity due to
∂N
∂nA is smaller in our case but at the same time the sensitivity due to
∂N
∂dA is greater. Hence for greater sensitivity, the sensitivity due to
∂N ∂dA
againstdA is preferable for the proposed structure.
4. CONCLUSION
We have compared silver coated metal-clad waveguide biosensor with the gold coated metal-clad waveguide biosensor having some selected affinity layers for the detection of Pseudomonas and Pseudomonas-like bacteria. The following facts are finally concluded
1) The silver coated waveguide always gives better result than the gold coated one.
2) The affinity layer refractive index should be quite high for sharp dip (as in the case of nicotine which refractive index is higher than poly (trifluoroethyl methacrylate) and toluene).
3) For higher sensitivity the refractive index of affinity layer should be higher while the thickness of affinity layers should be smaller. 4) The choice of affinity layer as the fifth layer in our formulation
seems more reasonable and convenient compared to the formation of adlayer during the process.
ACKNOWLEDGMENT
APPENDIX A.
In order to see the performance of proposed biosensor we solve Maxwell’s equations for five layer structure and get the Helmholtz equations which can be written as
∂2ψ(z)
∂z2 +
ω2ε(z)μ(z)−β2ψ(z) = 0 (A1)
where ψ represents the electric field for T E-polarized light and the magnetic field for T M-polarized light; ω is the angular frequency of the field and β is the propagation constant in x-direction, which can be written asβ =k0N, wherek0 is the free space wavenumber, andN
is the modal effective index.
Hence the solutions of the proposed waveguide for different regions can be written as
ψ(z)= ⎧ ⎪ ⎪ ⎪ ⎪ ⎨ ⎪ ⎪ ⎪ ⎪ ⎩
ACexp(−ikCz)ei(ωt−kxx) Cover region
{AAexp(ikAz)+BAexp(−ikAz)}ei(ωt−kxx) Affinity region
{AF exp(ikFz)+BFexp(−ikFz)}ei(ωt−kxx) Film region
{AMexp(ikMz)+BMexp(−ikMz)}ei(ωt−kxx) Metal region
ASexp(ikSz)ei(ωt−kxx) Substrate region ⎫ ⎪ ⎪ ⎪ ⎪ ⎬ ⎪ ⎪ ⎪ ⎪ ⎭ (A2) where kC =
β2−ε
Ck20, kA =
εAk02−β2, kF =
εFk02−β2, kM =
εMk02−β2 and kS=
β2−ε
Sk20.
Also the dispersion relation for the proposed five layered waveguide
2πm= 2kFdF −φF,M,S−φF,A,C (A3)
where φF, M, S = 2 tan−1
i
1−rF, M 1 +rF, M
1−rM, Se2ikMdM 1 +rM, Se2ikMdM
φF, A, C = 2 tan−1
i
1−rF, A 1 +rF, A
1−rA,Ce2ikAdA 1 +rA,Ce2ikAdA
rF, M = kkF −kM
F +kM, rM, S
= kM −kS
kM +kS,
rF, A= kkF −kA
F +kA, rA, C
= kA−kC
kA+kC
The reflectance of the proposed waveguide can be written as
R=|rS,M,F,A,C|2 =
rS,M+rM,F,A,Ce2ikMdM 1 +rS,MrM,F,A,Ce2ikMdM
where
rM,F,A,C= rM,F
+rF,A,C e2ikFdF
1 +rM,FrF,A,C e2ikFdF, rF,A,C
= rF,A+rA,C e
2ikAdA
1 +rF,ArA,C e2ikAdA
rS,M = kkS−kM
S+kM, rM,F
= kM −kF
kM +kF,
By matching the field at the boundaries we get a set of eight equations having eight unknown constants. These equations are written as
Δψ= 0 (A5)
where Δ is 8×8 determinant having elements given as follows
a11 = exp(−kSdM); a12=−exp(−ikMdM); a13=−exp(ikMdM);
a14 = 0; a15= 0; a16= 0; a17= 0; a18= 0; a21=−kSexp(−kSdM);
a22 = ikMexp(−ikMdM); a23=−ikMexp(ikMdM); a24= 0; a25 = 0; a26= 0; a27= 0; a28= 0; a31= 0; a32= 1; a33= 1; a34 = −1; a35=−1;a36= 0; a37= 0; a38= 0; a41= 0; a42=ikM;
a43 = −ikM; a44=−ikF; a45=ikF; a46= 0; a47= 0; a48= 0; a51 = 0; a52= 0; a53= 0; a54= exp(ikFdF); a55= exp(−ikFdF);
a56 = −exp(ikAdF); a57=−exp(−ikAdF); a58= 0; a61= 0; a62 = 0; a63= 0; a64=ikF exp(ikFdF); a65=−ikFexp(−ikFdF);
a66 = −ikAexp(ikAdF); a67=ikAexp(−ikAdF); a68= 0; a71= 0; a72 = 0; a73= 0; a74= 0; a75= 0; a76= exp(ikA(dA+dF));
a77 = −exp(−ikA(dA+dF)); a78=−exp(−ikC(dA+dF)); a81= 0; a82 = 0; a83= 0; a84= 0; a85= 0; a86=ikAexp(ikA(dA+dF));
a87 = −ikAexp(−ikA(dA+dF)); a88=kCexp(−ikC(dA+dF));
REFERENCES
1. Tiefenthaler, K. and W. Lukosz, “Integrated optical switches and glass sensor,”Opt. Letter, Vol. 10, 137–139, 1984.
2. Tiefenthaler, K. and W. Lukosz, “Sensitivity of grating couplers as integrated optical chemical sensors,”Rev. Mod. Phys., Vol. 49, 361–420, 1977.
3. Kunz, R. E., “Miniature integrated optical modules for chemical and biological sensing,” Sens. Actuators B, Vol. 38, 13–28, 1997. 4. Lukosz, W., “Integrated optical chemical and direct biochemical
5. Horvath, R., G. Fricsovszky, and E. Pap, “Application of the optical waveguide lightmode spectroscopy to monitor lipid bilayer phase transition,”Biosensors Bioelectron., Vol. 18, 415–428, 2003. 6. Hervath, R., et al., “Optical waveguide sensor for on-line
monitoring of bacteria,” Opt. Letter, Vol. 28, 1233–1235, 2003. 7. Marazuela, M. D., et al., “Fiber-optic biosensors — An overview,”
Anal. Bioanal Chem., Vol. 372, 664–682, 2002.
8. Ivnitski, D., et al., “Review: Biosensors for detection of pathogenic bacteria,” Biosens. Bioelectron, Vol. 14, 599–624, 1999.
9. Udd, E., “An overview of fiber optic sensors,”Rev. Sci. Instrum., Vol. 66, 4015–4030, 1995.
10. Kuswandi, B., “Simple optical fiber biosensor based on immobilized enzyme for monitoring of trace having metal ions,”
Anal. Bioanal. Chem., Vol. 376, 1104–1110, 2003.
11. Horvath, R., et al., “Measurement of guided light mode intensity: An alternative waveguide sensing principle,” Appl. Phys. Lett., Vol. 84, 4044–4046, 2004.
12. Homola, J., S. S. Yee, and G. Gauglitz, “Surface plasmon resonance sensors: Review,” Sensors and Actuators B, Vol. 54, 3–15, 1999.
13. Sharma, A. K. and B. D. Gupta, “Theoretical model of a fiber optic remote sensor based on surface plasmon resonance for temperature detection,” Optical Fiber Technol., Vol. 12, 87–100, 2006.
14. Horvath, R., H. C. Pederson, and N. Skivensen, “Monitoring of living cell attachment and spreading using reverse symmetry wave-guide sensing,”Appl. Phys. Letters, Vol. 86, 071101–071103, 2005. 15. Skivensen, N., R. Horvath, and H. C. Pederson “Optimization of metal-clad waveguide sensor,” Sensor and Actuators B, Vol. 106, 668–676, 2005.
16. Skivensen, N., R. Horvath, S. Thinggaaed, N. B. Larsen, and H. C. Pedersen, “Deep-probe metal-clad waveguide biosensors,”
Biosensor and Bioelectronics, Vol. 22, 1282–1288, 2007.
17. Ksendzov, A. and Y. Lin, “Integrated Optics ring-resonator sensor for protein detection,” Opt. Lett., Vol. 30, 3344–3346, 2005. 18. Yalcin, A., K. C. Popat, J. C. Aldridge, T. A. Desai, J. Hryniewicz,
et al., “Optical sensing of biomolecules using micro -ring resonators,”IEEE J. Sel. Topics Quantum Electron, Vol. 12, 148– 154, 2006.
J. Elizalde, et al., “Microfluidic optical Integrated CMOS compatible devices for level free biochemical sensing,” J.
Micromech. Microeng., Vol. 16, 1006–1016, 2006.
20. Densmore, A., D. X. Xu, P. Waldron, S. Janz, P. Cheben, J. Lapointe, et al., “A silicon-on-insulator photonic wire based evanescent field sensor,”IEEE Photonics Technology Letters, Vol. 18, No. 23, 2520–2522, 2006.
21. Veldhuis, G. J., O. Parriaux, H. J. W. Hockstra, and P. V. Lambeck, “Sensitivity enhancement in evanescent optical waveguide sensors,”J. of Lightw. Technol., Vol. 18, 677–682, 2000. 22. Jourab, M., et al., “The development of a metal clad waveguide sensor for the detection of particles,” Sensors and Actuators B, Vol. 90, 296–307, 2003.
23. Jourab, M., et al., “An integrated metal clad leaky waveguide sensor for detection of bacteria,” Anal. Chemistry, Vol. 77, 232– 242, 2005.
24. Taya, S. A., M. M. Shabat, and H. M. Khalil, “Enhancement of sensitivity in optical waveguide sensors using left-handed materials,” doi:10.1016/j.ijleo.2007.12.001, 2007.
25. Huang, S. Y. and S. Y. Wang, “Light propagation characteristics in various dielectric waveguide,” Chinese Journal of Physics, Vol. 24, No. 2, 129–137, 1986.
26. Fletchert, M. and G. I. Loeb, “Influence of substratum characteristics on the attachment of a marine pseudomonad to solid surfaces,”Applied and Environmental Microbiology, Vol. 37, No. 1, 67–72, 1979.
27. Morell, A. and Y. H. Ahn, “Optical efficiency factors of free-living marine bacteria: Influence of bacterioplankton upon the optical properties and particulate organic carbon in oceanic waters,”
Journal of Marine Research, Vol. 48, 145–175, 1990.
28. Lavers, C. R., K. Itoh, S. C. Wu, M. Murabayashi, I. Mauchline, G. Stewart, and T. Stout, “Planar optical waveguides for sensing applications,”Sensors and Actuators B, Vol. 69, 85–95, 2000. 29. Campbell, A. N., E. M. Kartzmark, and W. E. Falconer, “The
system: Nicotine-methylethyl ketone-water,” Can. J. Chem., Vol. 36, 1475–1486, 1958.
30. Debenham, M. and G. D. Dew, “The refractive index of toluene in the visible spectral region,”J. Phys. E: Sci. Instrum., Vol. 14, 544–545, 1981.
waveguides,” Progress In Electromagnetics Research B, Vol. 4, 171–182, 2008.
32. Wang, Z. J. and J. F. Dong, “Analysis of guided modes in asym-metric left-handed slab waveguides,”Progress In Electromagnetics
Research, PIER 62, 203–215, 2006.
33. Liu, S.-H., C.-H. Liang, W. Ding, L. Chen, and W.-T. Pan, “Electromagnetic wave propagation through a slab waveguide of uniaxially anisotropic dispersive metamaterial,” Progress In