Optimization Of Process Parameters Of Wirecut Electric Discharge
Machine Processed En 31 Steel By Grey Relational Analysis
Kondpak Prateek & M.Sreenivasa Rao
1M.tech (Manufacturing systems) Department of Mechanical Engineering JNTUH COLLEGE OF ENGINEERING, HYDERABAD .
2(ASSISTANT PROFESSOR)
Department of Mechanical Engineering JNTUH COLLEGE OF ENGINEERING, HYDERABAD.
Abstract:
WIRE EDM has become an important non-traditional machining process as it provides an effective solution for producing components made of difficult to machine materials like titanium, zirconium etc. and intricate shapes which are not possible by conventional machining methods. Due to large number of process parameters and responses lots of researchers have attempted to model this process. This paper reviews the research trends in WEDM on relation between different process parameters like pulse on time(TON), pulse off time(TOFF), servo voltage(sv) on different process responses like Material Removal Rate, Surface Roughness. In addition, the paper highlights different modelling and optimization methods. The final part of the paper includes some recommendations about the trends for future wire Edm researches.
The main objectives of this study investigate and evaluate the effect of different input process parameters (pulse on time, pulse off time, servo voltage) on material removal rate, surface roughness as response parameters have been considered for each Experiment. Experimentation was planned as per Taguchi’s L27 Orthogonal array during machining of EN 31 work material which is High Carbon High Chromium Die Steel (HCHCR). Brass wire electrode with 0.25mm Diameter was used as tool in the Experiments. The results are analyzed using analysis of variance (ANOVA) method. This parametric analysis (ANOVA) shows the percentage contribution of parameters individually. Grey relational analysis are applied to determine the suitable selection of machining parameters for wire cut EDM process. A grey relational grade obtained from the grey relational analysis is used to optimize the process parameters. By analyzing the Grey relational grade we find the optimum parameters. Confirmation test has been
conducted to optimize the process parameter. Further mathematical models are developed using Box-Behnken design of experiments of response surface methodology to optimize the process parameters using state of art optimization techniques for future studies.
1. INTRODUCTION:
1.1 Material Selection :
The material selected for this process is EN 31 steel,
which is an high carbon- chromium steel. This steel
offers high measure of hardness with compressive
strength and abrasion resistance. These steels retain their
hardness up to a temperature of 4500c. It has increased
wear resistance.
1.1.1 CHEMICAL COMPOSITION OF EN-31 STEEL
ELEMENT METRIC
Tensile Strength 750 N/mm2
Yielsd stress 450 N/mm2
Reduction of Area 0.45 Element Content (%)
C 1.50
Mn 0.52
Si 1.3
Cr 0.22
Ni 0.33
Mo 0.06
Elongation 0.3
1.1.1 Mechanical Properties of EN-31
Thermal
Conductivity(w/m-k)
Density
(Kg/m3)
Melting
point ( 0c )
46.6 7810 1540
1.1.2 Physical Properties of EN-31
1.2 Applications of EN-31:
Typical applications in stamping dies, metal cutting tools or any other industries because of its high strength and heavy weight.
Aerospace industry Punching dies
Ball and Roller Bearings Spinning tools
By its character this type of steel has high resisting nature against wear and can be used for components which are subjected to severe abrasion, wear or high surface loading.
1.3 Classification of EDM
There are several EDM processes such as Wire Electrical Discharge Machining, Electrical Discharge Milling, Electrical Discharge Grinding (EDG), Electrical Discharge Dressing (EDD), Ultrasonic Aided EDM (UEDM), Abrasive Electrical Discharge Grinding (AEDG), Micro Electrical Discharge Machining (MEDM), Micro Wire EDM (MWEDM), Mole EDM, and Double Rotating Electrodes EDM [3]. Pandey and Shan [7] classified EDM processes into three main categories as shown in Fig. 1.2.
1.4 Wire Electric Discharge Machining (WEDM) WEDM is considered as a unique adoption of the conventional EDM process which comprises of a main worktable, wire drive mechanism, a CNC controller, working fluid tank and attachments. The work piece is placed on the fixture table and fixed securely by clamps and bolts. The table moves along X and Y-axis and it is driven by the DC servo motors. Wire electrode usually made of thin copper, brass, molybdenum or tungsten of diameter 0.05-0.30 mm, which transforms electrical energy to thermal energy, is used for cutting materials. The wire is stored and wound on a wire drum which can rotate at 1500rpm. The wire is continuously fed from wire drum which moves though the work piece and is supported under tension between a pair of wire guides located at the opposite sides of the work piece. During the WEDM process,the material is eroded ahead of the wire and there is no direct contact between the work piece and the wire, eliminating the mechanical stresses during machining. Also, the work piece and the wire electrode (tool) are separated by a thin film of dielectric fluid that is continuously fed to the machining zone to flush away the eroded particles. The movement of table is controlled numerically to achieve the desired three- dimensional shape and accuracy of the workpiece.
Fig. 1.8 various shapes cut with wire cut EDM
Wire electrical discharge machining is mainly used to cut contour shapes and design into hard metals, which are otherwise difficult to machine. Contour parts can be easily cut with help of wire cut EDM. Fig. 1.8 shows application of WEDM for the complex parts
• Tooling elements • Automobile parts • Plastic Molding. • Dies, Hobs Blanking. • Shear Blades. • Hot Shearing Tools. • Hardened Rolls. • Thread Rolling Dies. • Blade Cutters for Wire Nails.
• Dies for Nut Manufacturers etc.
2. LITERATURE REVIEW:
1. Kruth, et. al. of Katholieke University, Belgium studied and experimentally tested several compositions of wires, with high tensile core and several coatings. They have found that, while cutting with prototype wires, a significant rise in accuracy is obtained, especially in corner cutting, while the cutting rate is at a comparable level as commercial reference wire.
2. Prohaszka et al (1996) proposed the requirements of the materials that can be used as WEDM electrodes and will lead to the improvement of WEDM performance. He discussed the material requirements for fabricating WEDM electrodes for improving WEDM performance. Experiments were carried out regarding the choice of suitable wire electrode materials, the
effects of the material properties on the machinability of WEDM. He evaluated the influence of the various materials used for the fabrication of wire electrodes on the machinability of WEDM. A series of experiments have been conducted on a standard EDM unit. Negative polarity rods of pure magnesium, tin and zinc, of a diameter of 5.0 mm were used as the tool electrodes.
3. Tarng et al. [12] formulated a neural network model and simulated annealing algorithm in order to predict and optimize the surface roughness and cutting velocity of the WEDM process when machining SUS– 304 stainless steel materials.
4. Gokler et al. [17] investigated under various experimental conditions the surface roughness achievable for 1040, 2379, and 2738 steel materials and the relative machining parameters for the WEDM process.
5. Puri et al. [18] investigated the variation of geometrical inaccuracy caused due to wire lag with various machine control parameters.
6. Ramakrishnan et al. [19] developed a mathematical model using the response surface methodology. A good amount of research has already been done in the area of WEDM technology. To the best of the knowledge of the authors of this work, there is not found any published paper for optimizing multiple performance characteristics of the WEDM process using the Taguchi method. Keeping this consideration in view, this paper describes optimization of multiple performance characteristics using the robust parametric design approach, for achieving a better material removal rate, surface finish, and wire wear ratio.
3. DESIGN OF EXPERIMENT:
3.1 WEDM Process Parameters and
Response Variables
an accelerated rated [26]. However, due to a large number of variables in WEDM, it is difficult to achieve the optimal performance of WEDM processes and the effective way of solving this problem is to establish the relationship between the response variables of the process and its controllable input parameters.
3.2 Process Parameters
Throughout this dissertation work input parameters considered for Wire cut EDM are machining parameters like as pulse on time, pulse off time, servo voltage and output parameters are surface roughness and material removal rate.
3.3.2 Steps to perform Taguchi design of
the experiment
1.
Identify the main function, side effects, and failure mode.2. Identify the noise factors, testing conditions, and quality characteristics.
3. Identify the objective function to be optimized.
4. Identify the control factors and their levels.
5. Select the orthogonal array matrix experiment.
6. Conduct the matrix experiment.
7. Analyze the data; predict the optimum levels and performance.
8. Perform the verification experiment and plan the future action. Identify the main function, side effects, and failure mode.
3.3.3 Key terms used in DOE 1. Factors
These are variables that have direct influence on the performance of the product or process under investigation.
Factors are of two types:
(a) Discrete - Assumes known values or status for the level. Example: Container, Vendor, Type of materials, etc.
(b) Continuous - Can assume any workable value for the factor Levels. Example: Temperature, Pressure, Thickness, etc.
2. Levels
This is the values or descriptions that define the condition of the factor held while performing the experiments.
3.3
Factors with levels value
Sr. No.
Fixed Parameters Set Value
1 Wire material Brass (0.25mm) 2 Peak current (A) 230
3 Pulse peak voltage(V)
2
4 Wire feed rate (m\min)
4
5 Flushing
Pressure(kgf/cm2)
12
6 Wire Tension (kgf) 9
3.6
Experimental design
Sr.No.
Machining process parameter
Leve l 1
Leve l 2
Leve l 3
1 Pulse on Time (μs) 110 120 130
2 Pulse Off Time (μs) 45 55 65
As per table, L27 orthogonal array of “Taguchi method”
has been selected for the experiments design in MINITAB 17. Box-Behnken design of experiments in Response Surface Methodology for developing mathematical models for responses in MINITAB 17.
CHAPTER 4
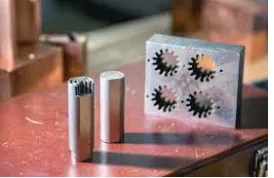
EXPERIMENT WORK AND MEASUREMENT The experimental setup and the experiment is designed
and carried out at the Vinayaka wire cut which is placed
at old Airport Road Hyderabad. The primary goal of the
dissertation work is to predict the Material Removal
Rate and surface roughness. The work is carried out in
sprint cut wire cut electro discharge machine of EN 31
HCHCR material by varying machining parameters.
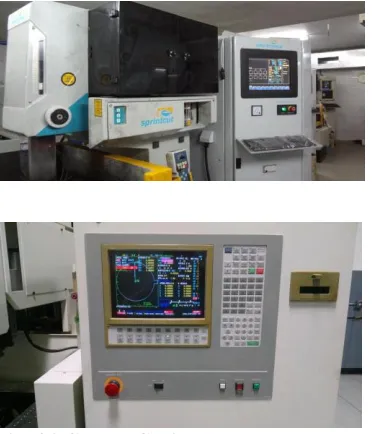
Fig. 4.1 Sprint cut Wire Cut EDM
Fig. 4.3 Control Cabinet WORK TABLE
Design Fixed column,
moving table Table size 440 x 650 ×300 mm
MAX.WORK PIECE DIMENSION Max. work piece height 200 mm Max. work piece weight 500 kg Main table traverse
(X,Y)
300 x 400 mm
Aux. table traverse (U,V)
80 x 80 mm
Wire electrode diameter
0.25 mm (std.) 0.15, 0.20 mm (opt.)
PULSE GENERATOR
Pulse Generator ELPULS-40 A DLX Pulse peak voltage 1 Step
CNC Controller EMT 100W-5
Input power supply 8.3 phase, AC, 415 V , 50 Hz
Connected load 10 kVA Average power
consumption
6 to 7 kVA
DIELECTRIC SYSTEM
Dielectric Unit DL 25 P
Fig. 4.4 Work Table CHAPTER 5
ANOVA ANALYSIS:
5.1
Introduction
The analysis of variance is the statistical treatment most commonly applied to the results of the experiment to determine the percent contribution of each factors. Study of ANOVA table for a given analysis helps to determine which of the factors need control and which do not. Once the optimum condition is determined, it is usually good practice to run a confirmation experiment. In case of fractional factorial only some of the tests of full factorial are conducted. The analysis of the partial experiment must include an analysis of confidence that can be placed in the results. So, analysis of variance is used to provide a measure of confidence. The technique does not directly analyse the data, but rather determines the variability (variance) of the data. Analysis provides the variance of controllable and noise factors. By understanding the source and magnitude of variance, robust operating conditions can be predicted.
Table 5.1 Control parameter
5.1.1 Table for factor with level
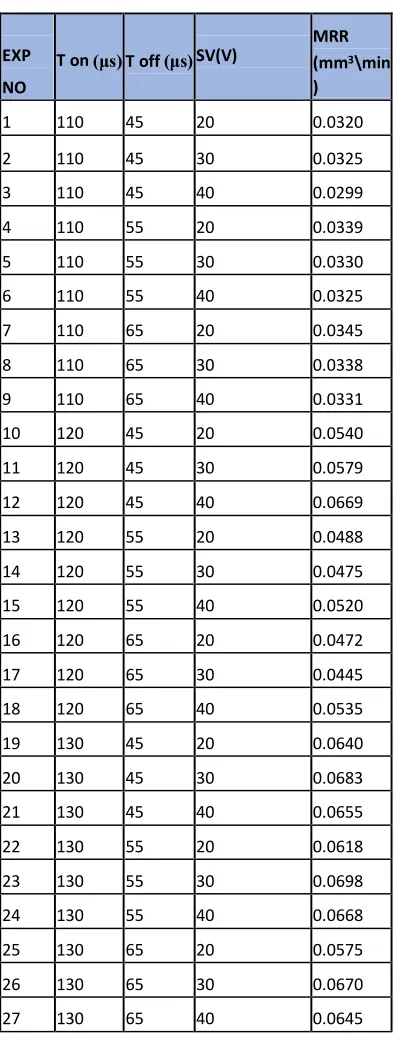
EXP NO
T on (μs) T off (μs) SV(V)
MRR (mm3\min
)
1 110 45 20 0.0320
2 110 45 30 0.0325
3 110 45 40 0.0299
4 110 55 20 0.0339
5 110 55 30 0.0330
6 110 55 40 0.0325
7 110 65 20 0.0345
8 110 65 30 0.0338
9 110 65 40 0.0331
10 120 45 20 0.0540
11 120 45 30 0.0579
12 120 45 40 0.0669
13 120 55 20 0.0488
14 120 55 30 0.0475
15 120 55 40 0.0520
16 120 65 20 0.0472
17 120 65 30 0.0445
18 120 65 40 0.0535
19 130 45 20 0.0640
20 130 45 30 0.0683
21 130 45 40 0.0655
22 130 55 20 0.0618
23 130 55 30 0.0698
24 130 55 40 0.0668
25 130 65 20 0.0575
26 130 65 30 0.0670
27 130 65 40 0.0645
Total degree of freedom = f
T= n-1 = 26
CHAPTER 6
MULTI RESPONSE OPTIMIZATION
6.1
Grey relational analysis for multi
objective optimization
In grey relational analysis, the function of factors is neglected in situations where the range of the sequence is large or the standard value is enormous .However, this analysis might produce incorrect results if the factors ,goal and directions are different .therefore one has to preprocess the data which are related to a group of sequence ,which is called “grey relational generation “data preprocessing is a process of transferring the original sequence to a comparable sequence for this purpose the experimental result are normalized in the range between zero and one the normalization can be done from three different approaches
Fig. 6.1 Graph of Grey relational grades
Table No: 6.5 Response table for means of Grey relational grade
Ma chi nin g par ame ters
Average Grey relational grade by factor level Ma in eff ect [M ax-mi n] Ra nk Level 1 Level
2 Level 3 Pulse On Time , A
0.372461 0.609 508
0.882 459*
0.509938 1
Pulse Off Time , B
0.650298* 0.618 361
0.595 769
0.054529 2
Servo Voltage ,C
0.591199 0.627 601
0.645 629*
0.054430 3
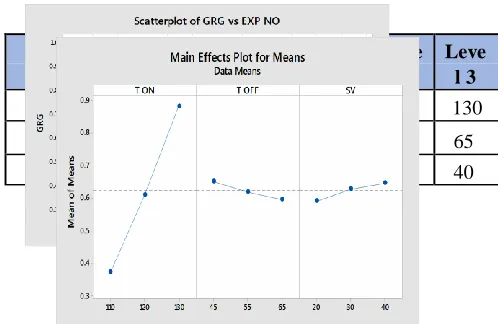
Fig. 6.2 Graph of main effects plot for means for Grey relational grade
Table No: 6.5 shows average grey relational grade by factor level. From this table, one has concluded optimum parameter levels which are indicated by “*”. In this table, higher grey relational grade from each level of factor indicates the optimum level. From this table it is concluded that the optimum parameter level for Pulse on time, Pulse off time and Servo voltage is (110 μs), (36 μs) and (20volts) respectively.
6.6
Confirmation test
Grey theory predictio n Design Expe rime ntal valu es
LEVEL A1B2C3 A1B2C3 A1B2C3
Material Remova
l 3
Rate(mm /min)
_ 0.0698 0.0783
Surfa ce Roug hness (µm)
_ 3.4925 3.5014
Grey Relat ional Grad
e
0.9353 0.9987 _
Sr. No. Machining process parameter Leve l 1 Leve l 2 Leve l 3
1 Pulse On Time (μs) 110 120 130
2 Pulse Off Time (μs) 45 55 65
Table No: 6.6 Table for confirmation
experiment
ANOVA for GRG of brass wire electrode shows Toff and SV are most significant parameters and contributes with 30.9894% and 29.9966% respectively, SV is insignificant parameter and contributes 24.9449%.
The error between Grey theory prediction design using software and experimental values using Grey relational analysis for GRG is 0.14999% which shows that model developed is significant.CHAPTER 7
RESULT AND DISCUSSION:
After performing the experiment for all 27 runs and measuring the output parameters like material removal rate and surface roughness for wire cut EDM of EN 31 HCHCR, whatever results generated are discussed in this chapter
7.1 Main Effect Plots for Input Parameters V/S
Output Parameters
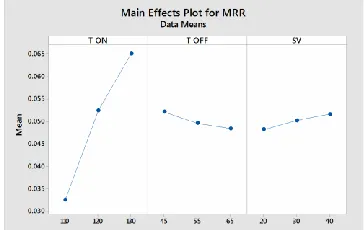
Fig. 7.1 Graph of input parameters v/s material
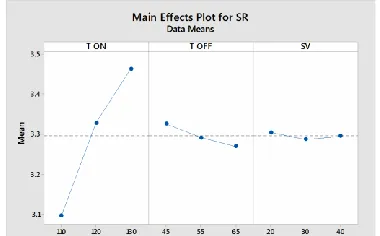
removal rateFig. 7.2 Graph of input parameters v/s surface
roughnessCHAPTER 8
DEVELOPMENT OF MATHEMATICAL MODELS
The experimental results are used to obtain the
mathematical relationship between process parameters and machining outputs. The coefficients of mathematical models are computed using method of multiple regressions. In this study, SPSS, Minitab17 (Software Package for Statistical Solutions), for regression analysis custom made software created by the author was used for the regression analysis. This software is used to test several models, viz., linear, exponential, power series (user-defined). Out of all models tested, the model that has high coefficient of multiple determination (R2) value
is chosen. The relationship between response variable(s) and process parameters can be expressed as
EXP.N
O
Ton Toff SV MRR SR
1 110 55 20 0.0339 3,1970
2 130 55 40 0.0668 3.4692
3 110 65 30 0.0338 3.0250
4 120 45 40 0.0669 3.3808
5 120 45 20 0.0540 3.3575
6 120 65 20 0.0472 3.2907
7 120 55 30 0.0475 3.2907
8 130 65 30 0.0670 3.4890
9 130 55 20 0.0618 3.4578
10 120 55 30 0.0475 3.2907
11 120 55 30 0.0475 3.2907
12 120 65 40 0.0535 3.3496
13 110 45 30 0.0365 3.1919
15 130 45 30 0.0683 3.4416
Table No: 8.1 BOX-BEHNKEN design of experiments
CHAPTER 9
CONCLUSION:
In the presented work, experiments are carried out for
material removal rate and surface roughness with
variables as pulse on time, pulse off time and servo
voltage. There are 27 experimental readings taken for all
variables to conduct the parametric study.
Finally, it can be concluded that:
The ANOVA analysis is conducted to know the percentage contribution of the input parameters on outputparameters. ANOVA analysis results that the percentage
contribution of pulse on time is 87.2%, pulse off time is
1.81% and servo voltage is 1.81% for material removal rate,
which shows that the influence of Pulse off time is very less
compare to other parameters. The percentage contribution
of Pulse on time is 74.2%, Pulse off time is 1.01% and Servo
voltage is 15.9% for Surface Roughness which shows that
the influence of Pulse off time is very less compare to other
parameters. The error and percentage contribution of
interaction terms found in ANOVA analysis is 9.18% for
material removal rate and 8.89% for surface roughness.
Grey relational analysis is done to find out optimal parameter levels. After grey relational analysis, it is foundthat optimal parameter levels are pulse on time at level 1 (110 μs), pulse off time at level 2 (55 μs), servo voltage at
level 3 (40 volts). The results of optimum parameters are
material removal rate of 0.0698 mm3/min, surface roughness of 3.4925 μm .
Process parameters do not have some little effect for every response. Significant parameters and its percentagecontribution changes as per the behaviour of the parameter
with objective response.
Increase of Pulse on time generates more spark energy as the length of time that electricity supply increases.MRR and SR all response increasing with pulse on time.
Pulse on time found most significant parameter in all
response. Surface roughness also increases with increase of
pulse on time because the increases of pulse on time produce
crater with broader and deeper characteristic.
Pulse off time has opposite effect to pulse on time. MRR decrease with increase of pulse off time, while surfaceroughness first increases and slightly reduces further when
level of pulse on time increases. During off time removed
material flushed away. More the off time better the flushing.
Pulse off time found least significant parameter in all
response.
Servo voltage has little effect on SR and MRR.MRR and Surface roughness reduces with increase ofservo voltage.
Mathematical models for responses which are developed are fitted into the data are further optimized usingstate of art techniques like Teacher Learner Based
Optimization (TLBO) and Particle Swarm Optimization
(PSO).
CHAPTER 10
FUTURE SCOPE
The mathematical model can be developed with different work piece and electrode materials for EDM and
Responses like Kerf width, roundness, circularity, cylindricity, machining cost etc. are to be considered infurther research.
The standard optimization procedure can be developed and the optimal results are to be validated withdifferent Multi criteria decision making method.
The weightage can be finding with different techniques such as AHP, Weighting approach etc.The developed mathematical model can be further optimized using state of art techniques like Teacher Learner Based Optimization (TLBO) and Particle Swarm Optimization (PSO).
REFERENCES
[1] Ghodsiyeh D., Davoudinejad, A., Hashemzadeh, M., Hosseininezhad, N., and Golshan A (2013) ‘‘Optimizing Finishing Process in WEDMing of Titanium Alloy (Ti6Al4V) by Brass Wire based on Response Surface Methodology’’ Re- search Journal of Applied Sciences, Engineering and Technology.
[2] Kanlayasiri, K., Boonmung, S., (2007b). ‘‘An investigation on effects of wire-EDM machining parameters on surface roughness of newly developed DC53 die steel’’. Journal of Materials Processing Technology. Vol.187-188, pp. 26-29.
[3] Kapoor, J., Singh, S., Khamba, J. S., (2010) ‘‘Recent Devel- opments in Wire Electrodes for High Performance WEDM’’ Proceedings of the World Congress on Engineering 2010, Vol. II, pp. 1-4.
[4] Mahapatra , S.S., Amar Patnaik, (2006b). ‘‘Parametric Opti- mization of Wire Electrical Discharge Machining (WEDM) Process using Taguchi Method’’. Journal of the Brazilian Society of Mechanical Sciences and Engineering. Vol. XX- VIII, No. 4, pp. 422-429.
[5] Tarng, Y.S., Ma, S.C. and Chung, L.K. (1995). ‘‘Determi- nation of optimal cutting parameters in wire electrical dis- charge machining’’. International Journal of Machine Tools and Manufacture. Vol. 35, No 12, pp.1693– 170.
[6] Vamsi K. P. ,Surendra B. B, Madar V. P ,Swapna M. (2010) ‘‘Optimizing Surface Finish in WEDM Using the Taguchi Parameter Design Method’’ Journal of the Brazilian Society of Mechanical Sciences and Engineering. Vol. XXXII, No.2, pp. 107-113.
[7] Ahmed Raza Khan, Adeel Ikram, Nadeem Ahmad Mufti, Muhammad Qaiser Saleem, “Parametric optimization for surface roughness, kerf and MRR in wire electrical discharge machining (WEDM) using Taguchi design of experiment”, Journal of Mechanical Science and Technology ,27 (7) 2133~2141, (2013) 65