Target Classification from JEM Signal Using Frequency Masking
Si-Ho Kim*, Chan-Hong Kim, Dae-Young Chae, and Sang-In Lee
Abstract—This paper deals with a technique for classifying jet aircrafts from JEM (Jet Engine Modulation) signal. A novel method to recognize an engine model by analyzing JEM spectrum using frequency mask is proposed. The frequency mask extracts and analyses the spectral component at the frequencies that are predicted from the blade number of a jet engine and the estimated spool rate. The proposed method does not need a complicated logical algorithm for finding the chopping frequency or the pre-simulated engine spectra used in previous methods. In addition, we suggest a method to precisely estimate the spool rate in the spectrum domain of JEM signal, which plays an important role in generating the frequency mask. The classification experiments using the JEM signals measured from two fabricated engine models verify that the proposed algorithm has good performance in the recognition of jet aircrafts.
1. INTRODUCTION
Radar is an electromagnetic system for the detection and location of target objects by transmitting an electromagnetic wave into space and receiving the reflected signal [1]. The reflected signal from a target has phase information as well as amplitude and they can be used for target classification. JEM target classification is the technology that classifies the class or type of jet aircraft by analyzing the reflected radar signal that is modulated by the rotation of blades in the jet engine of aircraft [2–12]. JEM scheme is known as the most practical method in the view point of computation load and performance in operational environment. The general approach in JEM scheme estimates the number of blades of jet engine using JEM signal and classify the target by comparing it with the number of blades of each engine in DB [2]. Only the blade number information is needed for classification and it is independent of aspect angle and frequency. Nonetheless, since the number of blade is principally integer value, it is hard to express similarity or degree of closeness for the result of classification. It means that target classification fails if the number of blade is not exactly estimated. The misestimation of blade number results from the incorrect estimation of spool rate and chopping frequency. The spool rate is the basic rotation rate of a jet engine compressor and the chopping frequency is the fundamental frequency of harmonics generated by the rotor blades of individual stages. It is important to estimate the spool rate and the chopping frequency from JEM signal. Especially, a complicated logical algorithm is needed to determine the fundamental chopping frequency among many spectral lines [3–5]. Alternative approach classifies a target by comparing the spectrum of measured signal and the spectra database for various known engines [6]. The latter would show better performance but it depends on the quality of the simulated spectra. Most of all, it is practically not easy to obtain the JEM spectra for various aspect angles and engines because the physical structure of engines as well as the number of blades are need to simulate them. To overcome the weakness of the two JEM schemes previously stated, we propose a novel scheme that can efficiently classify a target just using the blade number information without the complex logical algorithm to find the chopping frequency or the simulated spectra DB.
Received 6 October 2016, Accepted 24 December 2016, Scheduled 13 January 2017
* Corresponding author: Si-Ho Kim ([email protected]).
68 Kim et al.
2. TARGET CLASSIFICATION FROM JEM SIGNAL
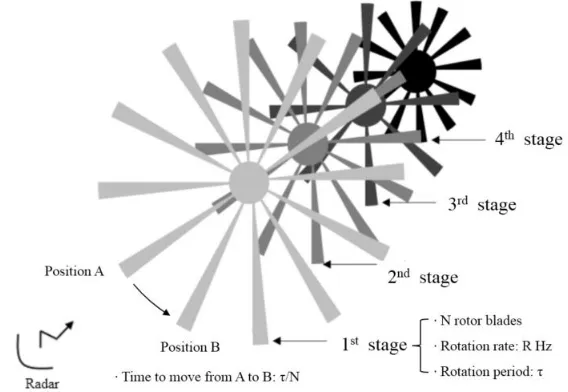
A jet engine has a number of individual stages at its front and the different numbers of rotor blades on each rotor stage. The rotor blades are attached to a shaft for air compression as shown in Figure 1. Rotation of the rotor blades causes the complicated amplitude and phase modulation in the reflected radar signal. It is a hard problem to mathematically analyze and model the modulation property that has complex scattering mechanism including multiple reflections through many rotor stages. However, by analyzing the periodicity and symmetry of the effects and extracting the important features, target classification can be possible [2, 7]. The reflection property of engine blades repeats every rotation of shaft and its periodicity appears as the spool rate and its multiple harmonics in JEM spectrum.
Figure 1. Simplified multiple rotor stages and blades of a jet engine.
Analyzing the reflection property in individual stages separately, the blades in a certain stage have symmetry, so the reflection property repeats whenever a single blade passes by the position of its neighbor blade in rotation. As shown in Figure 1, when the blade in position A moves to position B, the same reflection property appears repeatedly due to its symmetry so we can see the periodicity in the reflected signal. If the rotation period of the rotor isτ and the number of blades isN, the time interval moving between two blades become τ/N. We call the rate of this period as chopping frequency in the stage. Consequently, the mathematical relationship between the spool rate and the chopping frequency in each stage can be expressed as follows:
choppingFrequency =N ·spoolRate (1)
Equation (1) implies that the number of blades in a rotor stage can be estimated by extracting the spool rate and the chopping frequency of the stage from JEM spectrum. In general, jet engines have the different number of blades in each rotor stage so the blade number information in each stage can be used for engine classification.
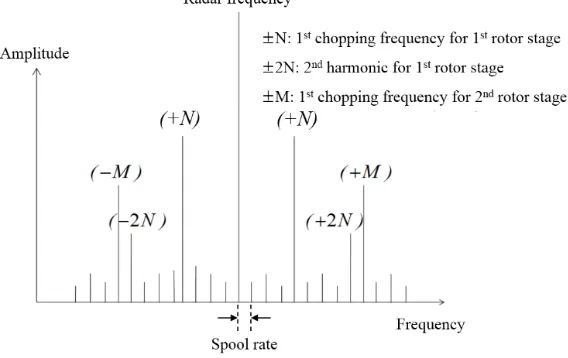
Figure 2. Typical JEM spectrum.
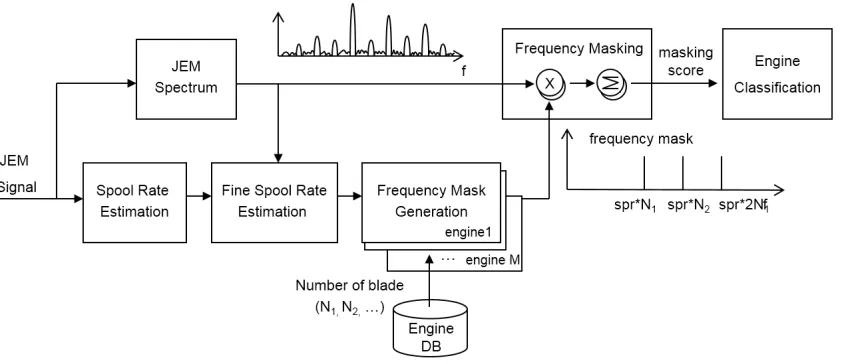
Figure 3. Target classification using JEM signal.
of blades highly depends on the accuracy of the estimated spool rate. In addition, it is more difficult and complicated to estimate the chopping frequency. The largest spectral line in JEM spectrum has the highest possibility to be the chopping frequency of first rotor stage but it is not always. It can be the multiple of the fundamental chopping frequency or the frequency component added or subtracted by inter-modulation between stages. Therefore, the logical algorithm to choose the correct chopping frequency among the harmonic lines is required but is usually complicated and complex. Even though the algorithm is optimized for a given signal DB, it cannot guarantee its performance for the other signals besides it.
Figure 3 illustrates the block diagram of the JEM classification system explained so far. In the figure, the JEM spectrum can be obtained from the Fourier transform of JEM time signal. The spectral lines in the spectrum are transformed to the blade number domain by dividing the frequency by the estimated spool rate and rounding it off to whole number. Then the number of blades is estimated by analyzing the spectral lines using the logical algorithm. Finally, the estimated number of blades is compared with that of the engine DB and the target is classified.
3. JEM TARGET CLASSIFICATION WITH FREQUENCY MASKING 3.1. Proposed JEM Target Classification System
70 Kim et al.
Figure 4. Proposed target classification system using frequency mask.
That is, if the total spectral energy at the harmonic frequencies predicted from an engine is higher than other engines, it is reasonable to recognize it as target engine. To extract the spectral components at specific harmonic frequencies from JEM spectrum, frequency mask function is used. It is constructed from the blade number information and the spool rate.
Figure 4 shows the entire block diagram of the proposed JEM classification system. The spool rate is estimated from an input JEM time signal using autocorrelation or cepstrum method [13]. The spool rate estimated from this procedure can have a certain amount of error compared to the actual one. This error can cause serious problem in calculating harmonic frequencies and it can result in performance degradation. Therefore, in this paper we propose an algorithm to precisely estimate the spool rate and its detail algorithm will be described in the following section. The process of frequency mask generation is to create the frequency mask that passes the component of chopping frequencies and their harmonics and blocks the rest of frequencies in JEM spectrum. It is constructed from the estimated fine spool rate and the blade number information of each rotor stage from DB. That is, the frequency mask is generated as follows:
freqMask(eng, f) =
1, iff =m·f1st(eng, stg), m=±1,±2, . . . , stg= 1,2, . . .
0, else (2)
where, f1st(eng, stg) denotes the first harmonic frequency, i.e., chopping frequency, at a rotor stage,
stg, of an engine, eng. The chopping frequencies are calculated from Equation (1) using the blade number information and the estimated spool rate. The frequency masks are generated for all engines in the DB. The number of stages and harmonics used in the frequency mask can be limited considering the characteristic of radar waveform and engine. The JEM spectrum is obtained from the Fourier transform of input signal and is used to perform frequency masking. The process of frequency masking is to multiply the frequency mask and the JEM spectrum and add them as shown in Equation (3). It functions to extract all the spectral components at the frequencies with weight 1 in the frequency mask. The result of frequency masking is the masking score as follow:
maskingScore(eng) =
f
freqMask(eng, f)·spectrum(f) (3)
Finally, the engine with highest masking scores is classified as the target engine for the input JEM signal.
3.2. Fine Spool Rate Estimation
except body Doppler in the spectrum is selected and let’s denote it by f0. This frequency has the highest possibility to be the first chopping frequency of the first rotor stage but it also can be its multiple. Whichever it is, the important thing is that the frequency is the multiple of the spool rate so the remainder whenf0 is divided by the spool rate, should be an integer. Of course, the spool rate estimated in the previous block has some estimation error so it may not be an integer exactly. To get an integer value, it is rounded off as follows:
N0 =round
f
0
spoolrate
(4)
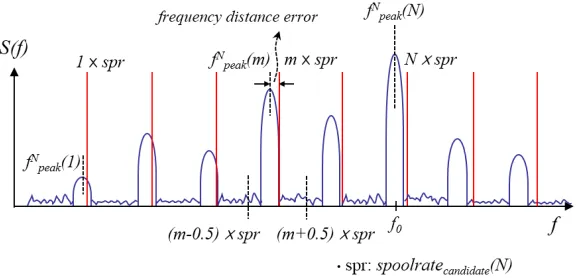
If the estimation error exceeds the maximum round-off error, 0.5, the estimated integer, N0, is not true. The problem is that we cannot guarantee that the integerN0 is correct or not. Therefore we need a method to determine if the integer is true or not and to find the true value. In this paper, we propose a method that find a precise spool rate by comparing the frequency distance error between the multiple frequencies of a candidate spool rate and the real harmonic frequencies in JEM spectrum. As shown in Figure 5, we first set the frequency points that correspond to the multiples of a candidate spool rate (red solid line in the figure) and then all of the spectral components (blue line in the figure) in the JEM spectrum are assigned to the closest frequency points. Then the frequency distance between each frequency point and the spectral components assigned to it are calculated. If the candidate spool rate is exactly same to the actual one, the frequency distance error will be the smallest value. In contrast, as the candidate spool rate is far from the real one, the error will increases. By searching the neighbor of the spool rate estimated from the previous block, we can find the precise spool rate. Since the mathematical relationship between the spool rate andf0 is an integer, we can reduce computation load by searching only for the candidate spool rates with integer relation. That is, the candidate spool rates can be restricted to several points aroundN0 as given in Equation (5). For instance, ifM set to 2, only 5 candidates are selected.
spoolratecandidate(N) = f0
N, N0−M ≤N ≤N0+M (5) If all the spectral components are used when calculating the frequency distance error, computational load will increase remarkably. Furthermore, small spectral components around the harmonics rather work as noise. Therefore, by using only the harmonic peaks for calculating the frequency distance error as shown in Figure 5, we can get better performance in computation load and accuracy. The harmonic peaks that correspond to the multiple frequencies of the spool rate can be selected as follows:
fpeakN (m) = arg
f max(S(f)),
(m−0.5)×spoolratecandidate(N)≤f, (m+ 0.5)×spoolratecandidate(N)≥f, m= 1, . . . , N (6)
72 Kim et al.
Then the sum of all frequency distance errors between the harmonic peak frequencies and the multiples of spool rate are calculated like Equation (7).
freqDistError(N) =
N
m=1 fN
peak(m)−m×spoolratecandidate(N) (7)
Finally, the precise spool rate is calculated as follows:
spoorate = f0 arg
N min(freqDistError(N))
(8)
4. EXPERIMENTAL RESULTS 4.1. Example of Target Classification
In this section, we will present the simulation result at each block of our proposed system for a given JEM signal. Figure 6 shows the spectrum of an input JEM signal. The largest spectral line is 45.62 Hz and it corresponds to the chopping frequency of an engine with 42 blades on the first rotor stage. The actual spool rate is 1.086 Hz but the spool rate estimated at the first block is 1.069 Hz, which has 1.57% of estimation error. By rounding off 42.68 (= 45.62/1.069), the estimated number of blades (or its multiple) is 43. Although the actual number of blades is 42, the integer is incorrectly estimated due to the error of the spool rate. We can get better result by using the proposed algorithm for fine spool rate estimation. The candidate spool rates within the range of ±2 around 43 are selected according to Equation (5) and Figure 8 shows the frequency distance errors calculated by Equation (7) for every candidates. In Figure 7, N0 means the previously calculated integer, 43. Since the error is smallest at
N0−1, 42, we determine that the integer, 42, is the number of blades or its multiple. Where, the newly estimated spool rate is 1.0862 Hz and it is closer to the actual spool rate, 1.086 Hz.
Figure 6. The spectrum of input JEM signal. Figure 7. Frequency distance error with respect to spool rate.
Figure 8. Frequency mask (Blade number of 42 on 1st stage and 73 on 2nd stage).
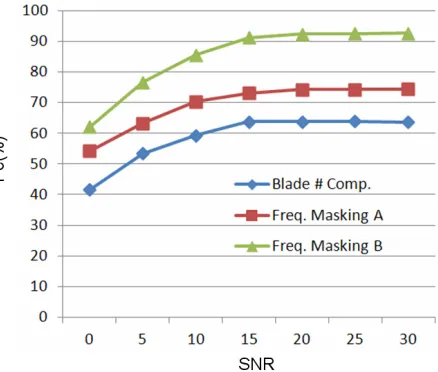
Figure 9. Masking scores for six jet engines. Figure 10. Comparison of classification rate with respect to SNR.
4.2. Classification Experiments Using Measured Signals
74 Kim et al.
Table 1. Information of the measured JEM data.
DB Freq. (Hz) Pol. Aspect angle (degree) RPM PRF (Hz)
A 10 15G 10G,
5G HH 0∼60
60, 140, 180 900, 1800, 3600
A 08 16G 8G∼16G HH 0∼60 60 1800
B 10 15G 10G,
15G HH 0∼60
60, 180
450, 900, 1800
B 08 16G 8G∼16G HH 0∼60 60 1800
Six engine models including the type A and B, are used in the engine blade DB and their first and second stage blades are used for generating frequency mask. To compare the classification algorithms, we conducted the experiments for the following three cases.
(1) ‘Blade number comparison’ is the method to classify a target by estimating and comparing the number of blades in JEM spectrum.
(2) ‘Frequency masking A’ is the method to use the proposed frequency masking scheme but not to use the fine spool rate estimation.
(3) ‘Frequency masking B’ is the method to use the proposed frequency masking scheme with the fine spool rate estimation.
Table 2 shows the experimental result for the target classification using the JEM data and the algorithms mentioned above. The proposed frequency masking B shows better performance than the blade number comparison. In the case of frequency masking A method, its performance drops seriously in data A 10 15G. It is probably because type A has a large number of blades compared with type B, so the estimation error of spool rate affects the accuracy more seriously when calculating the harmonic frequencies in frequency mask, in particular high frequency. That is, from Equation (1) we can infer that the error in calculating the chopping frequency and its harmonics increases in proportion to the number of blades for a given spool rate. Applying the fine spool rate estimation in frequency masking B, we can see that its performance increases remarkably although type B’s decreases a little bit.
Table 2. Comparison of classification rate [%].
DB Blade number
comparison
Frequency masking A
Frequency masking B
A 10 15G 77.7 29.9 85.3
A 08 16G 77.0 68.2 89.1
B 10 15G 58.6 98.2 96.0
B 08 16G 49.7 99.7 96.1
Average 65.8 74.0 91.6
for the algorithm to find the chopping frequency is completely optimized so the performance could possibly be improved by enhancing the algorithm. Therefore, through the experimental results we don’t hastily declare that the proposed method is superior to the blade number comparison method. But we can confirm that the proposed method can efficiently classify a jet aircraft without developing the complicated algorithm for estimating the number of blades itself.
5. CONCLUSION
In this paper, we propose a method to classify an aircraft with jet engine using the frequency masking of JEM spectrum. We confirm that the engine classification can be possible by comparing masking scores obtained from the masking process between JEM spectrum and the frequency mask generated from the number of blades and estimated spool rate. The proposed method shows better performance than the blade number comparison method in the classification experiment using the JEM signals measured from two fabricated engine models. In addition, by introducing the novel algorithm to estimate the precise spool rate in JEM spectrum, we can reduce the error in estimating the position of harmonic in frequency mask. In the future, the further study on the effect of different weights and the harmonics by inter-modulation in frequency mask will be conducted.
REFERENCES
1. Skolnik, M. I., Introduction to Radar Systems, 3rd edition, McGraw-Hill, 2001. 2. Tait, P., Introduction to Radar Target Recognition, IEE, 2005.
3. Yang, W. Y., J. H. Park, W. Y. Song, and N. H. Myung, “Robust and fast algorithm for estimating fundamental periodicity of jet engine modulation signals,”IET Radar, Sonar&Navigation, Vol. 10, No. 7, 1286–1294, 2016.
4. Yang, W. Y., J. H. Park, J. W. Bae, S. C. Kang, and N. H. Myung, “Automatic feature extraction from jet engine modulation signals based on an image processing method,” IET Radar, Sonar &
Navigation, Vol. 9, No. 7, 783–789, 2015.
5. Park, J. H., W. Y. Yang, J. W. Bae, S. C. Kang, and N. H. Myung, “Extended high resolution range profile-jet engine modulation analysis with signal eccentricity,” Progress In Electromagnetics Research, Vol. 142, 505–521, 2013.
6. Chadwick, J. and G. L. Williams, “Air target identification — Concept to reality,” IET International Conference on Radar Systems, 1–5, 2007.
7. Bell, M. R. and R. A. Grubbs, “JEM modeling and measurement for radar target identification,”
IEEE Transactions on Aerospace and Electronic Systems, Vol. 29, No. 1, 73–87, 1993.
8. Martin, J. and B. Mulgrew, “Analysis of the theoretical radar return signal from aircraft propeller blades,” IEEE International Radar Conference, 569–572, 1990.
9. Martin, J. and B. Mulgrew, “Analysis of the effect of blade pitch on the return signal from rotating aircraft blades,” IEE Radar 92 International Conference, 446–449, Brighton, UK, 1992.
10. Tong, C., Z. Huang, P. Yan, et al., “Studies of modulation mechanism of jet engine modulation effect,” IEEE Microwave Conference Proceedings, APMC 2005 Proceedings, Vol. 3, 2005.
11. Cuomo, S., P. F. Pellegrini, and E. Piazza, “Model validation for jet engine modulation phenomenon,”Electronics Letters, Vol. 30, No. 24, 2073–2074, 1994.
12. French, A., “Target recognition techniques for multifunction phased array radar,” Thesis for the degree of Doctor of Philosophy of the University College London, 2010.
13. Oppenheim, A. V. and R. W. Schafer,Discrete-time Signal Processing, Prentice-Hall, 1989. 14. Lim, H., G. H. Yoo, C. H. Kim, K. I. Kwon, and N. H. Myung, “Radar cross section measurements

![Table 2. Comparison of classification rate [%].](https://thumb-us.123doks.com/thumbv2/123dok_us/1983577.1262176/8.612.157.458.555.659/table-comparison-of-classication-rate.webp)