However, when a corpus includes hundreds of geographical locations from many countries, the typical user will need help to find where the places are actually located. Furthermore, for certain searches, the distribution of hits will in actual fact represent an isogloss for a particular phenomenon. This will not be visible unless the results are projected onto a map.
We have therefore chosen to enhance the corpus with maps. We have chosen to use the Google Maps API in our implementation, given its flexibility w.r.t. projecting information on the maps, their open x and the fact that they cover the whole area. We were looking at other solutions, such as the excellent free online services of the Norwegian Mapping Authority, but since they do not cover the whole Nordic area, they were not an option. in three different ways: 1) for each concordance line, a clickable information button gives geographical information about that hit, 2) the geographical distribution of all the hits are represented in one map, 3) geographical filters can be specified on the map instead of via the list of place names. The first two have been implemented, while the third option is being developed at the moment.
Option 1 gives the name of the place that particular speaker is from (and with age-group, sex, recording year). Importantly, since the place-name may not be known to the researcher, a map is also presented. Figure 1 shows an extract of the search results, with the information button on the left.
Figure 1: Some hits in the Nordic Dialect Corpus.
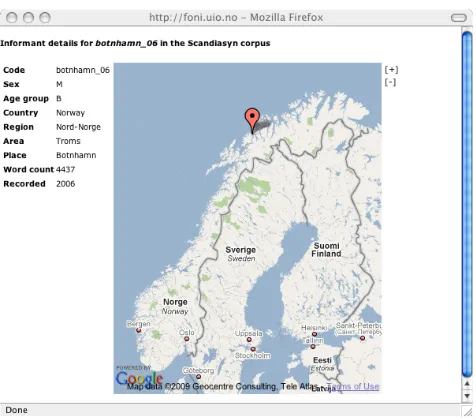
By choosing the i-button, the full information about that particular informant (the one from Botnhamn, top row) appears:
spoken language corpora. A number of universities use Glossa, due – we think – to its user-friendliness even as more and more search variables are added to it, and its easy access as a freely downloadable system.
Figure 2: Information on the informant botnhamn_06.
This way, the user can quickly determine where a particular example is from. In this case, he is from the island Senja on the coast of North Norway.
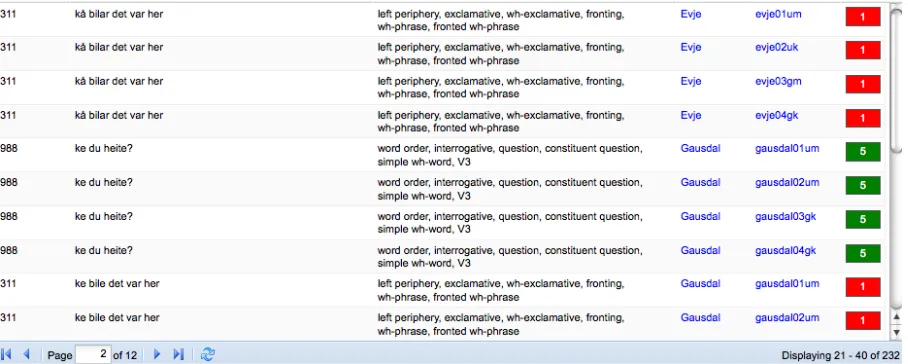
Option 2, in a corpus like the Nordic Dialect Corpus, which contains dialects from a geographically widespread area, gives interesting possibilities to see where particular phenomena occur. If the distribution is clearly geographically delimited, this will be an isogloss that is nicely illustrated on the map. For example, we can search for the negation adverb in Norway in the phonetic transcription. (The Norwegian part of the corpus is transcribed both phonetically – following the transcription standard in Papazian and Helleland 2005 – and orthographically.)
Figure 3: concordance list with map button
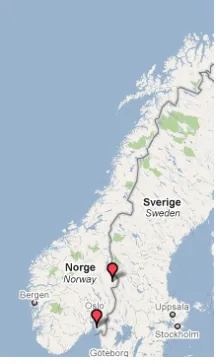
Starting with nte, we find that this is only used in two places that we have investigated; Fredrikstad and Trysil, both neighbouring Sweden. There are 34 hits in the corpus concordance.
Figure 4: Two places have negator nte.
It is not surprising that this is the area where we find it, since inte/nte is the main negation word in Swedish.
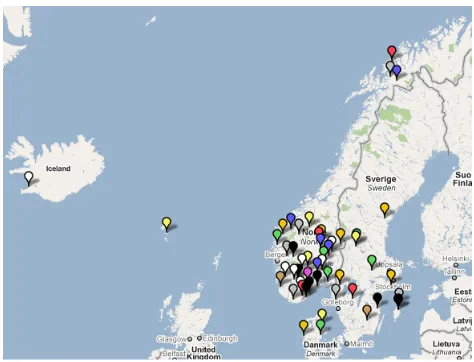
Turning now to kje, we find that this negator covers a big part of Norway (we should add that there are still parts in the white area in the middle that are not yet covered in the corpus).
Figure 5: The negator kje is almost everywhere
This result is probably somewhat surprising for many people. The negation kje (with its full form ikkje) is the one that is used in the written standard Nynorsk, which is generally considered to be close to the dialects of West Norway. We see here a much wider geographical distribution. The corpus concordance gives us 3083 occurrences, but it is the map that really shows how widespread it is.
Figure 6: The negator kke is quite rare.
The corpus concordance shows 726 occurrences of the negator kke. Given that this is the negation (with its full form ikke) that is considered the standard in Norway, it is quite interesting that it is rarer both in number and in geographical distribution.
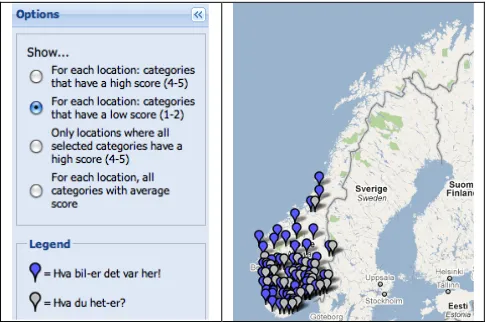
Sentence (4) is represented by blue (dark) colour, and sentence type (1) by grey (light).
Figure 8: Positive informant judgments show wide geographical distribution of the non-standard V3 question type. The exclamation type is mostly found in
the north.
We see that the sentence type exemplified in (1), which has the non-standard word-order V3, is actually accepted as grammatical, perhaps surprisingly, by informants in much of Norway.
We also illustrate option two, in figure 9, which shows where each selected sentence type has got a low score (1-2) in the questionnaire.
Figure 9: Negative informant judgments show that both the V3 question type and the exclamation type are rejected in parts of Southern Norway, with no rejections
in the north.
It is obvious that using maps to illustrate the geographical distribution of features based on answers by informants is a very useful tool that can reveal
surprising and hence new results.
4.
Comparison with other map
resources
Our language resources are not the first ones to use maps. We would like to mention the The World Atlas of Language Structures Online (WALS) (Haspelmath et al. 2008) and the Dynamische Syntactische Atlas van de Nederlandse Dialecten (DynaSAND) (Barbiers et al. 2006). Both are advanced research tools, but different from ours.
WALS presents a vast array of maps with information from languages across the world. The maps are ready-marked with codes denoting several grammatical features in a particular category, but can be combined with information on other maps. Since the information encoded in the maps come from different authors and different investigations, there is huge variation as to how many and which languages presented on a map with a particular feature. For example, the WALS map showing word order types includes information on as many as 1228 languages, while the map containing information on nominal plurality contains only 291 languages (and lack most of the Nordic ones!). The original information on the linguistic features comes from a variety of written linguistic literature.
The DynaSAND also presents many possibilities for features to be combined and shown in maps. Here the information is on Dutch dialects in Netherlands and Belgium. The Dutch language data all come from the same research project, so here all places have been tested w.r.t. the same features.
The maps we have shown from the Nordic Syntactic Judgments Database can, like those of WALS and DynaSAND, be generated from all the data in the database, and with any combination is possible. In addition, the Nordic Syntactic Judgments database can show negative results as well. This is a major difference between our maps and the WALS ones. There, if a feature is not marked on a map, one does not know whether the reason is that the feature does not exist in that anguage, or whether it has not been investigated there. The DynaSAND maps can show negative results for some test sentences, however, not all test sentences were given in all regions, which limits this option somewhat (thanks to Jan Pieter Kunst, p.c. for this information). The possibility of showing where negative values are given, together with the fact that all features have been tested everywhere (or will be when the database is finished) give a very good picture of the distribution of a certain phenomenon.