DOI : https://doi.org/10.32628/CSEIT19564
Prediction of Surface Runoff Changes with Landuse-Land Cover Impact Using
Remote Sensing Data and GIS Based ARcSWAT Model of Indrayani Watershed,
Maharashtra, India
Narasayya Kamuju*1
*1Assistant Research Officer, CWPRS, Pune, Maharashtra, India
ABSTRACT
Modern Mathematical Models have been developed for studying the complex hydrological processes of a watershed and their direct relation to weather, topography, geology and land use. In this study the hydrology of Indrayani watershed located in Indrayani River basin at the North-East of Pune is modelled, using the Soil and water Assessment Tool (SWAT). It aims to simulate the surface runoff using a Temporal resolution of 10 years LandUse-LandCover (Lu-Lc) maps of 2003-04 and 2013-14. The ArcSWAT interface implemented in the ArcGIS software was used to delineate the study area and its sub-components, combine the data layers and edit the model database. The ArcSWAT model predicted Indrayani watershed hydrologic component of Surface Runoff with weather components of precipitation and temperature of 25 years along with Food and Agriculture Organisation soil layer. The SWAT model run in 2 Phases with Lu-Lc of 2003-04 as Phase-I and also model run using 2013-14 Lu-Lc as phase-II. The runoff predicted within a 10 year temporal changes of Lu-Lc, 919 mm of Surface Runoff obtained with Lu-Lc of 2003-04 and 767 mm of Surface Runoff predicted from 2013-14 Lu-Lc map layer respectively. The higher runoff predicted with Lu-Lc 2003-04, as such it has higher area of Agricultural land with lower urban area covered and less water bodies than 2013-14 Landuse-Lancover classes.
Keywords : Runoff, SWAT, GIS, HRU, DEM
I. INTRODUCTION
Water is an essential element for survival of living things. It is vital factor for economic development and augmenting growth of agriculture and industry especially in the perspective of rapidly increasing population and urbanization. many zones face scarcity of freshwater or subject to pollution. Thus the availability and the sustainable use of the water resources become the core of the local and national strategies and politics in these regions. To deal with water management issues, one must analyse and quantify the different elements of hydrologic processes are taking place within the area of interest. Obviously, this analysis must be carried out on a watershed basis because all these processes are taking
place within individual micro-watersheds. Hydrological processes and their local scattering have always direct relation to weather, topography, geology and landuse of watershed in addition to the impact of human activities. A watershed is comprised of land areas and channels and may have lakes, ponds or other water bodies. The flow of water on land areas occurs not only over the surface but also below it in the unsaturated zone and further below in the saturated zone, singh and Frevert [1].The use of a watershed model to simulate these processes plays a fundamental role in addressing a range of water resources and environmental and social problems.
capabilities has encouraged and improved the expanded use of watershed models worldwide. GIS is a suitable tool for the efficient management of large and complex database and to provide a digital representation of watershed characteristics use in hydrologic modelling. It has added confidence in the accuracy of modelling by providing more practical approach toward the watershed conditions, defining watershed characteristics, improving the efficiency of the modelling process and ultimately increasing the estimation capabilities of hydrological modelling, Bhuyan et al.[2].The objective of modelling Indrayani watershed, is to set up and simulate the adapted model in order to simulate the functioning of the entire area and therefore predict its response to phenomena and risks it confronts such as erosion, inundations, drought, and pollution. Specifically, the purpose is to estimate the Surface Runoff at the outlet of the Indrayani watershed in order to develop an efficient decision framework to facilitate, plan and assess the management of watershed.
In this study, the GIS based watershed model, Soil and Water Assessment Tool (SWAT) was applied. SWAT is a river basin or watershed scale model which has the capability to simulate both the spatial heterogeneity and the physical processes occurring within smaller modellig units, known as hydrologic response units (HRU) for the sustainable planning and management of surface water resources of rivers. SWAT has been adjudged by researches as computationally efficient in its prediction, Neitsch et al. [3].It has a reliability which confirmed in several areas around the world. SWAT model was applied in large scale to evaluate the hydrological processes in a mountain environment of Upper Indus River Basin by Khan et al. [4]and in other regions in Asia by Nasrin et al [5] and Cindy and Koichiro [6]. It was tested and used in many regions of Africa by Fadil et al. [7],Ashagreet al. [8] and Schuol et al. [9]. It also applied to simulate St.Joseph River watershed in US by Kieser et al. [10]. SWAT model was used successfully to estimate the water balance
components in South Eatsern Ethiopia by Shawul et al. [11] and in Nigeria by Adeniyi et al. [12].
II. METHODS AND MATERIAL
Soil and Water Assessment Tool (SWAT) is applied to predict the hydrologic component of Surface Runoff of Indrayani watershed in Indrayani River basin. The methodologies used for this study include a description of the study area, hydrological model and the special dataset which used in the simulation are given in the following sections with details.
Description of the study area
Figure 1. Location Map of Indryani Watershed
Description of SWAT model
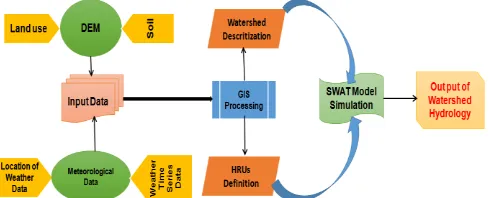
SWAT is a river basin or watershed, scale model and it is a continuous time model that operates on daily time steps and uses a command structure for routing runoff and chemical through watershed. It developed by Agricultural Research Services of United States Department of Agriculture to predict the impact of land management practices on water, sediment, and agriculture chemical yields in large and complex watersheds with varying soil, land use and management conditions over long periods of time, Arnold et al. [13].ArcSWAT (Arc GIS-SWAT) is the latest available version which is used as an interface between ArcGIS and the SWAT model. ArcSWAT version which was built for ArcMap 10.1 is used in this study, Winchell et al. [14].Spatial data (DEM, Soil and Landuse-Landcover) are used in the processing phase and fed into the SWAT model through the interface. The soil and land cover make important responding units and the same is accomplished by SWAT model by subdividing the watershed into areas having unique land use and soil combination which are called Hydrological Response Units (HRU) during the process of runoff generation. SWAT requires an assortment of input data layers for model setup and watershed simulations. The topography of watershed is defined by a Digital Elevation Model (DEM). It is used to calculate sub-basin parameters such as slope and to define the stream network. The soil data are required to define soil characteristics and attributes. The land-cover data provide vegetation information on ground and their ecological processes in lands and soils. Climate, precipitation and stream flow data are sourced and prepared according to SWAT input requirements. The Figure 2shows the components of SWAT model including input, output, the spatial datasets, and GIS parts and summarized its methodology.
Figure 2. Materials used and Methodology applied in SWAT Model
The hydrologic cycle of the SWAT model is based on the water balance equation, which considers the unsaturated zone and shallow aquifer above the impermeable layer as a unit. Eq. (1) is the important equation to predict the hydrology of watershed used in the SWAT model.
SWt = 𝑆𝑊𝑜+ ∑𝑖=1𝑡 (𝑅𝑑𝑎𝑦− 𝑄𝑠𝑢𝑟𝑓 − 𝐸𝑎− 𝑤𝑠𝑒𝑒𝑝− 𝑄𝑔𝑤 )𝑖 Eq.(1)
where t is the time in days, SWt and 𝑆𝑊𝑜 are the final and initial soil water content respectively (mm), Rday is amount of precipitation on day i (mm), Qsurf is the amount of surface runoff on day i(mm), Wseep is the amount of water entering the vadose zone from the soil profile on day i (mm) and Qgw is the amount of return flow on day i (mm).
The estimation of surface runoff can be performed by the model using the Soil Conservation Service (SCS) curve number method, Arnold et al. [13]. This method is widely used for the prediction of approximate amount of runoff from a given rainfall event. It is mainly based on the soil properties, land use and hydrologic conditions. The SCS curve number equation is
𝑄𝑠𝑢𝑟𝑓 =
( 𝑅𝑑𝑎𝑦−0.2 𝑆) 2
( 𝑅𝑑𝑎𝑦+0.8 𝑆) Eq.(2)
S = 25.4(1000
𝐶𝑁 − 10) Eq.(3)
where S is drainable volume of soil water per unit area of saturated thickness (mm/day); CN is curve number. SCS defines three antecedent moisture conditions; I-dry (wilting point), II – average moisture and III – wet (field capacity). The moisture condition I curve number is the lowest value the daily curve number can assume in dry conditions. The curve numbers for moisture conditions I and III are calculated with the Eqn. (4) and (5), respectively.
CN1 = CN2 –(100−𝐶𝑁2+ 𝑒20 (100−𝐶𝑁2)[2.533−0.0636∗(100−𝐶𝑁2)]) Eq. (4)
CN3 = CN2 * 𝑒[0.00673(100−𝐶𝑁2)] Eq. (5) where CN1 is the moisture condition I curve number, CN2 is the moisture condition II curve number, and CN3 is the moisture condition III curve number. Lateral flow is predicted by:
qlat = 0.024 (2𝑆∗ 𝑆𝐶 sin ∞) 𝜃𝑑𝑙
where qlat = lateral flow (mm/day); S = drainable volume of soil water per unit area of saturated thickness (mm/day); SC = saturated hydraulic
conductivity (mm/h); L = flow length (m), α = slope of the land, θdl = drainable porosity.
1) Creation of database
The simulation of the water balance of an area by SWAT model requires a large amount of special and time series data sets in order to establish the water balance Eq. (1). The main set of data used are briefly explain below.
1.1 Special datasets
The topography, Landuse-Landcover and soil characteristics are spatial datasets, which defines the land system of any area and the most requirement of the hydrological model. The input part of SWAT
model includes a section from land system in the form of DEM, Landuse-Landcover and soil.
1.2 Digital Elevation Model (DEM)
The SRTM DEM of 90 m resolution (HTML: CGIAR-CSI) [15] was processed for the extraction of flow direction, flow accumulation, stream network generation and delineation of the watershed and sub-basins as shown in Figure 3. The topographic parameters such as terrain slope, channel slope or reach length were also derived from the DEM. The present study area of Indrayani watershed with an elevation ranging from 560 m (Indrayani outlet) to 712 m at the Andhra lake , 657 m at Shirota Lake locations.
Figure 3. DEM of Indrayani Watershed
The whole watershed is segmented in a total number of thirteen (13) sub-basins developing on topographic characteristics.
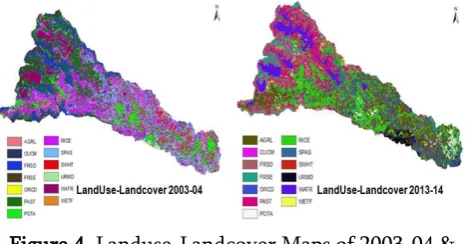
1.3 Landuse –Landcover (Lu-Lc)
covered 133 km2, water bodies (WATR) are 50 km2 and lowest urban area (URMD) covered as 10 km2.
Figure 4. Landuse-Landcover Maps of 2003-04 & 2013-14
The Lu-Lc map of 2013-14 have similar classes, the
major portion of area ‘AGRL’ class covered an area of
423 km2. The other class of ‘AGRC’ covered an area of 197 km2 and forest classes are covered 135 km2, water bodies are 75 km2 and lowest area of urban class covered 25 km2. The Landuse classes were converted from original land use classes to SWAT classes and defined using a look-up table for both Lu-Lc layers.
1.4 Soil Data
The soil map was obtained mainly from the United National Food and Agricultural Organization (HTML: FAO-AGL,2003) [17]. The FAO regional scale soil vector maps were used where each cartographic unit was associated with one or two delineations corresponding to subsoil groups of USDA. Due to soil limitations, of USA soils were compared with the watershed area to use their properties to define HRUs. 3 varieties of soils delineated in the Indrayani watershed, which covered 2% of Ne56-2b, 84% of Hh11-2bc and 14% of Vc43-3ab as shown in Figure 5 Landuse-Landcover classes and soil types were overlaid to define the Hydrologic Response Units (HRUs) for each of the sub-watersheds for the SWAT model.
Figure 5. FAO-Soil verities covered in Indrayani Watershed
Subdividing the watershed into areas having unique land use and soil combinations enables the model to reflect differences in Evapotranspiration (ET) and other hydrologic conditions for different Land covers/crops and soils. Runoff is predicted separately for each HRU and routed to obtain the total runoff for the watershed. This increases the accuracy of load predictions and provides a much better physical description of the water balance, Winchell et al. [14].
2) Temporal data sets
The climate data are required by SWAT to provide the moisture and energy inputs that controls the water balance and determine the relative importance of the different component of the hydrologic cycle. Rivers in the hydrological regimes may differ significantly in their runoff response to changes in the driving variables of temperature and precipitation.
2.1 Meteorological Data
fit into the model input format using weather generation tools from SWAT web site.
III.MODEL APPLICATION-RESULTS & DISCUSSIONS
The input data prepared in proper format for application of ArcSWAT model, the modelling performed in 2 phases. Phase-I model run with landuse-landcover layer of 2003-04 and Phase-II model run with landuse-landcover layer of 2013-14.
Figure 6. SWAT Model Out-Put of Hydrologic cycle components of Indrayani watershed for Phase I & II
The entire model run results were of all hydrologic parameters illustrated in the form of figures as shown in Figure 6 for both the phases.
The figures shown that the input component of precipitation was 1920.6 mm. The major loss of PET was 148mm with Lu-Lc map of 2003-04 and 1574.7 mm with Lu-Lc map of 2013-14. The average curve number for both Landuse-Landcover maps not shown much difference. The percolation to shallow aquifer for Lc map of 730.94 mm and for 419.82 with Lu-Lc map 2013-14 mm. The lateral flow obtained 40.74 mm and 30.12 mm with Lu-Lc map of 2003-04 and 2013-14 respectively. The recharge to deep aquifer observed 36.55 mm and 20.99 mm in Phase-I & II consecutively. As a result of all losses the return flow was obtained as 686.95 mm and 364.02 mm in both
phases. After all losses with due precipitation the higher Surface Runoff of 919.56 mm predicted with Lu-Lc map of 2003-04 and 767.74 mm obtained with Lu-Lc map of 2013-14. It is observed that the recharge to shallow and deep aquifers was higher in Phase-I, also the Surface Runoff of 152 mm obtained higher than phase-II. It is also observed that, the PET was higher than the surface runoff in both Landuse-Landcover phases.
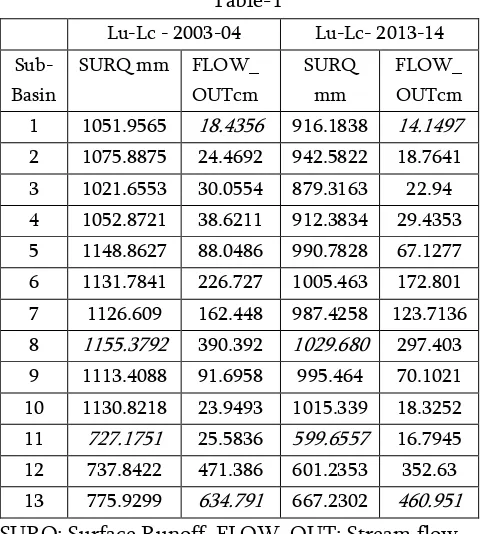
The whole Indrayani watershed divided into 13 sub-basins. The Table 1 illustrates the Surface Runoff (mm) in each sub-basin and Flow_out (cm) in reach passing through the relevant sub-basin as shown below.
Table-1
Lu-Lc - 2003-04 Lu-Lc- 2013-14
Sub-Basin
SURQ mm FLOW_ OUTcm
SURQ mm
FLOW_ OUTcm 1 1051.9565 18.4356 916.1838 14.1497
2 1075.8875 24.4692 942.5822 18.7641 3 1021.6553 30.0554 879.3163 22.94 4 1052.8721 38.6211 912.3834 29.4353 5 1148.8627 88.0486 990.7828 67.1277 6 1131.7841 226.727 1005.463 172.801 7 1126.609 162.448 987.4258 123.7136
8 1155.3792 390.392 1029.680 297.403
9 1113.4088 91.6958 995.464 70.1021 10 1130.8218 23.9493 1015.339 18.3252
11 727.1751 25.5836 599.6557 16.7945
12 737.8422 471.386 601.2353 352.63 13 775.9299 634.791 667.2302 460.951
SURQ: Surface Runoff, FLOW_OUT: Stream flow
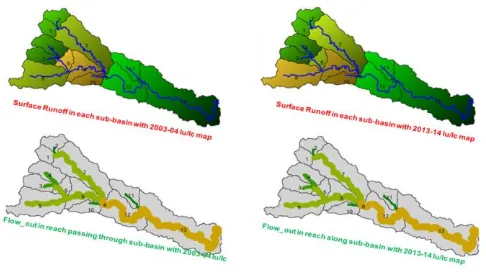
sub-basin no.8 delivered highest surface runoff, and the other of 6th, 9th and 10th sub-basins were delivered high runoff comparatively with remaining sub-basins in the watershed. The Flow_out delivered high through Sub-basin no.13, as such that the out let of Indrayani watershed place at the end of this sub-basin. The tabular results shown in the form of Figure 7.
Figure 7. Surface Runoff & Flow_out with 2 different Landuse-Landcover
IV.CONCLUSION
Watershed models have become a main tool in addressing a wide spectrum of environmental and water resources problems. The Soil and Water Assessment Tool (SWAT) has been well documented as an effective water resources management tool. In this study the ArcSWAT interface implemented in the ArcGIS software was used in order to model the hydrology of Indrayani watershed area. The main objective of this study is to identify temporal changes of Landuse-Landcover impact in prediction of surface runoff. The SWAT model run in 2 phases with landuse-landcover map of 2003-04 as Phase-I and with Landuse-Landcover map of 2013-14 consider as Phase-II. As a result, the Surface Runoff predicted in Phase-I as 919 mm at the outlet of Indrayani watershed and Surface Runoff in phase–II as 767 mm. It is observed that the landuse-landcover map of 2003-04 has higher area covered with AGRL, AGRC and lower areas covered with urban and water bodies. It is one of the reason to get higher runoff in Phase-I scenario. In Phase-II, the landuse-landcover with higher water
bodies and more urban area covered in the Indrayani watershed, it is one of the cause to predict lower Runoff obtained at the outlet of the watershed. The performance of the model can be enhanced furthermore by integration of some other climate data such as solar radiation, relative humidity and wind speed. The calibrated model can be well used to understand and determine the different watershed hydrological processes that help in optimal utilization of dam reservoir water. A future understanding and determination of the different watershed hydrological processes that help in optimal utilization of the dam.
V. REFERENCES
[1]. V. P. Singh, D.K Frevert, Mathematical Modelling of Watersheds Hydrology. Chapter 1, in: Mathematical Models of Small Watershed Hydrology and Applications, Water Resources Publications, Littleton, Colorado, 2002,pp. 1-3. [2]. S.J. Bhuyan, J.K. Koelliker, L.J. Marzen, iJ.R.
Harrington, An integrated approach for water quality assessment of kansa watershed, Environ. Model Softw.18 (2003) 473-484.
[3]. S.L.Neitsch, J.G.Arnold, J.R. Kiniry, J.R.Williams, Soil and Water Assessment Tools theoretical documentation version. GrassLand, Soil and Water Research Laboratory, Agricultural Research Service 808 East Blackland Road, Temple, Texas 76502; Blackland Research Centre, Texas Agricultural Experiment Station 720, East Blackland, Texas USA, 205.
[5]. Z.N. Asrin, G.A. Sayyad, S.E. Hosseini, Hydrological and sediment transport modeling in maroon dam catchment using soil and water assessment tool (SWAT), Int.J. Agron. PlantProd. 4 (10) (2013) 2791-2795.
[6]. S Cindy, O. Koichiro, Dam construction impacts on streamflow and nutrient transport in kase River Basin, Int. J. CivilEnviron.Eng. IJCEE-IJENS 12 (13) (2012)
[7]. A. Fadil, Hassan Rhianane, K. Abdelhadi, K. Youness, Omar A. Bachir, Hydrologic Modelling of the bouregreg watershed (Morocco) using GIS and SWAT model, J. Geogr. Inform.Syst. 3 (2011) 279 – 289.
[8]. B.B. Ashagre, SWAT to Identify Watershed Management Options: Anjeni Watershed, Blue
Nile Basin, Ethiopia, Master’s Thesis, Cornell
University, New York, 2009.
[9]. J. Schuol, K.C. Abbaspour, R. Srinivasan, H. Yang, Modeling Blue and green water availability in Africa at monthly interval sand sub basin level, Water resource. Res. 44 (2008) 1-18.
[10]. Keiser& Associates for Environmental Science and Engineering, SWAT Modeling of the St. Joseph River Watershed, Michigan and Indian, Kieser & Associates Michigan Ave., Suite 300, Kalamazoo Michigan 49007, 2005.
[11]. A.Shawul, T. Almirew, M.O. Dinka, Calibration and validation of SWAT model and estimation of water balance components of Shaya mountainous watershed , Southern Ethiopia, Hydrol. Earth Syst. Sci. Discuss 10 (2013) 13955-13978 , http://dx.doi.org/10.194/hessd-10-13955-2013.
[12]. G.A. Adeniyi, F.S. Bolaji, W.S. Adebayo, O.D. Michael, Validation of SWAT model for prediction of water yield and water balance: case study of upstream catchment of Jebba Damin Nigeria, World Acad. Sci. Eng. Technol. Int.J.Phys.,Nucl.Sci.Eng.8(2) (2014) 57-63.
[13]. J.G. Arnold, R. Srinivasan, R.S. Muttiah, J.R. Williams, Large area hydrologic modelling and assessment – Part1: Model development, J. Am. Water Resources. Assoc. 34 (1) (1998) 73-89. [14]. M. Winchell, R. Srinivasan, M. Di Luzio, J.G.
Arnold, ArcSWAT 2.3.4 Interface for SWAT 2005: User's Guide, Version, September 2009, Texas Agricultural Experiment Station and Agricultural Research Service- US Department of Agriculture, Temple, 2009.
[15]. CGIAR-CSI, The CGIAR Consortium for Spatial Informationhttp://srtm.csi.cgiar.org/SELECTIO N/inputCoord.asp (accessed 10.08.2019). [16]. Bhuvan-Indian Geo-platform of ISRO,
https://bhuvan-app1.nrsc.gov.in/thematic/thematic/index.php (accessed 15.08.2019).
[17]. FAO-AGL, United Nation Food and Agricultural
Organization, 2003
http://www.fao.org/ag/agl/agll/wrb/soilres.stm# down (accessed 20.08.2019)
[18]. NASA_POWER Data
https://power.larc.nasa.gov/data-access-viewer/ (accessed 03.09.2019)
Cite this article as :