CSEIT172533 | Received : 08 Sep 2017 | Accepted : 14 Sep 2017 | September-October-2017 [(2)4: 158-162]
International Journal of Scientific Research in Computer Science, Engineering and Information Technology © 2017 IJSRCSEIT | Volume 2 | Issue 5 | ISSN : 2456-3307
158
Improving the Performance of Database Applications by using
Black Box Regression Testing
Chatla Vidyanand
*1, G. Ramesh
2*1
Computer Science and Engineering (SE), JNTU College of Engineering, Ananthapuram, Andhra Pradesh, India 2
Lecturer, Department of Computer Science and Engineering, JNTU College of Engineering, Ananthapuramu, Andhra Pradesh, India
ABSTRACT
Cluster analysis means placing of the similar set of objects into one form (group) and the dissimilar into another form (group). Where it groups the objects based on the values which will be mentioned at the time of grouping of objects. Clustering is mainly useful for the data summarization and the other purposes. Regression tests, which provides the deviations (differences between two system versions), which may be due to the faults of regression or changes. To analyze the all deviations within the dataset, efficiently it would be difficult to the tester. So placing the similar objects, deviations, meaningful groups of objects that share common characteristics, play an important role in how people analyze and describe the data about the particular cluster. We focus our work on a common type of software system: database applications. Tax Accounting System, Where deviations are dividing objects into groups (clustering) and assigning particular objects to these groups (classification) and also providing the relationship between the clusters and the deviations. Clustering will helps by grouping them, which means each group contain the changes in the particular groups or the another group. Because it is unlikely that analyze which database application has high rate of deviation on year by year so that reason get statistics for future analysis. And computation complexity process is also decreased.
Keywords: Regression Testing, Clustering, Deviation Analysis
I.
INTRODUCTION
Regression tests, provides the deviations (differences between two system versions), which may be due to the faults of regression or changes. To analyze such deviations efficiently, it would be difficult to the tester. We use Clustering, it helps by grouping the deviations based on the database manipulations, which means each cluster contains the changes in the particular deviations. Because it is unlikely that a general solution to the above problem can be found and work is performed on a common type of software system: database applications.
Clustering divides the similar groups into one cluster and another in to another cluster which determines to improve the performance of the tester by having the clear idea of the deviation value, the contrast between gatherings, the better or more particular the bunching. To provide bunches, we ought to have the potential to split the likeness and disparity between the articles.
Regular items ought to be set in the one bunch, and unique articles in various groups.
All of the methodologies used in the clustering, which use the deviations values as the main point for dividing of clusters upon the set of objects, clustering mainly uses the correlation between the objects where correlation helps to differentiate same cluster one group and the another one in different cluster.
The goal of this paper is to identifying the relationship between the deviations and the clusters which helps for the tester to easily identification of the deviations with in the dataset.
II.
RELATED WORK
Though automated deviation analysis helps a great deal, the tester still has to inspect deviations to determine their cause, and this is a manual, time consuming activity. The number of deviations typically varies with the size of the test suite and the scope of the changes in the particular release under test. Later, the uncovered and clustering are recovered by using the context information.
In [1], Regression testing, involved during the development of the software, where it plays the important role.it specifies the changes that are occurred during the software maintenance .it simply checks the functionality of the software before and the after software tested. Initially it checks the checks the test suite. Where test suite consists of the number of test cases with in the test suite. It checks for the absolute test cases and then perform the regression test selection then perform the augmentation of test cases and minimizes the number of the test cases inside the experiment lastly organizes the test suite for the advancement of the test cases. So regression plays an important role in the development of the software.
In [2], DART (Database Regression Testing). It checks the functionality of the database application. Working process of the DART methodology, initially define the test configuration and then create the domain model, and the test data execute the framework under test two times, one with unique variant of the framework, and another with changed rendition of the framework. Then the difference is observed to check whether it is due to valid change or a regression faults and analyzes the deviations if the faults persist then the reports errors , if the there is no faults the update the baseline of the deviations .
In [7], CTE-XL (Classification Tree Editor –Extended Logics), is a tool which helps for the classifications of the property values, which means that it initially classify the model properties values. Suppose for example consider having of the data values ranging from 10 -100, it divides the data values based on the classification. Which means it partitions the data values 10-50 as one classification and the remaining as another classification. In the in the tree manner, where the user can easily identify the values which in the dataset, it provides the classification for the every
attribute values in the dataset, where it is a purely functional based method, it doesn’t check the behavior of the modules. It simply classify the dataset values upon the user specification. If any fault occurs it easily identifies the sort of the classification the error has grouping based technique to recognize fortuitous rightness. The key method of reasoning behind this methodology is that experiments in a similar group have comparable practices. Therefore, when all the test cases are executed in a cluster which having failed test cases, is highly effect able to the particular program. Experimental results provides the clean coverage based techniques covering of all test cases and providing the faulty test case in order to rectify them easily identified, So coverage based techniques improves the tester. Here used the, clustering based prioritization, and support our effort with Average Percentage of Fault Detection (APFD) measure which coverages all the faults within the dataset. It allows us to show the presence of having fault within the data. It provides results on the scalability potential within the cluster approach.
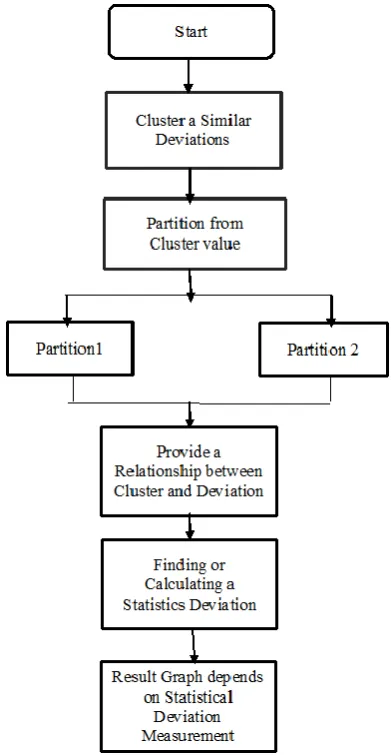
The methods involved are the load dataset, clustering, partitioning, and graphs. The proposed scheme diagram shown in Fig. 1. The diagram of proposed scheme is explained in detail in the proposed scheme.
III. PROPOSED SCHEME
3.1. Load dataset
• The File Upload field allows users to upload a file with their form submission. You may limit what file types a user may upload via the upload button Welcome to the File Upload Control. This page is for uploading images and other media files to in our project. When the upload button is pressed it prompts to enter the dataset that has to perform the operations within the method. Please ensure you understand copyright and the image use policy before proceeding. The datasets should be collected from the database application.
• The collected dataset should contain the real time results of the Database Application Test distance, throughput and the performance, tax category and tax percentage.
3.2. Clustering similar deviation
After the Load a Dataset then Perform Clustering a Same Group of Database Application Because Of its Used to find a deviation depends on year. Clustering is an important thing because user can view the Number of database application and also its deviation. Clustering is used for the arranging of the objects, where the same group of objects into one cluster and the dissimilar group of objects into another cluster. It makes the effective for the tester easily identification of the similar objects. The Clustering perform with deviation of tax accounting System. Deviation is calculated based on the distance value, where the distance is calculated as:
DISTANCE= TAX PER VALUE-HEADNODE = SQUAREROOT (FINAL VALUE)
Clustering uses the minimax algorithm, it specifies the decision rule used in game theory and decision theory and soon. For minimizing the possible loss for the worst case scenario.
3.1.Partitioning
In partitioning a Depends on clustering a similar deviation data. Partitioning take for finding a differentiation between collections of clustered data.
In partitioning, dividing of the cluster values dataset in to groups, based on the distance value. After partitioning of the whole dataset values into two groups
or partitions, then we are providing the relation between the clusters values and the deviations.
Partition mainly taken for differentiation and find a value get high tax value.
Figure 1. Flow chart of proposed scheme.
3.2.Statistical Analysis
Statistical Analysis taken from Calculated deviation average value or maximize value .These can easily find out a tax accounting System has high tax deviation on year by year. Here we find relation with Clustered value with deviations.
3.3. Graph
Graph is used for representing of the data in the pictorial manner, instead of the whole values within dataset. Here used the Cartesian coordinate system, where the graph is arranged in the two measurements or values or axis. One type will be the vertical hub and another will be even pivot, both the lines meet in the left corner of the chart.
Graph represents the statistics values are arranged in the yearly manner for the whole tax category values which are in the account statistics category values in the dataset. In our system the result graph shows a relationship between clustered deviation values and also statistical analysis of all tax category deviations. In that value easy to find which tax statics has high deviation on year by year.
IV.
EXPERIMENTAL RESULTS
In experimental results, the dataset are taken from the Indian tax accounting referred by UCI. Where the dataset consists of an individual tax percentage of a different fields (agribusiness, food processing, retail trade etc.,) of data. Initially loading of a dataset, it produces the number of fields and the execution time. Each category shows the in which field the dataset is taken from and the percentage of particular tax category and the performance and throughput of the particular tax category. Here the dataset values are taken from the real time, based on the dataset values, executed steps in order to show that how the tester can improve the execution time of the database applications.
Figure 2. Sample Dataset
Clustering is performed, after the dataset is loaded. Which shows the similar deviations in ascending order within the dataset which were loaded (tax stat values
having of the similar values are placed in the ascending ordered based on the values). Clustering uses the minimax algorithm.
Figure 3. Clustering values
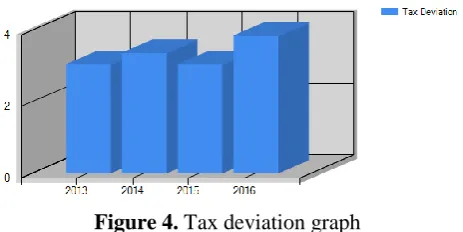
Then partitioning of the dataset in to two groups based upon the distance value, providing the relationship between the cluster and deviation and then perform the statistical deviation of the dataset. Where it shows the overall tax deviations for the dataset and it represent the graph which helps for the tester easily understanding of the tax deviation of the given dataset. The results are shown below.
Figure 4. Tax deviation graph
Finally, the tester can easily identify the deviations with in the dataset, which helps for improving the performance of the tester.
V.
CONCLUSION
and new values of the fields. Find a tax deviation has deviations highly or any other by statistical deviation result and provided a relationship with cluster and deviation then generate results. These result analyze from all the tax analyze deviations.
VI.
REFERENCES
[1]. "Retesting software during development and maintenance," M. Harrold and A. Orso, in Proc. Frontiers of Software Maintenance, 2008(FoSM 2008), 2008, pp. 99-108.
[2]. R. Carlson, H. Do, and A. Denton, "A clustering approach to improving test case prioritization: An industrial case study," in Proc. 2011 27thIEEE Int. Conf. Software Maintenance (ICSM), 2011, pp. 382-391.
[3]. S. Yan, Z. Chen, Z. Zhao, C. Zhang, and Y. Zhou, "A dynamic test cluster sampling strategy by leveraging execution spectra information, "in Proc. 2010 3rd Int. Conf. Software Testing, Verification invalidation (ICST), 2010, pp. 147-154..
[4]. S. Yoo, M. Harman, P. Tonella, and A. Susi, "Clustering test cases to achieve effective and scalable prioritisation incorporating expert knowledge," in Proc. 18th Int. Symp. Software Testing and Analysis Ser. ISSTA'09, New York, NY, USA, 2009, pp. 201-212.
[5]. P. G. Sapna and H. Mohanty, "Clustering test cases to achieve effective test selection," in Proc. 1st Amrita 2010, pp.15:1-15:8...
[6]. S. Yoo and M. Harman, "Regression testing minimisation, selection and prioritisation: A survey," Softw. Test., Verif., Rel., vol. 22, no. 2,pp. 67-120, Mar. 2012.