Scholarship@Western
Scholarship@Western
Electronic Thesis and Dissertation Repository
7-2-2014 12:00 AM
Effect of Nozzle Geometry on Jet Bed Interaction: Experiments
Effect of Nozzle Geometry on Jet Bed Interaction: Experiments
with Commercial Scale Nozzles and Eroded Nozzles
with Commercial Scale Nozzles and Eroded Nozzles
Nicholas A. ProciwThe University of Western Ontario
Supervisor Dr. Cedric Briens
The University of Western Ontario Joint Supervisor Dr. Franco Berutti
The University of Western Ontario
Graduate Program in Chemical and Biochemical Engineering
A thesis submitted in partial fulfillment of the requirements for the degree in Master of Engineering Science
© Nicholas A. Prociw 2014
Follow this and additional works at: https://ir.lib.uwo.ca/etd
Part of the Petroleum Engineering Commons, and the Transport Phenomena Commons
Recommended Citation Recommended Citation
Prociw, Nicholas A., "Effect of Nozzle Geometry on Jet Bed Interaction: Experiments with Commercial Scale Nozzles and Eroded Nozzles" (2014). Electronic Thesis and Dissertation Repository. 2424.
https://ir.lib.uwo.ca/etd/2424
This Dissertation/Thesis is brought to you for free and open access by Scholarship@Western. It has been accepted for inclusion in Electronic Thesis and Dissertation Repository by an authorized administrator of
EXPERIMENTS WITH COMMERCIAL SCALE NOZZLES AND ERODED NOZZLES
by
Nicholas Prociw
Graduate Program in Chemical and Biochemical Engineering
A thesis submitted in partial fulfillment of the requirements for the degree of
Masters of Engineering Sciences
The School of Graduate and Postdoctoral Studies The University of Western Ontario
London, Ontario, Canada
ii
Abstract
Liquid injection into fluidized bed reactors has several industrial applications, such as Fluid
Catalytic Cracking, Gas Phase Polyethylene production, and Fluid Coking. High quality
liquid distribution is essential to maximize the yield of desirable products, and minimize
agglomeration.
The objectives of this thesis are: to develop a method that measures the rate of liquid
released from agglomerates formed as a result of liquid injection into a fluidized bed; to use
this method to determine the effect of internal erosion on nozzle performance; and to
compare the performance of current commercial spray nozzles to nozzles with altered
geometries. To achieve these objectives, gas-atomized liquid sprays were produced inside a
large scale fluidized bed using commercial scale nozzles. Liquid distribution was monitored
by measuring the conductance of the fluidized bed. Results indicate that the altered geometry
caused by erosion may enhance liquid distribution among the fluidized bed particles and
increase the rate of moisture released from these agglomerates.
Key words: Fluidized bed, Fluid Coking, spray nozzle, spray nozzle erosion, agglomeration,
iii
Co-Authorship Statement
The journal articles written from the present work are listed below, and the individual contributions of all the members are indicated.
Chapter 2 Article Title:
Method to Measure the Rate of Liquid Released from Agglomerates Produced by Gas-Atomized Liquid Injection into a Fluidized Bed
Authors:
Nicholas Prociw, Cedric Briens, Franco Berruti, Tarek Jamaleddine
Article Status:
To be submitted for possible publication in Powder Technology
This work was supervised by C. Briens and F. Berruti. Various drafts of the paper were reviewed by C. Briens and F. Berruti. All the experiments and data analysis were conducted by N. Prociw. N. Prociw wrote the manuscript. Tarek Jamaleddine helped with operation of the large scale fluidized bed.
Chapter 3 Article Title:
Effect of Nozzle Erosion on Jet Interaction in a Fluidized Bed
Authors:
Nicholas Prociw, Cedric Briens, Franco Berruti
Article Status:
To be submitted for possible publication in Fuel
This work was supervised by C. Briens and F. Berruti. Various drafts of the paper were reviewed by C. Briens and F. Berruti. All the experiments and data analysis were conducted by N. Prociw. N. Prociw wrote the manuscript.
Chapter 4 Article Title:
Effect of Spray Nozzle Attachment Geometry on Rate of Liquid Released from Agglomerates Produced by Gas-Atomized Liquid Injection into a Fluidized Bed
Authors:
Nicholas Prociw, Cedric Briens, Franco Berruti
Article Status:
To be submitted for possible publication in Powder Technology
This work was supervised by C. Briens and F. Berruti. Various drafts of the paper were reviewed by C. Briens and F. Berruti. All the experiments and data analysis were conducted by N. Prociw. N. Prociw wrote the manuscript. Tarek Jamaleddine helped with operation of the large scale fluidized bed.
iv
Acknowledgments
I would like to acknowledge Dr. Cedric Briens and Dr Franco Berruti for the excellent
opportunity to work at ICFAR, and to present my results at Fluidization XIV. I would like to
thank them for their help in completing this thesis as well.
Thank you to Tom Johnston, Quinn Rush, Rob Taylor, Clayton Cook, and the UMS crew for
all the work they performed to maintain my lab equipment and help me solve many problems
that I encountered.
Thank you to my parents, for inspiring me, and helping me through difficult times. It is
through them I learned to never give up, and that any problem can be solved when you put
v
Table of Contents
Abstract ... ii
Co-Authorship Statement... iii
Acknowledgments... iv
Table of Contents ... v
List of Tables ... ix
List of Figures ... x
List of Symbols ... xiv
List of Appendices ... xvi
Chapter 1 ... 1
1 Introduction ... 1
1.1 Applications Involving Liquid Injection into Fluidized Bed Reactors ... 1
1.1.1 Agitated Wet Granulation ... 1
1.1.2 LDPE Production ... 2
1.1.3 Fluid Catalytic Cracking ... 3
1.1.4 Fluid CokingTM ... 4
1.2 Agglomerate Formation in Fluidized Beds ... 10
1.3 Spray Nozzles ... 13
1.3.1 Standard Fluid Coker Spray Nozzle Description ... 13
1.3.2 Nozzle Additions and Alterations ... 14
1.3.3 Effervescent Nozzles and Atomization ... 18
1.4 Review of Liquid Distribution and Liquid/Solid Mixing Measurements Methods in a Fluidized Bed ... 20
1.5 Research Objectives ... 23
vi
2 A METHOD TO MEASURE THE RATE OF LIQUID RELEASED FROM AGGLOMERATES PRODUCED BY GAS-ATOMIZED LIQUID INJECTION
INTO A FLUIDIZED BED ... 29
2.1 Introduction ... 29
2.2 Apparatus ... 33
2.3 Procedure ... 38
2.3.1 Electrode Calibration ... 38
2.3.2 Agglomerate Moisture Release Experiments... 43
2.4 Results and Discussion ... 46
2.4.1 Effect of GLR on Rate of Moisture Released from Agglomerates ... 46
2.4.2 Effect of Liquid Mass Flow Rate on the Rate of Moisture Released from Agglomerates ... 49
2.4.3 Evolution of Free Moisture throughout the Fluidized Bed ... 52
2.5 Conclusions ... 55
2.6 References ... 56
Chapter 3 ... 58
3 Effect of Nozzle Erosion on Jet Interaction in a Fluidized Bed ... 58
3.1 Introduction: ... 58
3.2 Apparatus ... 61
3.2.1 Fluidized Bed ... 61
3.2.2 Spray Nozzle Apparatus ... 63
3.2.3 Conductance Measurement Apparatus ... 65
3.2.4 Spray Nozzles ... 66
3.3 Procedure ... 69
3.3.1 Nozzle Characteristics ... 71
vii
3.4.1 Eroded Nozzle Characteristics ... 77
3.4.2 Effect of GLR on Standard TEB Nozzle and Eroded TEB Nozzle ... 81
3.4.3 The Effect of Nozzle Erosion on Jet-Bed Interaction at High Liquid Flow Rate ... 85
3.5 Conclusions ... 88
3.6 References ... 89
Chapter 4 ... 92
4 Effect of Spray Nozzle Attachment Geometry on Rate of Liquid Released from Agglomerates Produced by Gas-Atomized Liquid Injection into a Fluidized Bed ... 92
4.1 Introduction ... 92
4.2 Apparatus ... 97
4.2.1 Fluidized Bed ... 97
4.2.2 Spray Nozzles ... 100
4.2.3 Conductivity Measurement Apparatus ... 103
4.3 Procedure ... 103
4.4 Results and Discussion ... 106
4.4.1 Open Air sprays ... 106
4.4.2 Cloverleaf Nozzle Attachment Performance in the Fluidized Bed ... 110
4.4.3 Conical Nozzle Attachment Performance in the Fluidized Bed ... 112
4.4.4 Comparison of Eroded Nozzles, Cloverleaf, and Conical Nozzle Attachments ... 113
4.5 Conclusions ... 114
4.6 References: ... 115
Chapter 5 ... 118
5.1 Conclusions ... 118
viii
Appendix A ... 123
Parts Required for Custom Eroded Nozzle Investigation. ... 123
ix
List of Tables
Table 1.1: Typical dimensions of a Fluid Coker vessel (US Patent 2881130) ... 9
Table 2.1: Operating conditions tested ... 46
Table 3.1: Calculated nozzle throat areas based on upstream pressure drop measurement. *
x
List of Figures
Figure 1.1: Simplified process flow diagram of a Fluid Coker reactor ... 6
Figure 1.2: TEB nozzle developed by Base et al. (1999) ... 13
Figure 1.3: Formation of shockwaves inside a TEB nozzle (Base et al. 1999) ... 14
Figure 1.4: TEB nozzle attachment with conical nozzle attachment used in simulation by Poutgach et al. (2012) ... 15
Figure 1.5: Cloverleaf nozzle attachment (view of tip) (Chan et al. 2012) ... 16
Figure 1.6: Impact cone investigated by House et al. (2009) ... 17
Figure 1.7: Left - annular gas shroud. Right: Sonic gas shroud. Both shrouds were investigated by House et al. (2009)... 17
Figure 2.1: Simplified Process Flow Diagram of Experimental Apparatus ... 33
Figure 2.2: Top view of fluidized bed with dimensions (inches) ... 34
Figure 2.3: Standard TEB nozzle (Base et al. 1999)... 35
Figure 2.4: Premix chamber and nozzle assembly ... 36
Figure 2.5: Schematic diagram of conductance electrodes ... 37
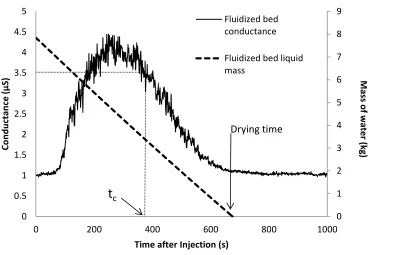
Figure 2.6: Fluidized bed electrical conductance versus time after liquid injection for electrode calibration experiment (GLR = 30%)... 41
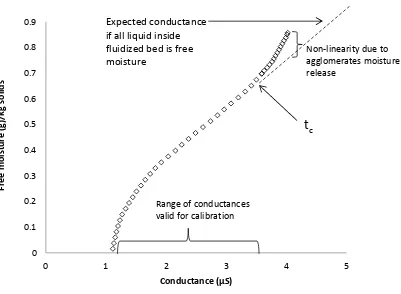
Figure 2.7: Calibration data points for electrode 1. A similar plot is produced for each electrode ... 42
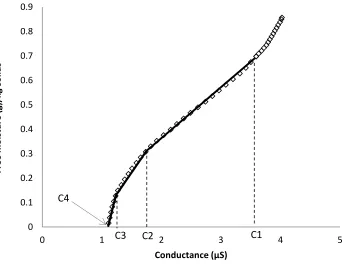
Figure 2.8: Equations 2.7 a-c fitted to calibration data for electrode 1 ... 43
xi
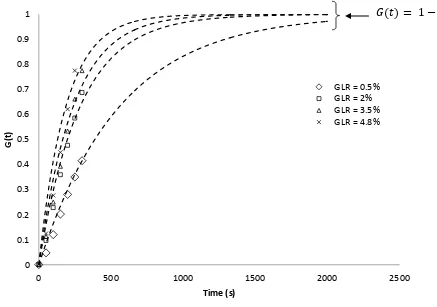
Figure 2.11: Cumulative fraction of moisture freed from agglomerates (G(t)) versus time for
four different liquid flow rates (0.6, 1.2, 1.9, 2.5 kg/s) (GLR = 2%) ... 50
Figure 2.12: Effect of liquid mass flow rate on moisture release rate time constant (2% GLR) ... 51
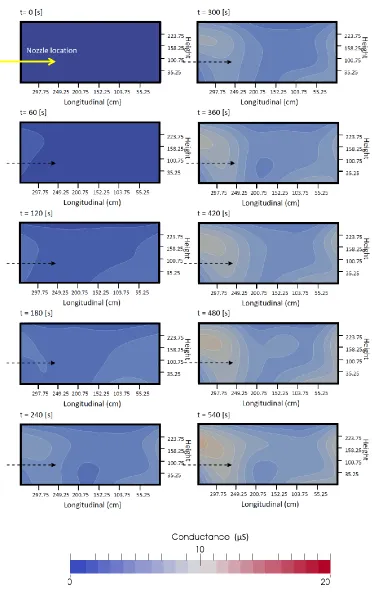
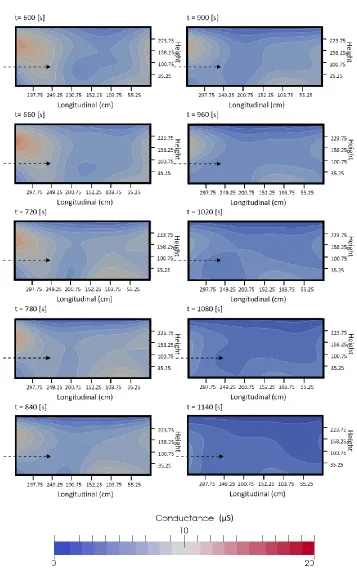
Figure 2.13: Evolution of free moisture in fluidized bed after liquid injection is complete. Liquid flow rate = 1.35 kg/s. GLR = 2%. First 9 minutes ... 53
Figure 2.14: Evolution of free moisture in fluidized bed after liquid injection is complete. Liquid flow rate = 1.35 kg/s. GLR = 2%. Time step = 1 min. ... 54
Figure 3.1: Simplified Process Flow Diagram of Experimental Apparatus ... 62
Figure 3.2: Top view of fluidized bed vessel (dimensions in inches) ... 62
Figure 3.3: Standard TEB nozzle (Base et al. 1999)... 64
Figure 3.4: Premix chamber and nozzle assembly ... 64
Figure 3.5: Schematic Diagram of Conductive Electrodes ... 66
Figure 3.6: Top: Eroded nozzle and standard nozzle (middle) tips. Bottom left: Erosion located at the first throat of the TEB nozzle. Bottom right: hole formed through the wall of nozzle 3. ... 67
Figure 3.7: Possible trajectory of entrained solid particle within two phase flow through a Fluid Coker spray nozzle (based on visual inspection of nozzle interior) ... 68
Figure 3.8: Side view of each nozzle showing curved profile. The non-eroded TEB nozzle is shown in the middle for comparison. ... 69
Figure 3.9: Images of free jets produced by each nozzle. ... 78
xii
Figure 3.12: Open air spray angle as a function of normalized volume ... 81
Figure 3.13: Fraction of injected liquid released from agglomerates vs. time after spray
completion... 82
Figure 3.14: Atomization power as a function of GLR for each nozzle ... 83
Figure 3.15: Agglomerate moisture release rate time constant vs. GLR for non-eroded TEB
nozzle, and Eroded Nozzle 3 (1.5 kg/s). ... 84
Figure 3.16: Agglomerate moisture release rate time constant versus normalized nozzle exit
orifice area. Constant upstream liquid pressure (2600 kPa (gauge)). Replicates for each
nozzle are shown. ... 86
Figure 3.17: Agglomerate moisture release rate time constant versus normalized nozzle exit
orifice area. Constant liquid flow rate (3 kg/s, GLR = 2%). Replicates for each nozzle are
shown. ... 86
Figure 3.18: Comparison of the effect of nozzle erosion on the agglomerate moisture release
rate time constant for constant upstream liquid pressure case and constant liquid flow rate
case. ... 87
Figure 4.1: Turbulent eddy formation inside draft tube (Zhou et al. 2004) ... 93
Figure 4.2Annular shroud (left) and sonic shroud (right) investigated by House et al. (2008)
... 94
Figure 4.3: TEB nozzle with diverging nozzle tip investigated by Portoghese et al. (2010) . 95
Figure 4.4: Simplified Process Flow Diagram of Experimental Apparatus ... 98
Figure 4.5: Top view of fluidized bed vessel (dimensions in inches) ... 98
xiii
Eroded Cloverleaf. Right: Square cloverleaf. ... 101
Figure 4.8: Side view of diverging conical nozzle attachment (β = 5°, 10°, 20°, 30°, 40°) . 101
Figure 4.9: Premix chamber and nozzle assembly ... 102
Figure 4.10: Schematic Diagram of Conductive Electrodes ... 103
Figure 4.11: Open air sprays produced with conical nozzle attachment (left). Open air sprays
produced with cloverleaf nozzle attachment (Right) ... 107
Figure 4.12: Open air spray angles produced by conical nozzle tip attachments ... 108
Figure 4.13: Open air spray angles produced by each cloverleaf nozzle tested. ... 109
Figure 4.14: Agglomerate moisture released rate time constant for each cloverleaf nozzle
tested. Results are compared to standard TEB nozzle. Liquid flow rate = 3 kg/s. GLR = 2%
for each case. ... 111
Figure 4.15: Effect of diverging nozzle tip angle on agglomerate moisture release rate time
constant τ (Liquid flow rate = 3 kg/s, GLR = 2 wt%) ... 112
xiv
List of Symbols
Nozzle throat area (m2)
Conductance of fluidized bed (micro Siemens)
Flow rate of water evaporated from the fluidized bed (kg/s)
Flow rate of atomization gas through spray nozzle (kg/s)
Mass flow rate of liquid through spray nozzle (kg/s)
( ) Fraction of liquid released from agglomerates after the end of injection
(-)
Humidity of incoming fluidization air (kg water/kg air)
Humidity of fluidization air exiting fluidized bed (kg water/kg air)
Ratio of upstream nozzle pressure to nozzle throat pressure (-)
Mass of water trapped in agglomerates (kg)
Molecular weight of atomization gas (kg/kmol)
Mass of water injected water (kg)
Mass of liquid inside the fluidized bed (kg)
Mass of solids in fluidized bed (kg)
Pressure at the throat of the nozzle (Pa)
Pressure upstream of the throat of the nozzle (Pa)
xv
Measurement resistance (Ω)
Temperature of atomization gas (K)
Time after the end of liquid injection (s)
Time after injection at which the rate of change of conductance equals rate of change of water within fluidized bed (s)
Velocity of atomization gas through spray nozzle (m/s)
Speed of sound through gas (m/s)
Applied voltage (V)
Voltage drop across measurement resistor (V)
̇ Superficial velocity of fluidization gas (m/s)
̅ Average free moisture throughout fluidized bed as measured by
conductance electrodes (-)
Average density of gas/liquid mixture (kg/m3)
Ratio of heat capacities (-)
Void fraction of atomization gas at the tip of a spray nozzle (-)
Solid particle density (kg/m3)
Density of atomization gas (kg/m3)
Density of injected liquid (kg/m3)
xvi
List of Appendices
Chapter 1
1
Introduction
The present work describes experiments that were performed to measure the rate
of moisture released from agglomerates in a large scale fluidized bed. The developed
method was used to compare the performance of various commercial scale spray nozzles
applied to liquid distribution inside a fluidized bed. This is of particular importance for
the Fluid Coking process which uses spray nozzles to inject liquid bitumen into a bed of
fluidized coke particles.
The following chapter discusses the various applications for liquid injection into
fluidized beds. The Fluid Coking process is reviewed in greater detail, as the experiments
presented in this thesis are directly related to this process. The stability of agglomerates,
which play an important role in influencing the performance of a Fluid Coker reactor, is
discussed next. Spray nozzles are used to distribute liquid into Fluid Cokers, and are
specially designed to minimize agglomerate formation and stability. There have been
several proposed additions or modifications to the spray nozzles used in the Fluid Coker,
some of which are reviewed here. A review of the various methods to measure liquid
distribution inside a Fluid Coking unit is discussed next. The objectives of the thesis are
described last.
1.1 Applications Involving Liquid Injection into Fluidized
Bed Reactors
1.1.1 Agitated Wet Granulation
Granulation is a process through which small solid particles are stuck together to
form larger agglomerates consisting of the same material. Granulation is an important
process used in the mineral processing, agricultural, detergent, pharmaceutical, food and
specialty chemicals industries. Reasons for producing granules include minimization of
dust formation, improved flow characteristics of powders, control of dissolution rates of
solids in a liquid, and the prevention of segregation of mixtures of powders (Iveson et al.
Wet agitated granulation involves the injection of a liquid binder into a fluidized
bed of solid powder. The liquid binder is distributed into the fluidized bed by the spray
nozzles and through the mixing action of the fluidized bed. As the liquid and solids mix,
the solids become coated with the liquid binder solution. When coated particles come into
contact, the liquid binder produces a liquid bridge, creating a cohesive force that binds
the particles together. The liquid binder often contains a soluble material that is left
deposited on the fluidized solid particles after the solvent evaporates, which holds the
solid particles together. Granules of many different sizes may initially form; however,
due to the shear forces present inside the fluidized bed, only small, stable granules
survive. The size of the granules may be controlled using attrition nozzles that inject high
velocity gas into the fluidized bed (Pacek et al. 1991).
1.1.2 LDPE Production
One process used to produce low density polyethylene (LDPE) incorporates a
fluidized bed reactor using reacting monomer (ethylene) as the fluidization gas and
catalyst particles as the fluidized solids. The reaction is exothermic; therefore heat must
be removed from the reactor to ensure favorable equilibrium conditions are met. One way
to cool the reactor is to condense monomer molecules using a compressor, a heat
exchanger, and the addition of an inert condensable component to the feed stream. The
condensable components raise the dew point of the monomer stream, thereby making it
possible to produce liquid condensate. The condensate is injected back into the reactor
through a series of spray nozzles located close to the fluidized bed distributor, where it
evaporates, and cools the reactor contents (Jenkins III et al. 1986)
The higher the flow rate of liquid injected into the reactor, the larger the decrease
in reactor temperature. However, if the liquid flow rate is too high, it will not evaporate
fast enough, and the fluidized bed will begin to flood. Flooding leads to poor gas
distribution and results in gas channeling through the fluidized bed. Liquid accumulation
on the distributor grid can also lead to undesirable agglomerate formation on top of the
distributor plate, leading to fouling and subsequent reactor malfunction.
The quality of liquid distribution inside a fluidized polyethylene reactor must be
accumulation above the distributor grid. Smaller droplet sizes and uniform liquid
distribution are necessary to ensure the rate of evaporation of liquid is fast enough to
operate the reactor at the optimal reaction temperature without flooding. Spray nozzle
geometry and location play an important role in setting these parameters and therefore
optimizing the yield of desired products.
1.1.3 Fluid Catalytic Cracking
Fluidized Catalytic Cracking (FCC) is a process developed to convert heavy oil
fractions into lighter, more valuable products such as olefins, gasoline and distillates
(Patel et al. 2012). The FCC unit is a riser reactor comprising of three zones: feed
injection, dense phase, and dilute phase region. The liquid reactants are sprayed into a
rising stream of fluidization gas and catalyst pellets in the feed injection region. The
liquid products quickly vaporize and contact the catalyst in the dense phase region.
Cracked vapors are produced in the dense phase region and flow upwards into the dilute
phase region. The product vapors and catalyst travel to the top of the reactor and are
separated by means of centrifugal force. Product vapors are distilled, with heavy
components recycled back to the FCC reactor. Spent catalyst is sent to a regenerator,
which uses air to burn residual coke that has formed on the catalyst surface. The heat of
combustion raises the temperature of the catalysts, and provides the heat necessary to
drive the endothermic cracking reaction. The regenerated catalysts are recycled back to
the feed injection zone, where they again react with the heavy oil reactants.
The quality of liquid feed distribution into the rising gas-catalyst stream can play
an important role in affecting product selectivity. The distribution of liquid reactants
across the cross section of the feed section must be as uniform as possible to optimize the
contact area between the reactant and catalyst (Niccum, 1985), and to ensure fast
vaporization of the feed droplets. Fast vaporization of liquid feed droplets is essential in
order to maintain high velocities in the riser reactor (which increases the drag force on
the rising catalyst particles) and to reduce the mass of catalyst required to vaporize all the
feed (Gupta et al. 2010). Droplets that are too small lack enough momentum to travel into
the center of the riser, thereby increasing the reactant concentration along the outer region
often assumed that the rate at which liquid evaporates and is transported to the catalyst
particle is much faster than the reaction time. However, this assumption is not necessarily
valid if liquid droplets produced by the spray nozzles are too large. Large spray droplets
take longer to vaporize and lead to excessive coke formation on the catalyst surface.
Large droplets also lead to formation of wet liquid solid agglomerates, which may stick
to the reactor wall and produce excessive fouling in regions throughout the reactor.
Wilson (1997) outlines some of the previously developed FCC feed injection systems.
1.1.4 Fluid Coking
TM1.1.4.1
Process Description
In 2004, the Alberta Energy and Utilities Board estimated a total proven oil
content of approximately 170.2 billion barrels in Northern Alberta, 99% of which is
found in oil sands (Canada National Energy Board, 2004). Oil sands (also known as tar
sands or bituminous sands) consist of bitumen impregnated into porous sandstone or
carbonate rock (Speight et al. 2001). Bitumen is very high viscosity oil, consisting
predominately of large aromatic rings of carbon compounds. Due to its high viscosity,
bitumen does not flow easily, making it difficult to recover at reservoir conditions. For
deposits located close to the surface, open pit mining is used as a method to recover
bitumen from oil sands. For bitumen deposits located at a depth greater than 75 m below
ground, an in-situ process is used (Williams et al. 2005). An in-situ process usually
involves the injection of steam or a solvent underground in order to reduce the viscosity
of the bitumen, allowing it to flow to the surface in a similar fashion to conventional oil
recovery.
Bitumen consists of high molecular weight hydrocarbon compounds, and contains
many impurities such as sulfur, nitrogen, oxygen, and heavy metals, thereby making it
unsuitable to refine in most conventional refineries. After bitumen is recovered from the
reservoir, it is sent to an upgrading facility. Upgraders contain the necessary unit
operations required to reduce the molecular weight and impurity content of the bitumen
before it is sent to a refinery. Some of the unit operations found at an upgrading facility
hydrotreating, and diluent blending. The product of upgrading bitumen is synthetic crude
oil; an oil that may be sent to conventional refineries for further processing.
Fluid CokingTM is a process developed to thermally crack heavy, non-vaporizable
hydrocarbon liquids into lighter distillable products, suitable for atmospheric and vacuum
distillation units found at conventional refineries. The process begins by preheating
bitumen to about 350°C to reduce its viscosity to that of water at room temperature
(Pfeiffer et al. 1959). This provides some of the heat required to induce thermal cracking
reactions, and also reduces the resistance of flow through the spray nozzles that inject the
bitumen into the reactor. The bitumen is mixed with atomizing steam in a mixing
chamber and the two-phase bubbly flow travels through a series of injection nozzles.
These nozzles are located at various locations around the height and circumference of the
reactor in order to improve liquid distribution and reduce the over-wetting of coke
particles. The atomizing steam helps aid in the breakup of bitumen liquid into small
droplets. As the droplets travel to the interior of the reactor, they coat hot coke particles,
which transfer heat to the bitumen required to induce an endothermic cracking reaction.
Volatile hydrocarbon molecules and coke are produced at the coke-bitumen interface.
The volatile compounds diffuse through the layer of bitumen coating the coke particle
into the bulk gas phase, where they are transported with the fluidization gas to the top of
the reactor. The resulting coke forms a layer around the initial coke particle, causing the
initial coke particle to grow in size.
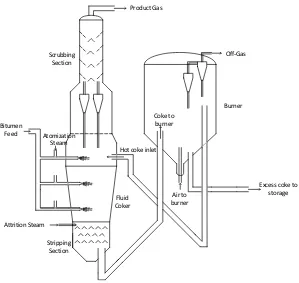
The Fluid Coking vessel consists of various sections: the reaction zone, the
stripping zone, the scrubbing zone, the fractionators and the burner. In the reaction zone,
bitumen is introduced into the vessel via spray nozzles and is distributed among the
individual coke particles. The temperature in this section is typically 480°C – 600°C and
it operates at a pressure between 0-345 kPag (Pfeiffer et al. 1959). Hot product vapors
and fluidization gas rise to the top of the reaction zone and flow through a series of
cyclones. The cyclones separate solid particles that were entrained in the gas phase back
to the reaction zone, and direct the flow of vapors to the scrubbing section. The scrubber
cools the vapor products in order to condense and recycle high boiling point components,
which are returned to the reaction zone. The scrubbed vapors pass through a fractionating
components formed in the fractionating section condense, and are used to cool incoming
vapors in the scrubbing section. Light components that do not condense in the
fractionating section exit through the top of the Fluid Coking vessel, flow through a
condenser, and are sent to another location within the upgrading facility. Heavier
components are mixed with the incoming feed stream and are recycled back to the reactor
for further cracking (Devuluri et al. 2012).
Scrubbing Section
Bitumen
Feed Atomization
Steam
Attrition Steam
Hot coke inlet
Fluid Coker
Burner Off-Gas
Excess coke to storage Coke to
burner
Air to burner Product Gas
Stripping Section
Figure 1.1: Simplified process flow diagram of a Fluid Coker reactor
Particles that fall to the bottom of the reactor pass through a stripping section to
remove hydrocarbons trapped on the surface of the coke. The stripped coke particles are
pneumatically transported to a burner, where air is introduced, partially combusting the
coke to generate heat and combustion exhaust. The heat of combustion increases the
temperature of the remaining, unburned coke particles, which are recycled back to the
1.1.4.2
Stripping Section
The stripping section of a Fluid Coker removes trapped hydrocarbon products
from the surface of coke particles falling to the bottom of the reactor. This is necessary as
it maximizes the conversion of reactants to desirable products and reduces the formation
of undesirable vapors in the burner (that may lead to fouling and run length limitations in
the burner overhead) (Devuluri et al. 2012). The stripper section consists of sheds
(conduits) that span cord lengths along the cross section of the vessel at various heights.
A gas sparger is located under the sheds at the bottom of the Fluid Coker, sending
fluidization steam upwards through the stripping section, counter current to the direction
of falling coke particles. The sheds redistribute the fluidization gas evenly across the
cross section of the stripping zone, thereby enhancing the contact between the gases and
descending coke particles.
An issue that is commonly encountered in the stripping section is the fouling of
the stripper sheds. Wet agglomerates of coke particles may stick to the surface of the
sheds, and reduce the area through which the fluidization gas can pass through. This can
lead to poor coke circulation and reduced fluidization velocity throughout the reaction
zone. Bi et al. (2004) discuss a V-shape stripper shed geometry that can be used to
reduced stripper fouling and improve contact between the fluidization gas and descending
coke particles. Sanchez et al. (2013) investigated the configuration of V-shape stripper
sheds as well as the fraction of cross sectional area covered by the sheds in the stripper
zone of a pilot scale cold model Fluid Coker. A grid-like mesh configuration was found
to be advantageous for the prevention of liquid flow through the sheds, as well as the
prevention of vapors reaching the stripper level inside the reactor. As well, it was found
that using the current stripper shed configuration, the fraction of open area within the
stripper section should be around 60-70% to reduce loss of valuable liquids to the burner.
1.1.4.3
Scrubber Section
Product vapors and steam rise to the top of the reaction zone and pass through one
force, recycling these solids back into the reaction zone. The vapors pass through the top
of the cyclones into the scrubbing section, where they ascend through a series of internal
sheds. Cooling oil descends around the internal sheds, and contacts the rising vapors,
cooling and removing heavy fractions from the vapors in the process (McKnight et al.
2011). The product vapors are cooled to a temperature of approximately 370°C - 400°C
(Pfeiffer et al. 1959). Some of the liquids formed are cooled and recycled back to the top
of the scrubbing zone, while the rest is recycled back to the reaction zone for further
reaction.
The scrubbing section resides above the cyclones and consists of inverted
V-shaped sheds to enhance the contact between the rising hot vapors and the descending
cooling oil. A de-entrainment grid is located above the sheds to further remove solids and
oil droplets from the vapor product stream.
Vapor products exiting the cyclones can enter the scrubbing section with a high
rotational velocity, causing the majority of the vapor to migrate towards the walls of the
vessel. The uneven distribution of product vapors in the scrubbing zone creates a high
velocity region near the walls, where the hot gases carry oil droplets above the scrubber
sheds and deposits these droplets on the de-entrainment grid. The deposited oil can react
and form coke on the de-entrainment grid due to the heat provided by the rising product
vapors, causing the grid to plug. This reduces the area through which the product vapors
rise through the scrubbing section, increases the velocity, and decreases the contact time
with the cooling oil. As fouling intensifies, the removal of solids, metals, and heavy
components decrease, leading to poor product gas quality. This may have detrimental
effects on downstream operations, such as catalyst poisoning in the Hydrotreating unit.
One way to improve product gas/cooling oil contact is suggested by Bulbuc et al. (2010).
Adding baffles above the cyclone exit can slow down the product vapor velocity near the
walls and enhance the uniformity of the gas flow throughout the cross section of the
scrubber section, thereby reducing the entrainment of liquid into the rising vapor product
stream and reducing the formation of coke deposits on the de-entrainment grid located at
1.1.4.4
Reaction Section
The reaction section of a Fluid Coker comprises of the following subsections:
Table 1.1: Typical dimensions of a Fluid Coker vessel (Pfeiffer et al. 1959)
Section Diameter (m) Height (m)
Top straight side 2.75 6
Wide Diameter 3.35 5
Middle section cone 1.2 x 3.35 10.3
Stripper section 1.2 3
The dimensions of Fluid Cokers currently in use may be different from that
reported by Pfeiffer et al. (1959); however a similar geometry is still in use today for
reasons explained below. The vessel expands in diameter from the bottom to the
disengaging region at the top of the reaction zone in order to handle the increased mass
flow rate of vapors that are formed when bitumen reacts on the surface of the coke
particles, and to therefore keep the fluidization velocity constant along the height of the
fluidized bed. The disengagement section at the top of the reactor is reduced in diameter
in order to accelerate the velocity of the gas exiting the reactor and entering the cyclones.
This reduction in diameter reduces the residence time of the product vapors in the reactor
to prevent excessive thermal cracking reactions.
The reaction section operates at a temperature of approximately 480 °C. The high
temperature is needed to supply the energy required to break apart the bonds holding the
long hydrocarbon chains and aromatic rings together. The pressure of the reaction zone is
generally kept quite low, and is set to approximately 75 kPag to promote the production
of vapor products. The solids in the fluidized bed may reach a height of up to 18 m and
on Fluid Coker hydrodynamics revealed that the void fraction of the fluidized bed inside
the reaction zone tends to be higher near the walls and lower in the center region, creating
a core-annulus flow structure. The solids tend to fall to a lower elevation along the walls
of the reactor, and are carried upward by fluidization gas in the center region. Since more
solid coke particles tend to accumulate near the walls of the reactor, the solids are
entrained in the feed jets formed by the spray nozzles. The interaction between the solid
coke particles and the bitumen plays an important role in determining the overall
conversion of bitumen to distillable liquids.
1.1.4.5
Burner
The burner is responsible for generating the heat of reaction necessary to carry out
the endothermic cracking reactions in the reaction zone of the Fluid Coker. Solids that
descend to the bottom of the reactor are pneumatically transported to a burner vessel. The
burner is another fluidized bed consisting of coke particles fluidized by air. The
temperature of the burner is operated higher than the reaction section (540°C - 820°C)
and is controlled by adjusting the flow rate of air entering the vessel. Oxygen reacts with
some of the coke particles residing inside the burner to produce exhaust and heat. The
heat is transferred to the remaining coke particles, some of which are fed back to the
reaction section of the Fluid Coker vessel (Worley et al. 1982). If excess coke is present
in the burner, it is transferred pneumatically to storage. The feed rate of hot coke particles
back to the reaction section is dependent on the temperature difference between the
burner and reaction section (Pfeiffer et al. 1959). The higher the temperature difference,
the lower the flow rate of coke particles recycled back to the reaction section.
1.2 Agglomerate Formation in Fluidized Beds
Agglomerate formation occurs when solids stick together due to short range
chemical or physical processes among themselves, or by binders, which form cohesive
bridges between the solid particles, holding them together (Pietsh, 2003). Bruhns et al.
(2005) showed that agglomerates tend to form when a liquid is injected into a fluidized
bed. Agglomerate formation is desirable in many chemical processes; however, it is
detrimental to Fluid Coker performance. Agglomerates tend to decrease the yield of
Gray (2002) describes the mechanism through which bitumen droplets coat coke
particles in a Fluid Coker. Relatively large liquid droplets are injected into a fluidized bed
and engulf several smaller solids, filling the pores between these solids. Cohesive forces
between the solid particles and the liquid binder keep the granules intact. Shear forces
generated by surrounding fluidized particles and granules act on the newly formed
granules to break them apart. If the originally formed agglomerates are unstable, they will
break apart into individually coated solid particles, which are desired for the Fluid
Coking process. However, if the quality of the liquid distribution among the fluidized
particles is poor, the agglomerates formed by the jet-bed interaction may not break apart
easily. In this case, the agglomerates remain intact, and due to the weight of the
agglomerate, the bed of solids will not remain properly fluidized.
Liquid injection applied to the Fluid Coking process tends to lead to the formation
of agglomerates that are stabilized by unreacted bitumen, which acts as a liquid binder.
The level of saturation within an agglomerate is a measure of the fraction of the pore
space between the solid particles that is filled with liquid. An agglomerate in the pendular
state of liquid saturation consists of solids that are held together by liquid bridges. Voids
exist between the solid particles where no liquid or solids are present. An agglomerate in
the capillary state consists of solids whereby each void is completely filled with a liquid
binder. Agglomerates that have a portion of the void spaces between solids filled with
liquid binder are termed funicular, and the forces that hold these agglomerates together
are a combination of the forces that hold the pendular and capillary state agglomerate
together.
The stability of agglomerates formed inside a fluidized bed is a complex
phenomenon since there are many factors that can influence the outcome. The liquid
content of an agglomerate does not necessarily predict its fate within a fluidized bed. It is
the various forces that act on and within an agglomerate that are responsible for the
overall stability of the agglomerate. The different forces that hold agglomerates together
include surface tension and capillary forces, viscous forces, and inter-particle friction
forces (Iveson, 2001). These forces may be altered by changing properties of the solids or
liquid binders holding the agglomerates together. Surface tension tends to pull particles
composition and geometry. The viscosity of the binder plays a large role in controlling
how easily solid particles move within the agglomerate. The higher the viscosity, the
higher the energy input required to move the solids though the liquid binder. In the Fluid
Coking process, viscosity plays an important role, since the viscosity of the liquid film
covering the bitumen particles tends to increase as the extent of reaction proceeds
towards completion (Aminu et al. 2004).
Weber et al. (2008) studied the stability of agglomerates produced from
sand/water and glass bead/water mixtures in a small scale fluidized bed. It was reported
that the fluidization velocity plays a significant role in determining the type of breakage
mechanism, erosion or fragmentation, which will cause agglomerate destruction. Erosion
occurs at lower fluidization velocities, while fragmentation of agglomerates occurs at
high fluidization velocities.
The properties of agglomerates that can affect their stability include initial
agglomerate size, agglomerate density, and liquid binder composition (Weber et al.
2008). Large and dense agglomerates tend to be more stable at lower fluidization
velocities, where erosion is the dominant mechanism of destruction. Weber et al. (2008)
demonstrated how the effect of binder viscosity can have a significant impact on
agglomerate stability, but the marginal increase in agglomerate stability is reduced as
viscosity is increased.
In Fluid Cokers, high quality distribution of liquid among the coke particles is
vital because it minimizes the formation of stable liquid-solid agglomerates, which
reduce the conversion of bitumen to distillable products. These liquid solid agglomerates
also stick to the Fluid Coker internals, which can hinder the quality of fluidization of
solids. In order to reduce the impact of agglomeration, the reactor temperature must be
raised to increase the rate of reaction. This helps to raise the temperature of bitumen
trapped in agglomerates, allowing the liquid to react and form vapor products. Raising
the reactor temperature above optimal conditions leads to higher energy input, increased
pollutant generation, and a reduction in desirable product selectivity (House et al. 2004).
One of the main objectives of Fluid Coker spray nozzle design is to maximize the
agglomerate formation is minimized, and the stability of the agglomerates produced is
low. Various spray nozzle designs have been proposed in academia and industry, and are
discussed next.
1.3 Spray Nozzles
1.3.1 Standard Fluid Coker Spray Nozzle Description
Liquid feed is injected into the Fluidized Coker in the form of atomized droplets.
The nozzle used to atomize the droplets and distribute them into the fluidized bed (Figure
1.2) is described by Base et al. (1999).
Figure 1.2: TEB nozzle developed by Base et al. (1999)
Atomization steam is injected along with liquid bitumen through the spray nozzles,
producing a two phase bubbly flow. This type of atomization is known as effervescent
atomization, and is reviewed in detail by Sovani et al. (1999). The two phase flow enters
the nozzle at 8 (shown in Figure 1.3) as a continuous liquid phase with dispersed gas
bubbles. Restriction 10 accelerates the fluid, creating a velocity gradient between the
continuous liquid phase and gas bubbles. The difference in velocity between the two
phases helps to enhance gas distribution inside the liquid, creating finer bubbles.
Expansion section 11 and converging section 12 produce further shear between the two
phases by changing the velocity of the fluid, further enhancing the mixture of gas and
liquid. At the nozzle tip, (13 in Figure 1.3), the pressure of the two phase fluid rapidly
decreases as it enters the reactor. The decrease in pressure causes the gas bubbles to
expand, and a phase inversion occurs (Poutgatch et al. (2012)). The sudden expansion of
the gas shatters the liquid into small droplets, and propels them both outwards away from
Figure 1.3: Formation of shockwaves inside a TEB nozzle (Base et al. 1999)
Adding more gas for a given liquid mass flow rate (increasing the gas-to-liquid
mass ratio, or GLR) increases the pressure gradient at the tip of the nozzle, and enhances
atomization and distribution of the droplets formed at the nozzle exit.
1.3.2 Nozzle Additions and Alterations
Various alterations and additions to the TEB spray nozzle have been proposed.
These include changes to the internal geometry of the spray nozzle, attachments at the
end such as a cloverleaf, impact plate, and draft tube.
Poutgatch et al. (2012) investigated the effect of a conical shaped diverging
a numerical model. The addition of an attachment with an expansion angle smaller than
the natural expansion angle of the spray decreased the spray angle and increased the
droplet size. When the expansion angle of the conical attachment was increased to the
natural expansion angle of the spray, it had a negligible impact on the resulting spray
angle and droplet size. The authors concluded that conical attachments with small
expansion angles may be useful for producing a spray of higher penetration and lower
dispersion capability. However, it is apparent that a conical attachment reduced the radial
momentum transfer between the gas and liquid, making it unsuitable for dispersion at low
expansion angles, but possibly beneficial at large expansion angles.
Figure 1.4: TEB nozzle attachment with conical nozzle attachment used in
simulation by Poutgach et al. (2012)
One of the disadvantages of the spray nozzles currently used is that the spray
produced by these nozzles is circular in cross section. A circular spray pattern minimizes
the surface area to perimeter ratio of the spray. As a result, much of the coke surrounding
the jet may not penetrate into the core of the jet, which reduces the contact area between
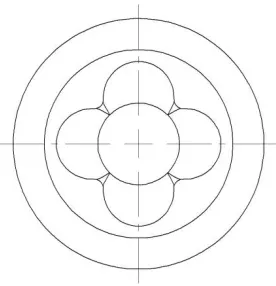
the bitumen and coke particles (Chan et al. 2012). The cloverleaf nozzle attachment is
added to the end of the spray nozzle presented by Base et al. (1999). It consists of four
divergent, quasi-conical flow passages (lobes) that meet at the second convergent section
of the regular nozzle. The purpose of these lobes is to increase the surface area to
perimeter ratio of the spray injected into the fluidized bed, thereby increasing the contact
Figure 1.5: Cloverleaf nozzle attachment (view of tip) (Chan et al. 2012)
Sprays produced by Fluid Coker nozzles tend to have a liquid dense region at the
center of the jet. McMillan et al. (2005) investigated the effect of adding an enhanced
solids entrainment device (ESE) downstream of the nozzle exit in an effort to improve the
distribution of liquid onto fluidized solids. The ESE is a curricular conduit installed
coaxially downstream of the nozzle exit (Chan et al. 2006). The jet enters the fluidized
bed at a high velocity, and produces a low pressure region adjacent to the jet boundary.
Solids are entrained in the jet in this low pressure region. The jet then enters the ESE,
where turbulence is enhanced due to the interaction of the spray and conduit walls. The
turbulence aids in transferring solids from the jet periphery (where they are entrained),
into the center of the jet, which is rich in liquid. This produces better contact between the
liquid and solid particles.
House et al. (2009) investigated the effect of an impact cone on liquid dispersion
in a fluidized bed. An impact cone is a conical attachment added at a distance
downstream of the nozzle exit, with the point of the cone directed toward the nozzle exit
orifice. The tip of the cone disperses the spray in a radial direction upon impact, thereby
dispersing the dense liquid region which forms at the center of the jet. The authors
showed that the impact plate distributes liquid most effectively when it is located in the
immediate vicinity of the nozzle tip. A limitation of the impact cone is that a portion of
the momentum carried by the jet is transferred to the impact cone, thereby reducing the
Figure 1.6: Impact cone investigated by House et al. (2009)
House et al. (2009) also investigated the effect of gas shrouds installed around the
nozzle exit orifice. Gas shrouds were believed to aid in solids entrainment into the jet,
and expand the size of the jet, thus increasing the contact area between the liquid and
solid fluidized solids. The authors showed that the implementation of gas shrouds
decreased the amount of liquid trapped in large agglomerates and therefore distributed the
liquid better than the stand alone Fluid Coker nozzle.
Figure 1.7: Left: annular gas shroud. Right: Sonic gas shroud. Both shrouds were
investigated by House et al. (2009)
Impact cone Spray nozzle
Annular gas
shroud TEB nozzle
Sonic gas shroud
Gas-liquid jet
TEB nozzle
Gas jet
Gas-liquid
jet Sonic
Portoghese et al. (2010) investigated the effect of the Fluid Coker geometry on the
interaction between the gas-liquid spray and fluidized bed particles. A scaled down Fluid
Coker nozzle was compared to a nozzle with an additional expansion zone downstream
the second convergent section, and a nozzle with only one convergent and one divergent
section. Using a conductance measurement technique to measure the quality of liquid
distribution among the fluidized solid particles, the authors found that the best
performing nozzle geometry is the current Fluid Coker nozzle with the additional
expansion region. The addition of a final diverging section increases the stability of the
spray, which the authors found to be a significant variable in determining liquid/solid
contact efficiency.
1.3.3 Effervescent Nozzles and Atomization
Effervescent atomization nozzles involve internal mixing between an atomizing
gas and a liquid. A two phase flow is produced within the nozzle body, and is ejected
through an exit orifice. As the gas mixes with the liquid, it expands, producing bubbles,
reducing the characteristic liquid dimensions within the discharge orifice (Sovani, et al.
2001). At the nozzle exit, the pressure is reduced, causing further gas expansion. The
expanding gas bubbles at the nozzle exit break the liquid ligaments into small droplets.
The TEB nozzle used for the Fluid Coking process may be classified as a type of
effervescent nozzle, thus studies completed on effervescent atomization may be relevant
to understanding the spray characteristics observed using Fluid Coking spray nozzles.
Effervescent nozzles consist of four main components: the gas and liquid supply
ports, a mixing chamber, and an exit orifice. Since a two phase flow is formed, the flow
through the exit orifice becomes choked at a much lower velocity than would occur if the
fluid is a pure liquid or pure gas. For example, the speed of sound through an air/water
mixture is about 20 m/s. The speed of sound through air alone is 340 m/s, and the speed
of sound through pure water is 1440-1480 m/s (Kieffer et al. 1977). Thus the presence of
both phases dramatically reduces the speed of sound through the fluid, allowing choked
flow to be reached at much lower velocities compared to either fluid alone. Choked flow
of gas at the exit orifice from a high pressure to a low pressure helps to break the liquid
ligaments into small droplets.
Two main characteristics of effervescent nozzles that distinguish them from other
types of atomization are:
Gas takes up a portion of the exit orifice area, reducing the area for liquid to flow
through. This helps to elongate the liquid into thin ligaments that can be easily broken
apart.
A large pressure drop occurs at the orifice exit where gas bubbles or gas slugs
expand. The expansion of the gas shatters the ligaments of liquid into small droplets. The
higher the pressure of the atomization gas inside the nozzle, the greater the expansion of
the gas upon exiting the orifice, and the smaller the resulting liquid droplet size.
Huang et al. (2008) investigated the flow pattern inside an effervescent nozzle
using a high speed camera. The authors identified three different flow regimes that exist
inside the nozzle: bubbly flow, intermittent, and annular flow. Bubbly flow is
characterized by the presence of gas bubbles inside the nozzle, which remain separated as
the gas-liquid mixture travels towards the orifice exit. Bubbly flow is stable, in that the
flow pattern does not change with time. Bubbly flow tends to occur at very low
gas-to-liquid ratios (GLR<3%). The authors note that at low GLR, the Sauter mean diameter
(SMD) of the droplets tends to be much larger when compared to higher GLRs.
An intermittent flow regime occurs as the GLR is increased past 3%. Intermittent
flow regimes are characterized by the formation of bubbles inside the mixing chamber,
followed by the formation of an annular flow regime at a later time. The two regimes
switch back and forth with time and form pressure instabilities within the mixing
chamber.
Further decrease in the liquid flow rate (or rise in GLR) leads to the formation of
an annular flow regime. This regime is characterized by the formation of a central gas
rich flow surrounded by an annulus of liquid inside the nozzle mixing chamber. A gas
forms an interface with the gas around the gas slug. As the gas slug grows in size,
pressure instability develops causing the interface to break and liquid to penetrate into the
center of the mixing chamber. This occurs in a periodic fashion, causing intermittent
pulses of gas and liquid to flow through the exit orifice. The transition from the
intermittent flow to annular flow regime is dependent upon the operating pressure of the
nozzle.
For Fluid Cokers, an important characteristic of the spray produced by the spray
nozzle is the Sauter-mean diameter of the droplets. Base et al. (1999) indicates that the
probability of a collision between a bitumen droplet and coke particle is maximized when
the diameter of the liquid droplet and coke particle is approximately equal. Smaller
droplets will form when the operating pressure of the two phase flow is increased or the
liquid flow rate is decreased. A compromise must be met between the droplet size, the
spray penetration length, and the mass flow rate of atomization gas used.
1.4 Review of Liquid Distribution and Liquid/Solid Mixing
Measurements Methods in a Fluidized Bed
The distribution of injected liquid inside a fluidized bed is essential for efficient
reactor performance, as a better distribution of liquids leads to a larger reaction surface
and reduces the tendency of solids to agglomerate together. Several researchers have
developed methods to measure the quality of liquid/solid interaction inside a fluidized
bed in order to quickly assess the performance of spray nozzle geometries and operating
conditions.
Knapper et al. (2003) developed a method to investigate the liquid distribution
produced by spray nozzles inside a hot model Fluid Coker. A pulse of copper
naphthenate tracer was added to a stream of gas-atomized bitumen, which was ejected
through a spray nozzle into a hot fluidized bed of coke particles. Upon entrance into the
reactor, the bitumen reacted on the coke particle surface, leaving traces of copper.
Samples of coke were retrieved from the vessel and were tested for bulk copper
concentration (using Inductively Coupled Plasma) and individual particle copper
concentration (using energy dispersive X-ray analysis). Analysis of copper concentration
copper, and therefore had not been in contact with bitumen. This led the authors to
believe that the current Fluid Coker nozzles were ineffective at evenly distributing liquid
among the fluidized coke particles. The results identified a need for further research to
improve the spray nozzle performance.
The technique developed by Knapper et al. (2003) was effective at evaluating
spray nozzle performance; however, it is costly (due to the parts required for a pilot scale
hot model Fluid Coker), and time consuming (due to the need to remove all coke particles
after each test). As a result, researchers looked for alternative ways to investigate spray
nozzle performance using a cold model (usually using sand to represent coke, water to
represent bitumen, and air to represent steam).
Leach et al. (2008) developed a new method to quickly evaluate the performance
of aerated spray nozzles in a cold model fluidized bed using a triboelectric charge
technique. Fluidized silica sand particles were charged due to random collisions with the
wall of the vessel. Water was injected through a converging-diverging spray nozzle, and
shortly after, the bed was defluidized. The charges that had accumulated on the sand
particles flowed through conductive paths in the sand created by moisture. The current
travelled to an electrode installed inside the vessel, where it was converted to a voltage
signal, amplified, and sent to a data acquisition system. A higher current measurement
corresponded to more pathways for the charges to travel, and hence indicated better
liquid distribution. The authors used this technique to measure the performance of two
different variations of a Fluid Coker spray nozzle, and results agreed with past
experimental data. The advantage of this technique was that spray nozzle liquid
distribution data could be quickly obtained at a relatively low cost. The drawbacks were
that the technique was only applicable to scaled down spray nozzles, and that only one
electrode was used, meaning only local liquid distribution could be measured. As well,
the accumulation of charges on the solid particles is dependent on the local
hydrodynamics of the bed, which may vary significantly due to the variation in liquid
distribution produced by different spray nozzles.
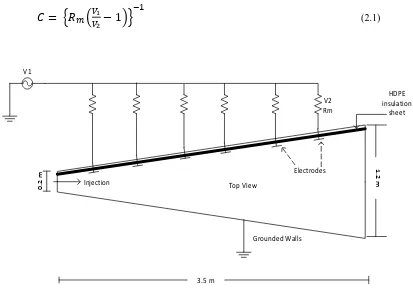
Portoghese et al. (2008) expanded upon the triboelectric charge technique by
sprayed inside. A rod electrode was placed inside the fluidized bed, in series with a
measurement resistor and a power supply. The walls of the bed were grounded to
complete the circuit. After liquid was injected, and the bed was defluidized, current
passed from the power supply through the measurement resistor, electrode, and wetted
sand particles, to ground. A voltage reading across the measurement resistor was
amplified and recorded. Using Ohm’s Law, the conductance of the bed could be
determined. The intensity of the conductance inside the fluidized bed related to the
moisture distribution inside the bed. A higher conductance corresponded to better liquid
distribution. Portoghese et al. developed this method using only one electrode, limiting its
capability of measuring the average moisture distribution throughout the fluidized bed.
Farkhondehkavaki et al. (2012) also used the conductance technique to investigate
the jet bed interaction and liquid distribution in a fluidized bed. The authors compared the
results obtained using a metallic rod electrode (which protruded through the length of the
fluidized bed), and the results obtained using non-intrusive metallic plates (which were
installed with insulation on one side of the fluidized bed). After adjusting the
gas-to-liquid ratio of the gas-to-liquid injection in the fluidized bed, the authors found a similar
conductance trend was observed using both types of electrodes. It was also found that the
conductance measurements observed using the rod electrode was systematically higher
than the conductance measurements observed using the plate electrodes. The authors
attributed the difference in conductance readings to the fact that the rod electrode may
influence the quality of fluidization near the center of the vessel, causing agglomerates to
break around the electrode. As well, it was suggested (and verified) that the distribution
of liquid throughout the fluidized bed was not even.
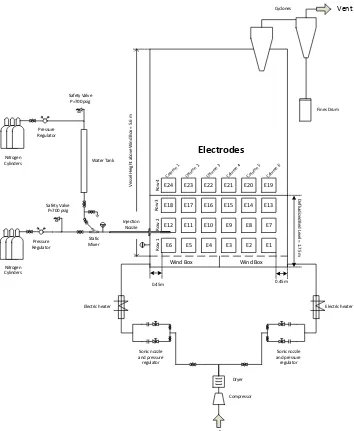
Zirgachian et al. (2013) expanded upon the conductance technique investigated by
Farkhondehkavaki et al. (2012) by adding multiple rows of square plate electrodes to the
wall of a fluidized bed, while keeping the opposite wall grounded. The plate electrodes
were advantageous over previously used rod electrodes in that they were non-intrusive
(they did not affect fluidization hydrodynamics). As well, using multiple electrodes, the
authors were able to create contours of the uneven liquid distribution throughout the
vessel, as well as obtain average bed moisture readings. The method was carried out on a
were eliminated. The method proved useful in determining the effect of gas-to-liquid
ratio on liquid distribution throughout a fluidized bed.
As an alternative to measuring the bed conductance, Mohagheghi et al. (2013)
used capacitance electrodes in a similar fashion to the conductance electrodes used by
ZirGachian et al. (2013). Due to the large difference in dielectric constants between
water, sand, and air, the authors were able to measure the free moisture content (the
liquid content inside a fluidized bed not trapped in agglomerates) throughout the
fluidized bed based on the capacitance measurement of the bed at various locations. This
method is advantageous as the capacitance electrodes are non-invasive, and therefore do
not alter the fluidized bed hydrodynamics. Since the capacitance of the bed does not vary
if liquid is trapped inside agglomerates, this technique was valuable in determining the
rate of moisture released from agglomerates, as only free moisture could be measured. By
monitoring the evaporation rate of water from the fluidized bed, and the capacitance of
the bed with time, the authors were able to track the amount of moisture trapped in
agglomerates as a function of time, and to identify the effect of bed hydrodynamics on
the rate of liquid released from agglomerates.
1.5 Research Objectives
The preceding review has covered various aspects of the Fluid Coking process,
including agglomerate formation and stability, spray nozzle performance, and
measurement of liquid distribution inside fluidized beds. The major objective of this
thesis is to further understand and improve the performance of a Fluid Coker nozzle
applied to gas-liquid injection inside a fluidized bed. The performance of the nozzle will
be evaluated by measuring the rate of liquid released from the agglomerates formed by
the spray. The following steps will be taken to achieve the objective:
1. Develop a method to measure the rate of liquid released from agglomerates
inside a fluidized bed. The method will expand upon the technique developed
by ZirGachian et al. (2013) which used bed conductivity to measure the
distribution of liquid inside a fluidized bed.
2. Use the method developed in step 1 to test the performance of a standard Fluid
3. Use the method developed in step 1 to compare the performance of spray
nozzles with altered internal geometry due to erosion.
4. Use the method developed in step 1 to compare the performance of new spray
nozzle designs based on previous experimental research.
5. Identify the features of the sprays produced by each nozzle tested to provide a
recommendation as to how to improve Fluid Coker nozzle performance based
on experimental evidence.
1.6 References:
Aminu, M.O., Elliott, J.A.W., McCaffrey, W.C., Gray, M.R. (2004) “Fluid Properties at
Coking Process Conditions”, Industrial & Chemistry Engineering Research, vol.
43, no. 12, pp. 2929-2935.
Base, T.E., Chan, E.W., Kennett, R.D., Emberley, D.A. (1999) U.S. Patent 6,003,789.
Washington, D.C.: U.S. Patent and Trademark Office.
Bruhns, S., Werther, J. (2005) “An Investigation of the Mechanism of Liquid Injection
into Fluidized Beds”, Particle Technology and Fluidization, vol. 51, no. 3, pp.
766-775.
Canada National Energy Board. (2004) “Canada oil sands: opportunities and challenges
to 2015. An energy market assessment”. Calgary: Publications Office.
Chan, E., Knapper, B., Mueller, E., McMillan, J., Tyler, J., Kiel, D., Rathna, P.D. (2012)
United States Patent Application Publication No. US 2012/0063961 A1. Washington,
D.C.: U.S. Patent and Trademark Office.
Chan, E.W., McDougall, S., Knapper, B. (2006) U.S. Patent 7.025,874 B2, Washington,