ASSESSMENT OF HUMAN EXPOSURE TO NATURAL SOURCE OF RADIATION ON THE SOIL IN TONGAREN CONSTITUENCY OF BUNGOMA COUNTY,
KENYA
MUSAMALI ENOCK WANJALA [B.ED. (SC)] I56/CE/26603/2011
A thesis submitted in partial fulfillment of the requirements for the award of the Degree of Master of Science (Physics) in the school of Pure and Applied science of Kenyatta University
DECLARATION
This thesis is my original work and has not been presented for the award of a degree or any other award in any university
Musamali Enock Wanjala Sign………Date……….. (I56/CE/26603/2011)
Department of Physics, Kenyatta University, P.O.BOX 43844, Nairobi, Kenya.
This thesis has been submitted for examination with our approval as university supervisors.
Dr. Nadir O Hashim Sign………Date……….. Department of Physics,
Kenyatta University, P.O.BOX 43844, Nairobi, Kenya.
Dr Merenga A Sarroney Sign………Date……….. Department of Physics,
DEDICATION
ACKNOWLEDGEMENT
I sincerely thank my supervisors Dr. Nadir O Hashim and Dr. Merenga A Sarroney for their consistent guidance, encouragement and support during my research. Their continuous motivation and encouragement gave me the drive to tirelessly work on this research. Their experience in the field of study enriched the outcome of my work.
I give a lot of gratitude to my dear wife for her support and sacrifice to ensure that I dedicate my time and family resources to this work. The whole of my family continuously encouraged me to move step by step without giving up in order to accomplish the goal of research.
My appreciation goes to my colleagues in Physics department for their support in laboratory work and thesis writing. All the lecturers and other staff members of the physics department of Kenyatta University have been of great help to my success in research. I give them a lot of credit and wish them the blessing of God upon their life and work.
The greatest thanks to the authority and maize farmers in Tongaren Constituency for allowing me to collect the soil sample in their farms.
TABLE OF CONTENTS
DECLARATION ... ii
DEDICATION ... ………..iii
ACKNOWLEDGEMENTS ... iv
TABLE OF CONTENTS ...v
LIST OF TABLES ... ix
LIST OF FIGURES ...x
ABBREVIATIONS AND ACRONYMS ... xii
ABSTRACT ………xiii
CHAPTER ONE...1
INTRODUCTION ...1
1.1 Background to the study ...1
1.2 Tongaren Constituency ...4
1.3 Statement of the research problem ...5
1.4 Hypothesis . ………5
1.5 Objectives ……….6
1.5.1 General objective...6
1.5.2 Specific objectives ...6
1.6 Rationale ………...6
CHAPTER TWO ………7
LITERATURE REVIEW………....7
2.1 Geology of Tongaren Constituency .. ………7
2.2 Radiation in the Environment...7
2.3 Radionuclide Measurements ...9
CHAPTER THREE ………..13
THEORETICAL CONCEPTS IN GAMMA-RAY SPECTROMETRY ... 13
3.1 Introduction ... 13
3.2 Emission of gamma-ray photons ... 13
3.4 Gamma ray interactions with matter ... 16
3.4.1 Photoelectric effect ... 17
3.4.2 Compton scattering... 19
3.4.3 Pair production ... 20
3.5 Photon beam attenuation ………...……. 21
3.6 Radiological effects of ionizing radionations ……….... 21
3.6.1. Deterministic effects ... 22
3.6.2 Stochastic effects ... 22
3.6.3. Effects of radiation on the embryo and foetus ... 24
3.6.4 Acute versus late tissue or organ effects ... 24
3.6.5 Somatic and genetic effects ... 24
3.7 Dosimetric quantities ... 25
3.7.1 The Roentgen ... 25
3.7.2 Absorbed dose ... 26
3.7.3 Relative Biological Effectiveness (RBE) ... 26
3.7.4 Equivalent dose ... 27
3.7.5 Effective dose ... 27
3.8 NaI (Tl) detector system ... 28
CHAPTER FOUR ... 30
MATERIALS AND METHODS ... 30
4.1 Sampling of the soil. ... 30
4.2 Sample preparation ... 32
4.3 NaI (Tl) γ-ray spectrometer ... 32
4.4 Experimental procedures ... 33
4.4.1 Calibration of gamma-ray spectrometer ... 33
4.4.2 Background measurement ... 35
4.4.3 Energy resolution of NaI (Tl) detector ... 35
4.4.4 Counting efficiency ... 37
4.4.5 Energy spectrum from NaI (TI) ... 38
4.5 Analysis of samples ... 43
4.6 Activity concentration ... 44
4.7 Calculations of radiological parameters ... 45
4.7.1 Radium equivalent activity ……….………. 45
4.7.2 External hazard index ……….……….. 45
4.7.3 Internal hazard index………...……….. 46
4.7.4 Absorbed gamma radiation dose rate ………..……… 46
4.7.5 Annual effective dose ……….. 47
4.8 Quality assurance and control ... 47
CHAPTER FIVE………..49
RESULTS AND DISCUSSIONS ... 49
5.1 Activity concentrations of natural radionuclides ... 49
5.2 Radium equivalent Activity ... 53
5.3 Hazard Indices ... 55
5.4 Dose rate ……….56
5.5 Annual effective dose rate ... 57
5.6 Statistical data analysis ... 58
CHAPTER SIX ... 59
CONCLUSIONS AND RECOMMENDATIONS ... 59
6.1 Conclusions ... 59
6.2 Recommendations... 60
REFERENCES ... 61
APPENDIX I ………65
APPENDIX II.. ... 66
APPENDIX III ... 67
APPENDIX IV. ... 68
APPENDIX V ………...69
APPENDIX VI ………..70
APPENDIX VII ... 71
LIST OF TABLES
Table 4.1: The fit parameters for the polynomial regression for energy
calibration of NaI(Tl) detector used in this work. ... 344 Table 4.2: Parameters obtained by Gaussian fit of 137Cs full energy
peak using equation 4.2 ... 366 Table 4.3: Emission probabilities, detector efficiency and lower
detectable limit values using RGMIX measured in this work. ... 388 Table 5.1: Activity concentration of the natural radionuclides 40K , 238U
and 232Th measured in this work. ... 500 Table 5.2: Activity concentration of radionuclides in Tongaren
Constituency compared with other researchers in Kenya ... 52 Table 5.3: Shows the value of radiological parameters that was obtained
in the soil samples of Tongaren Constituency. ... 533 Table 5.4: shows the world average and maximum acceptable safety
healthy limit of radiological parameters ... 54 Table 5.5: Statistical analysis of activity concentration of soil samples
from maize farms of Tongaren Constituency, analyzed in this work. ... 58 Table A1: Tissue weighting factors (ICRP, 1990). ... 67 Table A2: Radiation weighting factors (UNSCEAR, 2000) ... 68 Table A3: World average external exposure dose rates calculated from
the average activity concentration of radionuclides in soil
(UNSCEAR, 2000). ... 69 Table A4: Estimate of annual effective dose rate from some common
LIST OF FIGURES
Figure Caption Page
Figure 1.1: Typical annual exposure to all sources of radiation in the world …………...3
Figure 3.1: Decay scheme of 40K………...14
Figure 3.2: Secular equilibrium of a parent and daughter radionuclide………15
Figure 3.3: Relative predominance of photon interaction processes……….17
Figure 3.4: Mechanism of photoelectric effect………..18
Figure 3.5: Mechanism of Compton scattering………..19
Figure 3.6: Mechanism of pair production………....20
Figure 3.7: Gamma rays from radioactive source being detected by NaI (Tl) Scintillation……….29
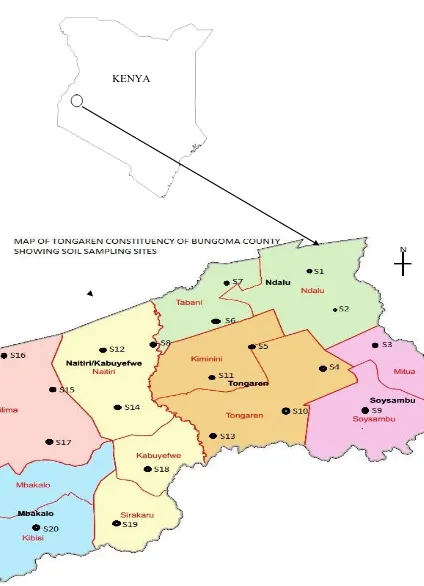
Figure 4.1: Map of Tongaren Constituency showing sampling sites……….31
Figure 4.2: A block diagram of a typical system of gamma ray spectroscopy…………. 32
Figure 4.3: A typical gamma ray spectrum of 137Cs and 60Co………...33
Figure 4.4: A second order polynomial fit to calibration energy for NaI (Tl) detector used in this work………...34
Figure 4.5: Full energy peak of 137 Csmeasured in this work………...36
Figure 4.6: The graph showing the activity of the source against the energy of gamma ray spectrum for 137Cs………39
Figure 4.7: The spectrum of 232Th before decomposition………..41
Figure 4.9: Gamma ray spectrum of the soil sample measured in this work……….42 Figure 4.10: Gamma ray spectrum of the background measured in this work………….42 Figure 4.11: Gamma ray spectrum of soil sample measured in this work after
background subtraction………..43 Figure 4.12: A typical sample spectrum measured in this work showing selected
region of interest (ROI)………..44 Figure 5.1: Activity concentrations of the three primordial radionuclides in soil
samples measured in this work………...51 Figure 5.2: The values of radium equivalent activity against sampling site………..54 Figure 5.3: The bar graph of hazard indices against sampling sites of Tongaren
Constituency………...55 Figure 5.4: The dose rate (nGyh-1) against sample sites in Tongaren Constituency…….56 Figure 5.5: A bar graph of annual effective dose rate (mSvy-1) against sample sites……57 Figure A1:A photograph showing data acquisition of the soil gamma ray spectrum
ABBREVIATIONS AND ACRONYMS
ARa Activity concentration of Radium- 226
ATh Activity concentration of Thorium- 232
AK Activity concentration of Potassium- 40
D Absorbed Dose rate in air Eair Annual effective Dose Rate
EPA Environmental protection Agency f Dose to risk conversion factor FWHM Full Width at Half Maximum He External Hazard index
Hi Internal Hazard Index
IAEA International Atomic Energy Agency
IARC International Agency for Research on Cancer ICRP International Commission on Radiation Protection MOH Ministry of Health (Kenya)
NEMA National Environmental Management Committee (Kenya) NFP National Food Policy (Kenya)
PCC Public Complain Committee (Kenya)
ABSTRACT
Radionuclides are unstable nuclei with high ratio of proton to neutron. Natural activities like volcanic eruption and anthropogenic activities expose originally concealed radioactive elements in the rocks within the earth crust. Poor agricultural practices such as excessive use of fertilizers add radioactive elements in the soil. Transport agents like run-off water and rivers, spreads these radionuclides within the soil in Tongaren Constituency. The radionuclides disintegrate to form lighter atoms by emitting radiations like alpha, beta and gamma rays. Gamma rays penetrate in to human tissue causing cancer, tumor, fibroites and lens opacification. The greatest effect of radiations was felt during Nagasaki and Hiroshima bomb where more than 40,000 people lost life in 1945 (Murray et al., 2000). Tongaren constituency is situated between latitude 000 34’ 00’’ N and longitude 340 34’ 00’’ E. The increasing cases of cancer has been an issue of global concern and with little information on the level of radionuclides in Tongaren constituency this research is conducted out to find out whether the soil is safe for human being. Agriculture being a major source of income in Tongaren the use of inorganic fertilizers containing radioactive elements, in maize production may lead to gradual accumulation of radionuclides. When radionuclides accumulate beyond the threshold level they pose danger to health of human being. This study determined the concentration levels of radionuclides in Tongaren constituency of Bungoma county. Twenty samples of soil were collected from maize plantation areas. Three adjacent soil samples were mixed up from each sampling point to get twenty representative (composite) soil samples. The soil samples were dried at 1100C, grounded and sieved through wire mesh of diameter 0.5mm and packed in plastic beaker that were sealed to prevent leakage of radon. The soil samples were kept for 28 days for secular equilibrium to be reached between the activity of uranium, thorium, potassium, radium and their progeny. The activity concentration level for 226Ra, 232Th, 238U and 40K in soil samples were determined using gamma ray spectrometer with NaI (Tl). The average activity concentration for 232Th, 238U and 40K was found to be 85.0±4.3 BqKg-1 within the range (13.1-212.4), 260.3±13.0BqKg-1 within the range (34.6-484.8) and 981.5±49.1 BgKg-1 within the range (9.7-2178.5) respectively. The average radium equivalent activity was found to be 456.4±22.8 BqKg-1 while external and internal hazard indices were found to be 1.24±0.06 and1.94±0.10 respectively. According to European commission, (1999), values of index He≤ 2
corresponds to a dose rate criterion of 0.3 mSvy-1, whereas 2≤ He ≤ 6 correspond to 1.0
CHAPTER ONE
INTRODUCTION 1.1Background to the study
The concern on the environmental pollution caused by radiations has increased in the recent years. According to United Nations Scientific Committee on the Effects of Atomic Radiation (UNSCEAR, 2000) more data on exposures from natural, man-made and occupational sources at low levels are needed. Hereditary effects of radiation on human population are still not properly quantified (UNSCEAR, 2002). Three main contributors to radiation doses from natural radiation to human body are cosmic rays, terrestrial gamma-radiation and potassium-40 within the body itself. Assessment of radiation doses in humans from natural sources and inorganic fertilizers is of special importance because their collective dose to world population is by far largest contributed by natural radiation (UNSCEAR, 1988). Exposure of human beings to ionizing radiation from natural sources and inorganic fertilizer is a continuous and inevitable occurrence on the earth.
al.,2008). The concentration of uranium and thorium are increased in environment due to these fertilizers. Usually fertilizers are considered as a technologically enhanced source of natural radiation (Abbady et al., 2008).
Gamma radiation from radionuclides with half-lives comparable to the age of the earth such as 40K and radionuclides from the progeny of 238U and 232Th series are the main contributors of external source of irradiation to human body. Of these naturally occurring radionuclide material (NORM) potassium is the most abundant and is found in earth’s crust on average of 2.6%, while uranium and thorium are present in levels of parts per million (Sunaree et al., 2011). The nuclides existing in bedrock are weathered off; chemically or physically and through transportation are finally deposited in farms without rocks. Human activities like mining, use of inorganic fertilizers in farming and processing increases the concentration both in end products or wastes to produce technologically enhanced naturally occurring radioactive material (TENORM). These radionuclides contribute to enhanced radiations exposure to human beings and animals.
Figure 1.1: Typical annual human exposures (mSv) to all sources of radiation worldwide (WHO, 2012).
Human beings are affected by exposure to ionizing radiations. While some level of exposure to ionizing radiations can be permitted, excessive exposure can injure and even be fatal. The knowledge of the absorbed dose rates at environmental level is necessary in determination of stochastic effects (Yoshimura et al., 2004). The study of the distribution of the primordial radionuclides (238U, 232Th and 40K) and their daughters allows the understanding of the radiological implications of these elements due to the gamma ray exposure to the body (Xinwei and Zhang, 2006). Determination of the background levels in soil samples is used to obtain the absorbed dose rate in air.
15.7% 12.7% 0.98%
19.9%
9.48%
41.2% Radon & Thoron (Inhalation exposure) Internal exposures (Ingestion exposure) Medical sources
Others (Human made sources) Cosmic
1.2 Tongaren Constituency
Tongaren constituency is on the northern region of Bungoma County. It is situated
between latitude 000 34’ 00’’ N and longitude 340 34’ 00’’ E . The area under study has a
land surface area of 371 km2 with an approximate population of 187 000 people.
Tongaren constituency has a total land surface area of 378.30 Km2 when water bodies are
included. The population density is 494.7 people per Km2. It has three major rivers:
Kiminini, Nzoia and Kibisi. The constituency has five hills: Bunambo, Sikuku, Sikulu,
Milimani and Matukhuli which contain granitic and metamorphic rocks. The rocks
contain calcium, phosphorous, potassium, uranium, thorium among other mineral salts.
Through the process of erosion, the minerals are distributed by surface water to the farms
where agricultural activities are carried out.
Farming is the main source of income for people living in Tongaren Constituency. The
crops grown are maize, beans, sugarcane, bananas, coffee, sunflower and coffee. The
major crops grown are maize and sugarcane. Approximately 14000 tonnes of inorganic
fertilizer containing calcium, phosphorous, uranium, thorium and potassium is applied in
the soil of Tongaren constituency on a yearly basis. The type of soil found in the region is
pedocals, chermozems, vertizols, nitosols, phenozems and hydromorphic, oxisols,
ferrasols, fluvisol, andasol, sand, loam and clay. The soil is also used in construction of
houses where human beings dwell.
standards and guidelines for the use and management of the soil and fertilizers (Turhan et al., 2008). The results of the present study may be useful as baseline data for futuristic purpose.
1.3 Statement of the research problem
Environmental monitoring and assessment is important in regulatory and advisory policy making for the safety of the public due to radiation exposure. Some studies have been carried out to assess the levels of radiations in Kenya. Some of the studies are in areas of high background radiation (Kebwaro, 2009) and those of economic interests like marine environment (Hashim, 2001) and mining (Osoro et al., 2011).
Crop farming being the major source of income in Tongaren constituency have increased the use of in organic fertilizers that contain radionuclides. There is little data on the concentration levels of radionuclides and extent of radiation levels in Tongaren constituency caused by natural and anthropogenic processes. The findings of this work therefore provide the necessary information on the concentration levels of radionuclides and their contribution to external dose within Tongaren constituency. The research findings will be useful to organizations like NEMA, NFP, KBS, UNSCEAR, PCC and MOH in environmental monitoring and measures for radiation effect control.
1.4 Hypothesis
1.5 Objectives
1.5.1 General objective
The main objective of this research is to assess human exposure to natural sources of radiation on the soil in Tongaren constituency.
1.5.2 Specific objectives
i. To measure the activity concentration of naturally occurring radionuclides (238U,
232
Th and 40K) in soils in Tongaren constituency of Bungoma county.
ii. To calculate the radiological parameters like radium equivalent dose, hazard indices and absorbed dose rate due to soil samples.
iii. To estimate the radiological hazard of human exposure to gamma rays from soil.
1.6 Rationale
CHAPTER TWO
LITERATURE REVIEW
2.1 Geology of Tongaren Constituency
The Constituency of Tongaren has five hills: Bunambo, Sikuku, Sikulu, Matukhuli and Milimani. Granitic and metamorphic rocks are the type of rocks found in these hills. The granite, igneous rock is of visible crystalline formation and texture. It is composed of feldspar (usually potash feldspar and oligoclase) and quartz, with a small amount of mica (biotite or muscovite) and minor accessory minerals, such as zircon, apatite, magnetite, ilmenite, and sphene. Granite is usually whitish or gray with a speckled appearance caused by the darker crystals. Potash feldspar imparts a red or flesh color to the rock. Granite crystallizes from magma that cools slowly, deep below the earth's surface. Exceptionally slow rates of cooling give rise to a very coarse-grained variety called pegmatite. Granite, along with other crystalline rocks, constitutes the foundation of the continental masses, and it is the most common intrusive rock exposed at the earth's surface in Tongaren Constituency. The Southern part of Tongaren Constituency is Hilly with steep slopes in some parts of the farm. The Northen part of Tongaren is slightly sloppy and is closer to rift valley. River Nzoia and Kiminini deposit silt from granitic and metarmophic rocks of Mt Elgon and Chereng’ani Hill to their banks adding mineral salts to the soil in Tongaren Constituency.
2.2 Radiation in the Environment
Radiation sources in the environment can be divided into;
(ii) Anthropogenic sources: - these are from nuclear related technology, inorganic fertilizer and other human activities.
Natural environmental radiations mainly depend on geological and geographical conditions. Depending on composition of the rocks the level of radioactivity varies. Rocks formed from volcanic activities like granite and pumice contain radioactive elements (Hassan et al., 2010). Naturally occurring radionuclides materials (NORM) like uranium, radium and thorium is present in a wide number of minerals that appear as crystals in granite (Turhan et al, 2008). Therefore, it is common for materials such as granite to have some amount of radioactivity. Through the process of weathering and erosion of rocks, radionuclides are introduced in the maize plantation zone of Tongaren constituency.
The water from river Kiminini and river Nzioa are used for irrigation of crops on land adjacent to their profile. The water contain radioactive material acquired by the two Rivers from granitic rocks of Mt Elgon and Chereng’ani Hill.
rocks is destroyed by action of sulfuric acid during the production of super-phosphate, concentrating the radionuclide in the final phases (Eisenbud and Gessel, 1997). Therefore the uses of phosphate fertilizers distribute radionuclide concentration in the environment.
2.3 Radionuclide Measurements
One of the global concerns has been the monitoring of environmental changes to understand the implications of various anthropogenic activities. Erosion of naturally occurring radionuclides from the rocks and inorganic fertilizers deposits a lot of radionuclides in soil in Tongaren Constituency. In order to assess the level of pollution by radionuclide, samples of soil from the maize farms are analyzed to get information on radiological effect of radiation on people working on maize farms (IAEA, 2003).
Studies on radiations in sediments have been carried out in different parts of the world in areas of economic interests like mining and tourism attraction areas. The level of radioactivity in sediment samples in ponds and oxbow lakes in the district of Jessore, Bangladesh were found to have average values of 42.9 Bqkg-1, 47.85 Bqkg-1and 502.73 Bqkg-1 for 226Ra, 232Th and 40K respectively. The average absorbed dose rate of 71.71±18.4 nGyh-1 was obtained (Kabir et al., 2008). The values are above the world averages even though they are within acceptable limits.
was aimed at establishing a baseline map of background levels in surrounding environment. Such a map is used as reference information to assess any change in the radiological background levels due to any artificial effects of radiation measurements.
In the study to evaluate the level of radionuclides in terrestrial environment of Western Ghat, the activity concentration of naturally occurring radionuclides in soil samples of an elevated radiation background area of Western Ghats were determined using gamma-ray spectrometry with the aim of evaluating the environmental radioactivity (Manigandan et al., 2014). The annual effective dose equivalent and the radiation hazard indices from the soil activity were estimated to reduce the harmful effects of gamma radiation to the population dwelling in the area. The activity concentrations of 232Th and average outdoor terrestrial gamma dose rate were found to be higher than the world average, this may affect Western Ghats environment in general. Therefore, the radiological risks to the general population from ionizing radiation from the naturally occurring radionuclides in the soil are considered to be significant. However, other radiological hazard indices were found to be within permissible limits.
A study of distribution of natural radionuclides in Songkhla beach sands, Thailand found out that the specific activity of the beach sand averaged 248±44 Bqkg-1 for 40K, 41±5 Bqkg-1 for 226Ra and 64±7 Bqkg-1 for 232Th (Kessaratikoon et al., 2007). The studies show the variations in activity concentrations of the naturally occurring radionuclides at various shores of water bodies which normally acts as sinks for radiation pollution.
A research on natural radioactivity at Minjingu phosphate rocks in Tanzania found that there was high concentrations of 226Ra of 5760 ± 107 Bqkg−1 in phosphate rock, waste rock 4250 ± 98 Bqkg−1, wild leaf vegetation 650 ± 11 Bqkg−1, edible leaf vegetation 393 ± 9 Bqkg−1, and chicken feed 4.0 ± 0.1 Bqkg−1 which suggest a radiation health risk particularly when the samples are ingested (Banzi et al., 2000). The radiation dose from ambient air over five years at the phosphate mine averaged of 1415 nGyh−1.
In a research on natural radioactivity in soil and phosphate samples from El-Sabaea, Aswan in Egypt found out that the concentration of 226Ra, 232Th and 40K ranged from 59.7±6.7 to 638±31.0, 9.9±1.4 to 40.6±6.3 and 213.1±9.5 to 798.9±30.6 in Bqkg-1 respectively (Harb et al., 2008). The studies shows phosphate rocks contain relatively high concentration of naturally occurring radioactive materials from uranium and thorium decay series.
effective dose rate in Mombasa was found to have a mean of 0.12 ± 0.01 mSvy-1 (Hashim, 2001).
CHAPTER THREE
THEORETICAL CONCEPTS IN GAMMA-RAY SPECTROMETRY
3.1 Introduction
This chapter outlines the theoretical concepts involved in natural radioactivity, gamma ray emission, gamma ray interaction with matter and detection. The biological effect of ionizing radiations is also covered in the chapter in order to provide an insight on the risk of the radiations.
3.2 Emission of gamma-ray photons
Gamma ray photons are energetic electromagnetic radiation of high penetrating and ionizing properties. Gamma rays are mostly emitted from the nucleus during radioactive decay. They can also be given off by a charged particle accelerating in an electric field, which occurs in accelerators. The decay of elements results in the emission of different radiations: alpha, beta particles and gamma rays (Grupen, 1998). Gamma rays have their origin in the excited states of the nuclei after the emission of α or β particles or after nuclear reactions. In gamma decay, a nucleus goes from excited state to a state of lower energy and the energy difference between the two states is released in form of a photon (L’annunziata, 2003). Equation 3.1 shows an example of gamma emission for an element X of atomic number Z and mass number A;
+ (3.1)
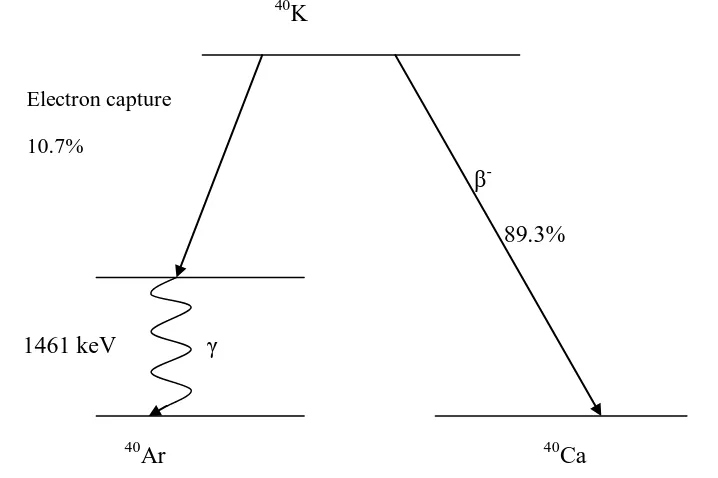
In 40K with half-life of 1.3 × 10⁹ years, it decays with 89.3 % by emission of β- to 40Ca and 10.7 % by electron capture to an excited state of 40Ar. Then later decays to its ground state by emission of γ-ray of energy 1460 keV. Fig 3.1 shows the decay scheme of 40
K. 40K
β-
89.3%
1461 keV γ
40Ar 40Ca
Figure 3.1: Decay scheme of 40K
Appendix I and II shows decay series of 232Th and 238U (Gilmore, 2008)
3.3 Secular equilibrium
The rate of decay of any radionuclide is proportional to the number of atoms present in the source i.e., the activity A is directly proportional to the number of atoms, N of nuclides present (equation 3.2);
= λN (3.2) Electron capture
where λ is decay constant. Activity of radionuclide after time t is given by the equation 3.3;
= (− ) (3.3)
where is the initial activity of the source. The relationship between parent and daughter activity is given by equation 3.4 (Podgorsak, 2005);
(3.4)
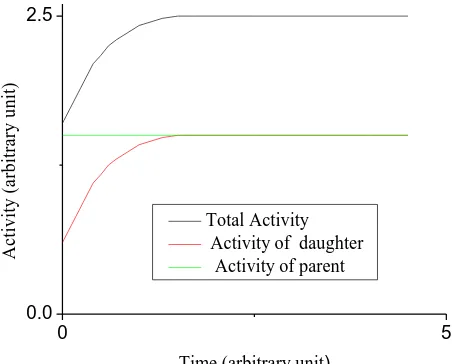
when ( 1/2) ≪ ( 1/2) then ≫ and ≅ i.e., the activity of the daughter is
approximately equal to that of the parent. The state is referred to as secular equilibrium. This is normally achieved in a closed system hence secular equilibrium in the decay series. This is shown in figure 3.2
Figure 3.2: secular equilibrium of a parent and daughter radionuclide (Gordon, 2008)
0 5
0.0 2.5
A
c
ti
v
it
y
(
a
rb
it
ra
ry
u
n
it
)
Time (arbitrary unit)
3.4 Gamma ray interactions with matter
Gamma rays are photons that originate from the nuclei of radioactive atoms undergoing
decay. They have no mass and no charge. They are quanta of electromagnetic energy that
travel at the speed of light and can travel long distances in air un-attenuated. When these
photons interact with matter, free electrons are generated and as these electrons are slowed
down by matter, they create charge pairs. The photon detectors use the charge pairs generated
to determine the photon energy by measuring the quantity of charge produced by these pairs
(Debertin and Helmer, 1988). The knowledge of interactions of gamma rays with detector
scintillation material is essential for the understanding of how the gamma photons are
detected and attenuated in the detectors. Gamma-ray photons interact with matter in three
processes; namely
(i) Photoelectric effect,
(ii) Compton scattering, and
(iii) Pair production.
The different processes have their probability of occurring depending on the energy of the
gamma-ray and the atomic number, Z of the material. Figure 3.3 shows the relative
Figure 3.3: Relative predominance of photon interaction processes (Podgorsak, 2005).
Photoelectric effect is predominant for low energy photons and high Z materials and pair production is predominant for high energy photons and high Z materials while Compton scattering is dominant for moderate energies.
3.4.1 Photoelectric effect
In photoelectric absorption the incident photon disappears and a photoelectron is ejected from one of the electron shells of the absorber (Figure 3.4). The kinetic energy, e of the
photoelectron is given by the equation 3.5 (Rittersdorf, 2007);
Orbital electron
nucleus
Photoelectron
where ℎ is the photon’s energy and Eb is the binding energy of the liberated electron in its
original shell.
The atom is left in an excited state with an excess energy of and recovers its equilibrium in
two ways; the atom may de-excite by redistribution of the excitation energy between the
remaining electrons in the atom resulting in release of further electrons (Auger cascade)
which transfers a further fraction of total energy to detector or vacancy left by ejection of the
photoelectron may be filled by higher energy electron falling into it with emission of
characteristic X-ray fluorescence (Gilmore, 2008). Figure 3.4 shows the mechanism of
photoelectric effect.
Figure 3.4: Mechanism of photoelectric effect- the incident photon interacts with an orbital electron.
The probability that a photon will undergo photoelectric absorption is expressed as
cross-section τ, in the equation 3.6 (Podgorsak, 2005);
τ (3.6)
The significance of this equation is that heavier atoms absorbs gamma radiation for
photoelectric effect more effectively than lighter atoms.
3.4.2 Compton scattering
Compton scattering is a direct interaction of the gamma-ray with an essentially free and
stationary electron i.e., photon energy is much higher than the binding energy of the orbital
electron, transferring part of the gamma-ray energy (Figure 3.5). The energy, imparted to
the recoil electron is given by equation 3.7 (Nelson and Reilly, 1991);
= ℎ −ℎ ′ (3.7)
where ℎ is the photon’s energy and ℎ ′ is the scattered gamma-ray energy. The energy of
scattered photon as a function of scattering angle is given by equation 3.8 (Gilmore, 2008);
ℎ ′
(3.8)
Figure 3.5: Mechanism of Compton scattering- incident photon transfer part of its energy to an electron.
The absorption cross-section for Compton scattering σ is related to the atomic number of material and energy ℎ of the gamma ray by equation 3.9;
Incident photon
Recoil electron
α
(3.9)
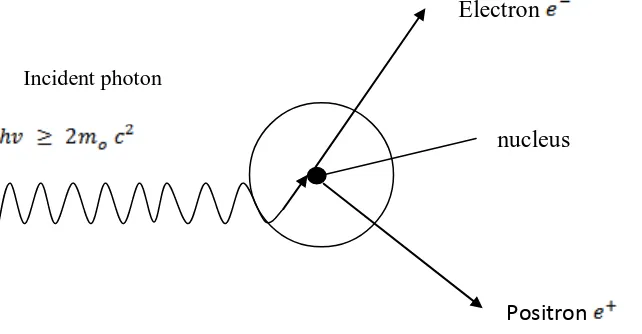
3.4.3 Pair production
Pair production results from interaction of the gamma-ray with the atom as a whole. The process takes place within the Coulomb field of the nucleus, resulting in the conversion of a gamma-ray into an electron-positron pair (Figure 3.6). The energy of the gamma-ray must be at least twice the rest mass of an electron which is 1022 keV. The electron and positron created share the excess gamma-ray energy (i.e. the energy in excess of the combined electron–positron rest mass) equally, losing it to the medium as they are slowed down.
Figure 3.6: Mechanism of pair production- the process take place at the Coulomb field of nucleus.
Figure 3.6: Mechanism of pair production- the process take place at the Coulomb field of nucleus.
The cross-section dependence for the pair production on Z is given by; (Podgorsak, 2005);
Electron
nucleus
Positron
2
(3.10)
3.5 Photon beam attenuation
The intensity I(x) of the γ-ray beam through a medium of thickness x is attenuated exponentially;
I( ) = I exp( − ) (3.11)
where Io is the intensity of the incident beam and μ is the total absorption coefficient. The absorption coefficient depends on the photon energy, atomic number Z and the density of the absorber (Groot, 2009).
3.6 Radiological effects of ionizing radiations
The knowledge on radioactivity plays an important role in health physics. There are many forms of radiations in the environment. Their sources could be natural or man-made. The radiations of more concern are the ionizing radiations. These radiations include X-rays, gamma-rays, alpha particles, beta particles, neutrons and cosmic rays. Exposures to ionizing radiations are inevitable in the environment throughout the earth. Exposure to ionizing radiations can cause health problems to humans. However carefully controlled exposures are also used for medical treatment (CPEP, 2003).
greater the effects of the ionizing radiations. Chronic exposure to ionizing radiation is continuous exposure to low levels of radiations over a long period. The effects can be observed some time after the initial exposure. Acute exposure is exposure to large, single dose of radiation or a series of doses, for a short period of time. This can cause both immediate and delayed effects.
Exposure to radiation can cause detrimental health effects that fall into one of two categories: deterministic or stochastic.
3.6.1. Deterministic effects
At large doses, radiation effects such as nausea, reddening of the skin or in severe cases, more acute syndromes are clinically expressed in exposed individuals within a relatively short period of time after the exposure; such effects are called deterministic because they are certain to occur if the dose exceeds a threshold level.
Deterministic effects are the result of various processes, mainly cell death or delayed cell division, caused by exposure to high levels of radiation. If extensive enough, these effects can impair the function of the exposed tissues. The severity of a particular deterministic effect in an exposed individual increases with dose above the threshold for the occurrence of the effect.
3.6.2 Stochastic effects
this induction is assumed to take place over the entire range of doses, without a threshold level. Hereditary effects due to radiation exposure have been statistically detected in other mammalian populations and are presumed to occur in human populations also. These epidemiologically detectable effects (malignancies and hereditary effects) are termed stochastic effects because of their random nature.
Stochastic effects may ensue if an irradiated cell is modified rather than killed. Modified cells may, after a prolonged delay, develop into a cancer. The body’s repair mechanisms make this a very improbable outcome at small doses; nevertheless, there is no evidence of a threshold dose below which cancer cannot result. The probability of occurrence of cancer is higher for higher doses, but the severity of any cancer that may result from irradiation is independent of dose. If the cell damaged by radiation exposure is a germ cell whose function is to transmit genetic information to progeny, it is conceivable that hereditary effects of various types may develop in the descendants of the exposed individual. The likelihood of stochastic effects is presumed to be proportional to the dose received, without a dose threshold.
3.6.3. Effects of radiation on the embryo and foetus
In addition to deterministic and stochastic health effects in adults, other health effects may occur in infants due to exposure of the embryo or foetus to radiation. These effects include a greater likelihood of leukaemia (stochastic effect) and, for exposure above various threshold dose values during certain periods of pregnancy, severe mental retardation and congenital malformations (deterministic effect) occurs as proposed by ICRP (2005).
3.6.4 Acute versus late tissue or organ effects
An organ or tissue expresses response to radiation damage either as an acute effect or as a late (chronic) effect. Acute effects manifest themselves soon after exposure to radiation and are characterized by inflammation, oedema, denudation of epithelia and haemopoietic tissue, and haemorrhage. Late effects are delayed and are, for example, fibrosis, atrophy, ulceration, stenosis or obstruction of the intestine. Late effects may be generic and caused by absorption of radiation directly in the target tissue, or consequential to acute damage in overlying tissues such as mucosa or the epidermis.
3.6.5 Somatic and genetic effects
The effects of radiation on the human population can be classified as either somatic or genetic:
● Genetic or hereditary effects are radiation induced mutations to an individual’s genes and DNA that can contribute to the birth of defective descendants.
Carcinogenesis expresses itself as a late somatic effect in the form of acute or chronic myeloid leukaemia or some solid tumours, for example in the skin, bone, lung, thyroid or breast. Human data on carcinogenesis have been collected from the following sources: —Low level occupational exposure;
—Atomic bomb survivors in Hiroshima and Nagasaki;
—Medical radiation exposure of patients (e.g. during treatment of ankylosing spondylitis, treatment of thyroid abnormalities and radiotherapy of cancer) and staff (e.g. radiologists in the early part of the last century).
3.7 Dosimetric quantities
The quantity of radiation received by an object is measured by several different units. Since radiation interacts with matter by ionizing or exciting the atoms and molecules making up the material, these units are either a measure of the quantity of ionization produced or the amount of energy deposited in a material.
3.7.1 The Roentgen
This is the oldest measure of exposure to gamma rays or X-rays and is defined as 1 Roentegen (R) = (2.58×10⁻⁴ Coul/Kg) in air at STP
(3.12)
Where A is the activity, d the distance to the source and r is an exposure rate constant dependent on the decay scheme of a particular source, the energy of gamma rays,the absorption coefficient in air and the specific ionization of the atoms. Appendix IV shows radiation weighting factors of some source of radiations.
3.7.2 Absorbed dose
Biological effects of radiation depend on the amount of energy imparted by radiations on an arbitrary volume of material. The mean energy ε absorbed is the sum of all the energy entering the volume of interest minus all the energy leaving the volume, taking into account any mass-energy conversion i.e. pair-production and electron-positron annihilation, within the volume. The fundamental dosimetric quantity in radiological protection is the absorbed dose . This is the mean energy absorbed per unit mass of an organ or tissue (Podgorsak, 2005) and is expressed as;
ε (3.13)
The absorbed dose is expressed in unit called Gray (Gy) and is equal to joules per kilogram. Its relationship to risk of biological effect is described by weighted dose quantities.
3.7.3 Relative Biological Effectiveness (RBE)
an equal dose of protons, electrons or gamma rays. This is attributed by the fact that different radiation has different linear energy transfer (LET). LET is the energy locally deposited per unit path length. The more ionizing the particles are the greater the local biological damage. Appendix IV shows the radiation weighting factor of various particles and their energies (ICRP, 1991).
3.7.4 Equivalent dose
Biological detriment to an organ depends not only on the physical average dose received by the organ but also on the pattern of the dose distribution that results from the radiation type and energy (Podgorsak, 2005). For the same dose to the organ α or neutron radiation will cause greater harm compared to γ-rays or electrons. Effectiveness of the given radiation in inducing health effect is expressed in equivalent dose. Equivalent dose as per equation 3.14 (UNSCEAR, 2000) is the product of the absorbed dose and the radiation weighting factor (see Appendix IV) of the radiation. The radiation weighting factors are related to the particular type of radiation and depend on the ionizing capacity and density;
( ) = ×D( ) (3.14)
3.7.5 Effective dose
factor (values in appendix III) and the sum of these products over the whole body is the effective dose, equation 3.15 (UNSCEAR, 2000);
(3.15)
3.8 NaI (Tl) detector system
Thallium activated sodium iodide [NaI(Tl)] detection system is used in the detection of gamma rays. When gamma-ray strikes the NaI(Tl) crystal some of the atoms in the crystal will become excited and emit photons (scintillation) in the ultra-violet to visible range as the atoms fall to their lower energy state. The thallium provides an additional set of energy bands in the solid that contribute to the conversion of the energy of electrons into light (scintillation photons). The scintillation photons incident on photocathode liberate electrons by photoelectric effect. The liberated electrons are accelerated by a strong electric field from high voltage in the PMT tube. As they are accelerated they collide with electrons in the dynodes releasing more electrons. This causes multiplication of electron flux (by factor of 104 or more) from its initial value. The magnitude of this charge surge is proportional to the initial amount of charge liberated at the photocathode of the PMT tube. The initial number of photoelectrons liberated at the photocathode is proportional to the amount of light incident on the phototube, which in turn is proportional to the amount of energy deposited in the scintillator by the gamma ray thus the output signal produced is proportional to the energy deposited by the gamma ray in the scintillation medium (Hastings et al., 1991; Tsoulfanidis, 1995 ).
The data collected is presented in form of a spectrum. This comprises of background radiation and photo peaks from the radionuclides present in the sample. Since a radioactive source produce gamma rays of various energies and intensities a detailed analysis of this spectral data is used to determine the identity and quantity of radionuclides present in a sample. The detector is calibrated using source of specific energy peaks like standard reference sample so that each channel is assigned specific energy values. Figure 3.7 shows the NaI(Tl) scintillation detecter being used to detect gamma rays from radioactive source.
CHAPTER FOUR
MATERIALS AND METHODS
4.1 Sampling of the soil.
MAP OF KENYA SHOWING THE LOCATION OF TONGAREN CONSTITUENCY
4.2 Sample preparation
The samples were dried in an oven at 110 0C for 8 hours to completely dry the samples. Each sample were then grinded into powder using mortar and pestle and sieved with a wire mesh with holes of thickness 0.5 mm to obtain homogenized samples (Mustapha, 1996). The samples were weighed to 500g and placed in labeled hermitically sealed polythene bags to prevent escape 222Rn and 220Rn. Each soil sample weighing 500g were kept in hermitically sealed plastic beakers for 28 days to attain secular equilibrium between 226Ra, 232Th, 238U and 40K and their progeny (Mustapha,1996).
4.3 NaI (Tl) γ-ray spectrometer
The spectrometer used for radiations detection and measurements is a 76 mm × 76 mm NaI(Tl) crystal detector coupled with a high voltage operated photomultiplier tube (PMT). An Oxford PCA-P card was used for spectral data acquisition and analysis. The gamma-ray spectroscopy system consists of a detector, electronics to collect and process the signals produced by the detector, and a computer with processing software to generate, display, and store the spectrum. The PCA-P contains high voltage (HV) power supply for amplification of the detected signals. Fig. 4.2 shows the block diagram of the typical system of gamma ray spectrometer.
Figure 4.2: A block diagram of a typical system for gamma ray spectroscopy. NaI
detector
Pre-amplifier
Amplifier Multi-Channel analyser
4.4 Experimental procedures
4.4.1 Calibration of gamma-ray spectrometer
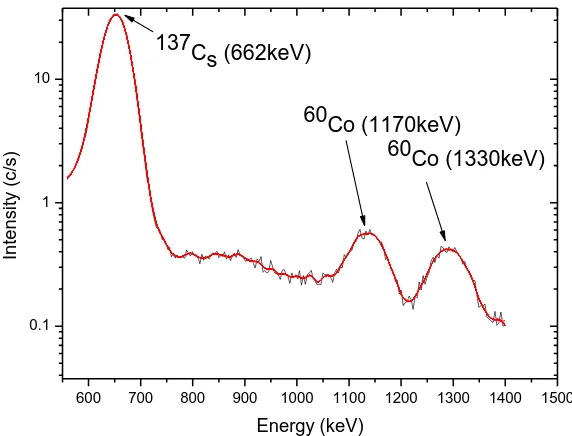
Caesium-137 and Cobalt-60 were placed on the cap of spectrometer and data acquired for 600s. The figure 4.3 show the spectrum displayed on the screen of gamma ray spectrometer when caesium and cobalt was used.
Figure 4.3: A typical spectrum of gamma ray spectrum of 137Cs and 60Co.
To calibrate the spectrometer at energy peaks of 662 keV, 1170 keV and 1330 keV, the plot of energy as a function of channel numbers (Figure 4.4) was fitted with a second order polynomial of the form given by equation 4.1. This would reduce the effects of non linearity in the energy response of the detector;
E=E0+AC+BC2 (4.1)
600 700 800 900 1000 1100 1200 1300 1400 1500 0.1
1 10
60Co (1330keV)
In
te
n
si
ty
(c/
s)
Energy (keV) 137
Cs (662keV)
where , A and B are constants and C is the channel number. The fit parameters for the calibration equation are presented in table 4.1.
Figure 4.4: A second order polynomial fit to calibration energy for NaI (Tl) detector, used in this work.
Table 4.1: The fit parameters for the polynomial regression for energy calibration of NaI(Tl) detector used in this work.
Parameter Value Error
EO 13.64868 0.68
A 3.31461 0.12
B 0.000713135 0.000079
180 200 220 240 260 280 300 320 340 360 380 600
700 800 900 1000 1100 1200 1300 1400
E
ne
rgy (
K
eV
)
Channel number
(188,662)
(326,1170)
(368,1330)
4.4.2 Background measurement
The background activity was determined by running an inert sample which comprised of distilled water in a plastic container the duration of 30000 seconds. The background intensity was subtracted from the measured intensity of the samples to obtain residual intensity for use in activity calculation.
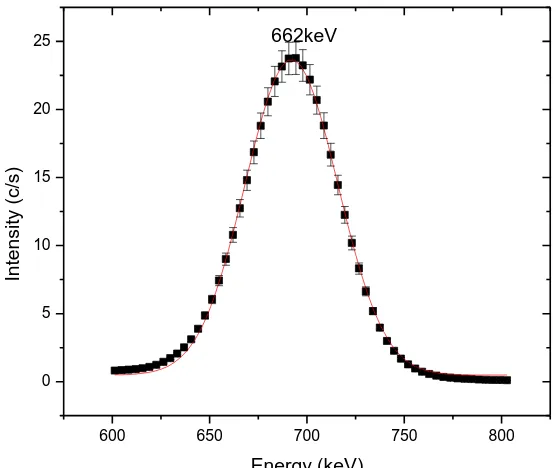
4.4.3 Energy resolution of NaI (Tl) detector
The resolution of detector is expressed in terms of the full width at half maximum (FWHM). This is the width of the gamma ray peak at half of the highest point on the peak distribution. Resolution figures are given with reference to specified gamma ray energies (Leo, 1994). In this study the energy resolution of the gamma-ray detector was obtained by fitting 137Cs full energy peak at 662 keV to a Gaussian curve of the form in equation 4.2
(4.2)
Figure 4.5: Full energy peak of 137Cs measured in this work. The solid line represents a
Gaussian fit to the data.
The fit parameters for energy resolution determination are shown in table 4.2 in which a
value of 47.07±0.29 keV FWHM was obtained
Table 4.2: Parameters obtained by Gaussian fit of 137Cs full energy peak using equation 4.2
Fit parameters Fitted values y0 (y-offset) 0.48±0.06
Xc (peak position) 661.82±0.12
W (peak width) 47.45±0.31 A (peak area) 1379.38±10.04
x2/DoF -0.09±0.005
R2 -1.00±0.05
600 650 700 750 800
0 5 10 15 20 25
In
te
n
si
ty
(c/
s)
The low resolution of the NaI (Tl) detector necessitated the choice of the photo-peaks 40K (1460 keV), 214Bi (1765 keV) and 208Tl (2615 keV) for determination of activity concentration since they are less interfered.
4.4.4 Counting efficiency
The counting efficiency, εi of the NaI(Tl) detector in respect to full energy peaks 1460 keV of 40K, 1765 keV of 214Bi and 2615 keV of 208Tl were calculated using the relation in equation 4.3.
(4.3)
where IS is the intensity of the standard reference sample (RGMIX), Ib is the intensity of
background in the same window as sample, mS is the mass of the standard reference
sample (RGMIX), ρi is the emission probability of the given radionuclide in the sample
and Ai activity concentration of a given radionuclide in RGMIX.
The detection limits, of the detector in respect to the various radionuclides were calculated using equation 4.4.
(4.4)
where ρi is the photon emission probability of the radionuclide of interest in RGMIX mS
and is the background count rate in the channel of interest. Table 4.3 shows the values of emission probabilities and detection limit of the detector for the various radionuclides analysed in this work.
Table 4.3: Emission probabilities, detector efficiency and lower detectable limit values using RGMIX measured in this work.
Radionuclide E (KeV) Activity (BqKg-1)
ρi εi % (Bq/kg)
238
U (214Bi) 1765 1260 0.161 0.002424 44.2±2.2
232
Th (208Tl) 2615 1160 0.36 0.001771 104.8±5.2
40
K 1460 5400 0.11 0.005016 305.3±15.3
4.4.5 Energy spectrum from NaI (TI)
The quality of a given scintillation counting system is characterized by its energy resolution given by the formulae;
R = FWHM/EY (4.5)
FWHM=(B-A)/EY*100 (4.6)
where R is energy resolution, EY is peak energy, A is minimum energy at FWHM and B
Figure 4.6: The graph showing activity of the source (counts per channel) against the energy of the gamma ray spectrum (channel number) for 137 Cs. (IAEA, 2004)
Figure 4.4 energy spectrum; the number of counts (within the measuring period) versus channel number. The spectrum was measured using NAI(Tl)- crystal on a photomultiplier, an amplifier, and a multichannel analyzer (Groot, 2009). The sodium iodide detector has low energy resolution typically 9.6% at photo peak energy of 662 KeV of 137Cs. The problem will be solved by decomposing the measured spectrum in to parts that appears in the decay chain of 238U, 226Ra and 232Th and the spectrum of 40K. The spectrum of the sample is presented as a sum of composing spectra of the radiation γi
of separate radionuclide, their decay products and background radiation (Muminov et al., 2005).
I=Ib+ITh+Iu+Ik (4.7)
where Ib is the background spectra intensity and Iu, ITh and Ik are the spectra intensity of 238
Inet=ITh+Iu+Ik (4.8)
For decomposition of the spectra into parts and determining of activities, standard source of 238U, 232Th and 40K will be used. The extraction of interfering components of radionuclides will be done using the stripping off method. In this method, the total absorbed dose (TAP), of the radiations of a radionuclide i1 which weakly interferes with
radionuclide will be picked. A ratio c1 between its intensity and the corresponding
intensity of the standard source E(i1) will be determined. The spectrum of the
radionuclide i1 in the sample will be given by (Muminov et al., 2005);
I(i1) =c1 E(i1) (4.9)
where I(i1) is the spectrum of the radionuclides (i1), c1 is the normalization factor and
E(i1) is the spectrum of the corresponding standard radionuclide. I(i1) is subtracted from
the spectrum that has been corrected for background;
Inet - I(i1) = Inet2 (4.10)
the procedure will be repeated for the spectra which weakly interfere with the other radionuclide in the sample. The subsequent subtraction of the interfering radionuclide will lead to the simplification of the resultant spectra.
Figure 4.7: The spectrum of 232Th before decomposition
Figure 4.8: The spectrum of 232Th after decomposition
2475 2500 2525 2550 2575 2600 2625 2650 2675 2700 2725 0.003 0.004 0.005 0.006 0.007 0.008 0.009 0.010 In te n si ty (c/ s) Energy (keV) I=0.5653±0.06512 c/s XC=2614.94±1.29keV
4.4.6 Data acquisition
The spectral data acquisition time for each sample including the standard reference sample was 30000 seconds. Figure 4.9 and 4.10 shows a typical spectrum of the soil sample and background measurements respectively.
Figure 4.9: Gamma-ray spectrum of the soil sample measured in this work.
Figure 4.10: Gamma-ray spectrum of the background measured in this work. 500 750 1000 1250 1500 1750 2000 2250 2500
1E-3 0.01 0.1 1 In te n si ty ( c /s ) Energy (keV) 208 Tl (2615) 214
Bi (1765keV) 40
K (1460keV)
500 750 1000 1250 1500 1750 2000 2250 2500 1E-3 0.01 0.1 1 In te n si ty ( c /s ) Energy (keV) 208 Tl (2615keV) 214 Bi(1765) 40
Figure 4.11: A typical gamma-ray spectrum of soil sample measured in this work after
background subtraction.
4.5 Analysis of samples
The primordial radionuclides 238U and 232Th are alpha emitters hence their activity concentration cannot be measured directly using gamma-ray spectrometer. The activity concentration of 214Bi (1765 keV) a gamma ray emitter was used to determine the activity concentration of 238U (See appendix 1 for decay series of 238U). The energy peak of 208Tl (2615 keV) was used to determine the activity concentration of 232Th. The energy peaks were chosen because they are least interfered by other peaks. This is necessary because of low resolution of the NaI (Tl) detector. The activity concentration of 40K was measured using its 1460 keV gamma ray peak. Region of interest (ROI) was carefully selected at the peak regions to obtain the net counts of the full energy peak. Figure 4.8 shows the selection of ROI for a typical spectrum of the samples.
750 1000 1250 1500 1750 2000 2250 2500 -0.02
0.00 0.02 0.04 0.06 0.08 0.10
In
te
n
si
ty
(c/
s)
A peak consists of a number of counts in adjacent channels. In order to obtain the region of interest (ROI) net area, the underlying continuum is subtracted from the gross area. The gross area is simply the summation of channel contents over all channels within the peak. The intensity of the background was subtracted to obtain residual intensity of sample for use in activity calculation. Appendix XI shows a photograph indicating selected region of interest.
Figure 4.12: A typical sample spectrum measured in this work showing selection of region of interest (ROI).
4.6 Activity concentration
The activity concentration AS of the samples was calculated using equation 4.11
(Mustapha, 1999);
A
SM
SI
R= A
RM
RI
S(4.11)
where MR, AR and IR are the mass, activity concentration and intensity of specific
radionuclide in the reference sample RGMIX respectively while MS and IS are the mass
500 750 1000 1250 1500 1750 2000 2250 2500 1E-3 0.01 0.1 1 In te n si ty ( c /s ) Energy (keV) 208 Tl (2615) 214
Bi (1765keV) 40
K (1460keV)
of the sample and the intensity of specific radionuclide in the sample under study respectively.
4.7 Calculations of radiological parameters
4.7.1 Radium equivalent activity
The radiation hazards associated with the radionuclides was estimated by calculating the radium equivalent activity (Raeq).This is weighted sum of activities of 226Ra, 232Th and 40
K basing on the assumption 370BqKg-1 of 226Ra,259 BqKg-1 of 232Th and 4810 BqKg-1 of 40K produce the same gamma radiation dose rate (Matilullah et al., 2004).
The formula below define radium equivalent (Beretka and Mathew, 1985);
Raeq =ARa +1.4286ATh +0.07692AK (4.12)
where ARa, ATh and Ak are the activity concentration of 226Ra, 232Th and 40K respectively.
The conversion constants for Thorium and potassium are 1.4286 and 0.07692 respectively.
4.7.2 External radiation hazard index
He = ARa/370 + ATh /259 + AK /4810 (4.13)
where ARa, ATh and Ak are the activity concentration of 226Ra, 232Th and 40K respectively.
According to European commission (1999), values of index He≤ 2 corresponds to a dose
rate criterion of 0.3 mSvy-1, whereas 2≤ He ≤ 6 correspond to 1m Sv y-1 which is higher
than the recommended level posing danger to the surrounding population.
4.7.3 Internal hazard index
The internal hazard index originating from short lived radon will be calculated as follows (Beretka and Mathew, 1985);
Hi = ARa /185 + ATh /259 + Ak /4810 (4.14)
where Hi is internal hazard index.
4.7.4 Absorbed gamma radiation dose rate
The activity concentration in soil compound to the total absorbed dose rate in air at unit height above the ground level is called absorbed gamma radiation dose rate. It is calculated by the equation (Abbady et al., 2005);
where Au, ATh and Ak are the activity concentration of 238U, 232Th and 40K respectively.
4.7.5 Annual effective dose
It is calculated using equation 4.16;
Eair = T.Q.D*10-6 (4.16)
where D is the air absorbed dose rate, Q is the conversion factor of 0.7 Sv Gy-1, which converts the absorbed dose rate in air to human effective dose received (UNSCEAR, 2000) and T is the outdoor occupancy time in hours for one year(4380hrs). The recommended limit for Eair is 1.0mSvy-1.
4.8 Quality assurance and control
For quality assurance and control the following measures were taken into consideration during the study;
(i) Three samples were obtained from each sampling site in order to achieve statistical representation of sampling.
(ii) During determination of intensity of the natural radionuclides a careful selection of region of interest (ROI) on the spectrum and with consistent window for all samples was ensured.
(iv) All the necessary precaution was taken in the use of tools during sampling, drying and crushing to avoid cross contamination of samples.
(v) The standard reference materials provided by IAEA used for calibration of the gamma-ray detector and calculation of activity of the samples provided a standard procedure for the analytical technique of measurement.
CHAPTER FIVE
RESULTS AND DISCUSSIONS
This study was aimed at measuring natural radioactivity levels in maize plantation farms in Tongaren constituency using NaI(Tl) detector. The soil samples were obtained from maize farms and prepared for analysis at Kenyatta University Physics laboratory. The soil samples were analysed by measuring the intensity and calculation of activity concentration, radium equivalent activity, external and internal hazard indices, the radiation absorbed dose rate and annual effective dose rate. The quantities have been determined and the results presented in tables and graphs. The results have been discussed in this chapter.
5.1 Activity concentrations of natural radionuclides
observed in sample site 20, is due to the presence of metamorphic rocks like shale, Hornblende-biotite gneiss and Quartzofeldspathic gneiss in these areas. However, a detailed geochemical investigation is required to reach at some conclusion. Table 5.1 shows the mean activity concentrations for the three natural radionuclides 232Th, 238U and
40
K in all the sampling sites.
Table 5.1: Activity concentration of the natural radionuclides 40K , 238U and 232Th measured in this work.
Activity concentrations of premordial radionuclides
in BqKg
-1Sample site
Potassium-40 Uranium-238 (Bi- 208)
Thorium- 232 (Tl-214)
1 1471.6±73.6 103.9±5.2 13.1±0.7
2 735.8±36.7 357.8±17.9 130.7±6.5
3 1210.2±60.5 484.8±24.2 120.9±6.1
4 338.9±16.9 323.2±16.2 68.6±3.4
5 1858.9±92.9 34.6±1.7 16.3±0.8
6 764.9±38.2 219.3±11.0 81.7±4.1
7 168.5±8.4 380.9±19.0 124.2±6.2
8 919.8±46.0 334.7±16.7 127.44±6.4
9 852.0±42.6 473.2±23.7 65.4±3.3
10 48.4±2.4 219.3±10.0 26.1±1.3
11 174.3±8.7 230.8±11.5 19.6±1.0
12 9.7±0.5 46.8±2.3 26.1±1.3
13 1297.3±64.9 404.2±20.2 212.4±10.6
14 697.1±34.9 161.6±8.1 147.0±7.4
15 1297.4±64.9 230.8±11.5 65.4±3.3
16 1694.8±84.7 173.1±8.7 94.8±4.7
17 1142.5±57.1 277.0±13.9 85.0±4.3
18 1558.8±77.9 230.8±11.5 65.4±3.3
19 1210.2±60.5 253.9±12.7 45.8±2.3
20 2178.4±108.9 265.5±13.3 163.4±8.2
Mean (average)
The average activity concentration for 40K is the highest, followed by 238U and 232Th being the last in sampling sites. The average activity concentrations of the three primordial radionuclides are above their respective world average values of 420 Bqkg-1, 33 BqKg-1 and 45 BqKg-1 for 40K, 238U and 232Th respectively (UNSCEAR, 2001). The southern part of Tongaren Constituency has the highest activity concentration because of the hills with granitic and metamorphic rocks that release mineral salts. The northern part of Tongaren Constituency has fairly high activity concentration because it is closer to rift valley and river Nzoia and Kiminini which originate from Mt Elgon and Chereng’ani Hills respectively which deposit a lot of radioactive material from granitic and metamorphic rocks. Through irrigation of crops in plantation areas along river Nzoia and Kiminini such radionuclides are introduced in the soil. Figure 5.1 shows a bar graph of the activity concentration of the three primordial radionuclides against sampling sites in Tongaren constituency.
Generally, the continuous use of inorganic fertilizers in maize plantations have contributed to an increase in activity concentrations of primordial radionuclides in Tongaren Constituency.
Figure 5.1: Activity concentrations of the three primordial radionuclides
0 2 4 6 8 10 12 14 16 18 20
Tongaren constituency has the highest activity concentration of 238U compared to activity concentration of other researchers in Kenya. The activity concentration of 232Th obtained in this work is lower than the one obtained at Kibwezi and Mrima Hill. Kibwezi District has the highest activity concentration of 40K compared to any other place in Kenya. For comparison of activity concentration of the three primordial radionuclides in this work and other researchers, see table 5.2
Table 5.2: Activity concentration of radionuclides in Tongaren Constituency compared with other researchers in Kenya
Activity concentration in Bq/kg
238
U 232Th 40K
Tongaren Constituency, Bungoma County (This work) 260.3±13.0 (34.6-484.8) 85.0±4.3 (13.07-212.4) 981.5±49.1 (9.68-2178.5) Kibwezi District (Mutie, 2011) 130.6±38.7 (34.4-103.2) 137.9±39.7 (57.6-219.6) 1140.4±303.9 (699.1-2203.4) Mrima Hill (Kebwaro, 2009) 207.03±113 (67.0-354.3) 500.7±20.3 (298.2-869.0) 805.38±20.7 (506.5-1108.2) Kwale T mines
(Osoro, 2007) 20.9±7.6 (7.4-40.6) 27.6±9.1 (8.4-43.6) 69.5±6.5 (31.9-114.1) Mombasa
(Hashim et al., 2004) 22.8±1.8 (14.4-33.3) 26.2±1.7 (16.7-35.2) 479.8±24.2 (372.3-648.2) Malindi