Predictive Analysis on Nutritional Disorders in Rice
Plants using Regression
B.Srividhya1, G.SudheerKumar2, K.JhansiLakshmi3 D.SandeepKumar4, L. Ravi Kumar5, Dr.J.Rajendra Prasad6
1,2,3,4
B.Tech, IV Year/Sem II,Department of Information Technology, PVPSIT 5
Assistant Professor, Department of Information Technology, PVPSIT 6
Professor, HOD, Department of Information Technology, PVPSIT
Abstract—The study of the relation of meteorological factors on
development of rice diseases has been in progress at the Central Rice Research Institute in respect of Nutrient Deficiency in rice plants. The data sets have been employed for regression Analysis for prediction of Nutritional Disorders and that leads to the analyzing the diseases based on symptoms according to the micro and macro nutritional deficiency. The Data Analysis tool has been used for the analysis of data. Here we are classifying the Nutritional Disorders which increases many Diseases according to the growth stages. The age group is in between of 1 to 125 days. The actual value and the critical values can be computed by using regression. The predictions are also been compared with the help of residual plots. The residual graphs have been correlated with the predictions.
Keywords- Growth Stage, Regression, Micro nutrients, Macro
Nutrients, Critical Values, Residual Plots
I. INTRODUCTION
Plant nutrition is the study of the chemical elements and compounds that are necessary for plant development, and also of their external supply and internal metabolism. The nutrients are classified as macro nutrients and micronutrients. Nitrogen(N), Phosphorous(P), Potassium(K) are macro nutrients and Zinc(Zn), Iron(Fe), copper(Cu), Manganese(Mn) are micro nutrients.
The lack of these nutrients in the soil cause nutritional disorders [2]. Nutritional Disorders are caused by a nutrient
deficiency or toxicity to an element or substance. The problem begins when unusual symptoms are observed on the rice plant in the field or when an extension specialist or farmer reports unusual symptoms. The unusual symptoms [3] could be caused
by diseases, insects, low or high temperatures and Nutrient Deficiencies. Some disease symptoms are easily confused with those of nutritional disorders. Diseases such as Blast, Helminthosporium, Brown spot and grassy stunt virus are common rice diseases that produce brown spots on the leaves. It is extremely difficult to differentiate between nutrient deficiency [3] and the disease caused by the bacteria or virus in
the early stages of symptom development. For this reason, it is advisable to become familiar with disease symptoms and to consult pathologists when pathogenic diseases are suspected.
The goal of the nutrient deficiency treatment is to increase the applications of nutrients in the soil and to increase the plant growth. The nutrient deficiencysymptoms could also be caused by the wrong management practices done by a farmer himself, such as insufficient application of chemicals. When the plants are deficient in nutrients, a systematic method of observing the major plant parts such as plant height, tillers, leaves and roots etc., are used for diagnosing nutritional disorders. Stunted growth in plant height, reduced tiller number in tillers, chlorosis, necrosis (brown spots) and orange discoloration are the common symptoms of nutrient deficiency. The mobility of nutrients within the plant and the position of the leaf on which the deficiency symptoms appear are interrelated. For a nutrient whose mobility is low, symptoms normally appear on upper leaves because the nutrient fails to movie from lower to upper leaves where it is needed for active growth [3]
The early stages of symptom development are the best time for the treatment of nutrient deficiency. Zinc deficiency in rice plant usually appears within 2-3 weeks after transplanting [3]
or sowing. Iron toxity symptoms may appear on plants growth within 1 to 2 weeks after transplantation [3]. Nitrogen
deficiency symptoms may appear on plant growth within 1 to 2 months after transplantation. Nitrogen deficiency is the most commonly detected nutrient disorder observed in rice. Old leaves and sometimes all leaves become light green and chlorotic at the tip. Leaves die under rigorous stress. Apart from young leaves, which are greener, deficient leaves are narrow, short, rigid and lemon yellowish. The whole field may appear yellowish.
Fig 1. Percentage of Nutrients in soil
sheath blight (Rhizoctonia solani),sheath rot (Sarocladium oryzae),stem rot(Helminthosporium sig moideum and blast (Pyricularia oryzae) where excessive N fertilizer and insufficient K fertilizer have been used. When Manganese (Mn) deficiency occurs, the effected plants are more susceptible to brown spot (caused by Helminthosporium oryzae)[14].
The symptoms of Mn Deficient plants shorter, with fewer leaves, weigh less, and smaller root system at tillering stage. Sheath blight is one of the most important diseases in rice. It is characterize by large oval spots on the leaf sheaths and irregular spots on leaf blades. Infections usually begin during the late tillering-joint elongation stages of growth. The fungus Cercospora janseana causes narrow brown leaf spot. Spots are linear and reddish-brown. On susceptible cultivars, the lesions are wider, more numerous and lighter brown with gray necrotic centers. Narrow brown disease lesion symptoms usually are darker brown and develop in the internodal area of the neck. Grain infection appears as a diffuse brown discoloration. Resistance to narrow brown leaf spot is available, but new races of the pathogen develop rapidly. Low nitrogen appears to favor disease development. Blast disease is caused by the fungus, Pyricularia grisea. Blast can be
found from the seedling stage to near maturity. The leaf blast phase occurs between the seedling and late tillering stages.
Sheath rot is caused by the fungus Sarocladium oryzae.
Symptoms are most severe on the uppermost leaf sheaths that enclose the young panicle during the boot stage.
The fungus Sclerotium oryzae causes stem rot. High nitrogen
and low potassium levels favor the disease.
a) Classification
Classification is a data mining function that assigns items in a collection to target categories or classes. The goal of the classification is to accurately predict the target class for each case in the data. For example, a classification model could be used to identify the nutritional disorders as low, medium, and high. A classification task begins with a data set in which the class assignments are known.
In our present investigation, a model that classifies the nutrient levels as low, medium, or high value would also predict the probability of occurrence of rice diseases of each classification for each datasets of paddy plants.
b) Testing a Classification Model
A classification model is tested by applying it to test data with known target values and comparing the predicted values with the known values. The test data must be compatible with the data used to build the model and must be prepared in the same way that the build data was prepared. Typically the build data and test data come from the same historical data set. A percentage of the records is used to build the model; the remaining records are used to test the model. Test metrics are used to assess how accurately the model predicts the known values. If the model performs well and meets the business
requirements, it can then be applied to new data to predict the future.
c) Regression
Regression [7][8] defines the analysis used to model the relationship between one or more independent or predictor values and dependent or response variable. In the present context of data mining the predictor variables or attributes of interest describing the tuple which are known values. The response variable is what we want to predict
The two basic types of regression are linear regression and multiple regressions. Linear regression uses one independent variable to explain and/or predict the outcome of Y, while multiple regressions use two or more independent variables to predict the outcome.
d) Residual Plots
A residual plots is scatter plot where the x-axis is the predicted value of x, and the y-axis is the residual for x. The residual is the difference between the actual value and the predicted value of x.
II. EXISTING SYSTEM
The Existing Algorithms provides most important benefits are interpretability. Many affecting diseases infect the Indian rice crop: Some diseases are considered more important than others. In this case we focus into the most important diseases for example “blast”,”helminthosporiose”, ”stem rot” and “foot
rot”[1].More over the c4.5 can effectively create
comprehensive tree with great predictive power and able to get a prediction error about 1.5% on the data of test set. The enhancement in classification results over fitting error using pruning techniques and handling the huge numbers of attribute values. The system mainly concentrates on either soil or plant but not the both. The Critical values [3] plays an important role
for pruning the datasets and it may have two classes sufficiency and toxity.
The sufficiency ranges for leaf tissues of rice crop was determined by the technique. The range of sufficiency’s are the values derived [2] from the mean ± 4/3 StdDev and mean ±
8/3 StdDev (Standard deviation), respectively.
The value of nutrients < (mean – 8/3 StdDev) are considered deficient, whereas their low range included all values between >(avg -8/3 StdDev) and <(avg -4/3 StdDev).Values between >(avg -4/3 StdDev) and < (avg +4/3 StdDev) are taken as high. The nutrient concentrations > (mean +8/3 StdDev) are expressed as excessive or toxic. The extending nature for getting the symptom in paddy plant based on nutrient values. Thus symptom will concentrate to diseases in paddy plants. Specification of stages can lead to where the maximum deficiency occurs.
III.PROPOSED SYSTEM
positively or negatively, is unique to each plant-disease complex.
In proposed system, we are proposing how different nutrients affect different types of plant diseases such as fungal, bacterial, virus. In general, nutrient-pathogen interactions are not well understood. Plant nutrients may affect disease susceptibility through plant metabolic changes, thereby creating a more favorable environment for disease development. Nutrient deficiencies cause chronic disease in plants. When nutrients are lacking, important molecules like chlorophyll, metabolism, protein synthesis, photosynthesis and chlorosis are mostly effects the paddy plants. In general, plant growth is slowed, and susceptibility to disease may increase. Mostly the soil consists of macro nutrients and micro nutrients which are essential for the plant growth. we are considering the macronutrients such as Nitrogen(N), Phosphorus(P), Potassium(K) and the micro nutrients Zinc(Zn), Iron(Fe), Manganese(Mn), Copper(Cu) which are mostly essential for the plant growth. We are considering the soil nutrient values for Nitrogen, Phosphorus, Potassium, Zinc, Iron, Manganese and copper based on the crop nutrient survey in Krishna district of Andhra Pradesh in India. Based on the critical nutrient values we identify the classes based on supervised learning such as high, medium and low of nutrient values are calculated by using ∑n
i=1,∑mj=1(N,M) which is
identifying the plant symptoms based on the classes as it is difficult to identify the symptoms based on the critical values. For example, The Nitrogen Deficiency effects all the parameters of the plant which are contributing to yield. Mostly the intraveinal chlorosis of the plant is effected due to the nitrogen deficiency where the class is low. The Protein synthesis of the plant is effected due to the Phosphorous Deficiency and Manganese deficiency. The Photosynthesis of the plant is effected due to the Potassium Deficiency, copper deficiency and Iron deficiency. The chlorophyll and metabolism of the plant is effected due to the Zinc Deficiency. Here we are classifying the Nutritional Disorders which increases many Diseases according to the growth stages. The growth stages of the plant are early stage, active tillering stage, panicle initiation, heading and harvesting. Mostly the diseases are increased in tillering stage.
Fig 2. Growth Stages in paddy plants
We are using tool kit in the Data Analyzer of Microsoft Excel. We are deploying the Residual plots by using regression function which is provided in the tool kit.
IV.DATA ANALYSIS
Generally the soil consists of ph value .If the soil contains the ph value greater than 8 then there is no deficiency occurs. If the soil ph value is less than 8 then there is a chance of deficiency initially we have collected the previous data from agriculture department in Andhra Pradesh. Data Visualization is in the form of N-P-K-Zn-Fe-Mn-Cu which are micro and macro nutrients which are essential for plant growth and specified nutrients are called as attributes of the given data. We preprocessed the supervised data and then classify the data into classes called low, medium and high. Based on classes a paddy plant may effected and it can be measured by a symptom, based on this we can identify the diseases in the growth stage. There are various stages in plant growth are 1) Early growth 2) Tillering stage 3) Panicle and 4) Heading. The Growth stage is the important stage which is having nominal and critical values. The Critical values can be calculated by using standard mean. The mean of the nutrients can be calculated according to Day wise. The following table shows the Soil Nutrient Values according to the Day wise and these values are when the crop is in early growth.
TABLE.1
SOIL NUTRIENT VALUES WITH ITS MEAN ACCORDING TO DAY WISE
TABLE.2CLASSIFICATION ACCORDING TO CLASSES BASED ON SYMPTOMS WITH IT DISEASE.
Days 71 N symptom ----
N high P symptom Proteinsynthesis
P low K Symptom Interveinal chlorosis
K low Zn
Symptom ---
Zn high Fe Symtom Photosynthesis
Fe low Mn
Sympton
Proteinsynthesis
Mn low Cu
Symptom ---
Cu high Disease Cercospora leaf spot
a) Regression
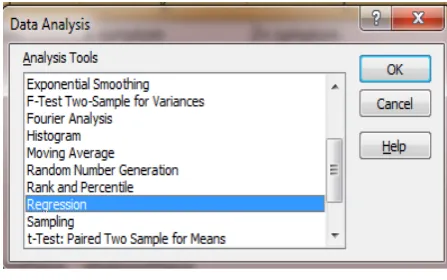
The Regression analysis tool performs linear regression analysis by using the "least squares" method to fit a line through a set of observations. You can analyze how a single dependent variable is affected by the values of one or more independent variables. For example, you can analyze how an athlete's performance is affected by such factors as age, height, and weight. You can apportion shares in the performance measure to each of these three factors, based on a set of performance data, and then use the results to predict the performance of a new, untested athlete. Regression is the predictive analysis which can work on learning supervised data. By Using Excel we can predict at what stage the major diseases occur according to the growth stages. The following are the steps for performing regression on data Select Office Option Excel OptionsSelect Add-InsAnalysis Tool Pack.
Step1:
Select the “Data Analysis” on the Analysis tab
Step 2:
Select the Analysis Tools as Regression then submit
Step 3:
Input Y Range Enter the reference for the range of dependent data. The range must consist of a single column of data.
Input X Range Enter the reference for the range of independent data. Microsoft Office Excel orders independent variables from this range in ascending order from left to right. The maximum number of independent variables is 16.
Confidence Level Select to include an additional level in the summary output table. In the box, enter the confidence level that you want to be applied, in addition to the default 95 percent level.
Residuals Select to include residuals in the residuals output table.
Residual Plots Select to generate a chart for each independent variable versus the residual.
Step4:
Nominal values are given as input X Range and Critical Values are given as Input X range
Nominal Critical
Early stage 25.71 25.83
Tillering 27.16 26.66
Panicle 11 11
b)Output
Obser vation
Predicted Y Residuals Standard Residuals
1 26.02266246 0.312662457 -1.25715367
2 26.86390905 0.296090947 1.19052292
3 10.99171425 0.008285755 0.033315375
4 10.99171425 0.008285755 0.033315375
Residual Plot: A Graph which indicates the effect of Growth stage of the Rice plant. We denoted 4 growth stages 1) Early Stage 2) Tillering 3) Panicle 4) Heading. As per the data given by the agriculture department, Andhra Pradesh. The effected Growth stage is Tillering stage which is 1.19052292.In this stage only there is a chance of effecting diseases to rice plant.
V. CONCLUSION
Our system is mainly focusing on micro and macro nutrients which are helpful for plant growth, the system considering four types of growth stages in rice plant. Predicting the diseases based on symptoms according to the micro and macro nutritional deficiency. The regression is the predictive analysis function which is available in the data analysis tool pack. The regression function computes nominal and critical values for the growth stage of the paddy plant effected due to the lack of nutrients. The nutrition data collected from the agriculture department for black cotton soil. Our system is to help farmers to predict the diseases which are based on symptoms on nutritional disorders. Organic farming plays major role for balancing the nutrients in plants. Neam oil is the example for the best nutrient solvent which balances the ph value in the soil.
AUTHORS ACKNOWLEDGEMENT
The authors thanks to the Agriculture Department in Gollapudi, Krishna District, Andhra Pradesh for providing N-P-K soil test results for doing this project.
FUTURE ENHANCEMENT
Now a days agriculture system is getting modernized, according to that the disease identification in paddy plants is also important based on different types of soils. In Growth stage of paddy plants nutritional disorders leads to various symptoms,based on this the status(health) of the crop prediction is very easy to farmers.Our system will help to extend to get various nutritional disorders in different soils. Our system can be enhanced to develop a web based system that can take the opinions from the farmers to observe how the plant growth is effected by the nutritional disorders.
REFERENCES
[1] Classification rules for Indian Rice diseases A.Nithya1 and
Dr.V.Sundaram2 1Asst Professor in Computer Applications, Nehru Arts and Science College, Coimbatore, Tamil Nadu, India.
[2] P. Ravi, G. Bhupal Raj and P. Chandrasekhar Rao Nutrient status
and establishment of critical values and adequate ranges for
different nutrients for rice (oryza sativa l.) through dris in
karimnagar district of Andhra Pradesh Department of Soil Science and Agricultural Chemistry, College of Agriculture, Rajendranagar , Acharya N.G. Ranga Agricultural University, Hyderabad Andhra Pradesh
[3] https://risocas.unihohenheim.de/uploads/media/mb_
[4] 00158.pdf
[5] http://www.knowledgebank.irri.org/RiceDoctor/ component/content/article/686.html
[6] Brar, M.S., Arora, C.L. and Takkar, P.N. 1982. Critical values and
adequate nutrient ranges in rice. J. Indian Soc. Soil Sci. 30:
562-566.
[7] http://www.knowledgebank.irri.org/RiceDoctor/
information-sheets-mainmenu-2730/deficiencies-and-toxicities-mainmenu-2734.html
[8] http://educ.jmu.edu/~drakepp/FIN360/readings/ regression_excel.pdf
[9]
http://www.addictivetips.com/windows-tips/excel-2010-regression-analysis/
[10]
http://www.rkmp.co.in/content/major-rice-diseases-of-andhra-pradesh
[11] http://drd.dacnet.nic.in/Status%20Paper%20-%2003.htm
[12] http://edis.ifas.ufl.edu/hs1181
https://www.apsnet.org/publications/apsnetfeatures/Pages/Nutrient s.aspx
[13]
http://irri.org/our-work/research/better-rice-varieties/disease-and-pest-resistant-rice
‐0.5 0 0.5
0 10 20 30
Residuals
X Variable 1