Available online: https://edupediapublications.org/journals/index.php/IJR/ P a g e | 1719
Dynamic Analysis of A Building With And Without Floating Columns
Konda Bala Chandra & J.V.Subba Rao
1
PG Student, Civil Department (Structural Engineering) Chintalapudi engineering college
Ponnur,Guntur,India
2
Assistant Professor, Civil Department Chintalapudi engineering college
Ponnur,Guntur,India
E-mail:[email protected] & E-mail:[email protected]
Abstract
The beam which support the column acts as a foundation, is nothing but the floating column resting on the beam. That beam is called as transfer beam. This is widely used in high storied buildings which is used for both commercial and residential purpose. This helps to alter the plan of the top floors to our convenience. The transfer beam that support floating column will be designed with more reinforcement. Earthquakes in different parts of the world demonstrated the hazardous consequences and vulnerability of inadequate structures. In present scenario buildings with floating column is a typical feature in the modern multistory construction in urban India. The floating column which is at its lower level resting on a beam is a vertical element. The present objective this work is to compare the behavior of High-rise Building with and without floating columns. The parametric Studies comparison of Maximum Storey Displacement, Maximum Storey Drift generated in High-rise Building with and without floating columns Using ResponseSpectrumAnalysisin ETABS Software.
Keywords:Response Spectrum Analysis,
High-rise Building with and without floating columns, StoreyDrift,
StoreyDisplacement, ETABSsoftware.
I. INTRODUCTION
A series of connected, interrelated elements is a structure that form together a system which provides adequate rigidity that can resist a series of external load effects applied to it, which includes its own self weight. A structure in civil engineering is usually made up of beams, columns, cables, slabs . Failure of a structure can occur from many types of problems such as if the structure is not strong and tough enough to support the load ,due to instability, failure is caused by manufacturing errors, from the use of defective materials, failure is from lack of consideration of unexpected problems. Earthquakes are caused by differential movements of
the earth’s crust. An earthquake is the result of a rapid release of strain energy stored in the earth’s crust that generates seismic waves. Structures are vulnerable to earthquake ground motion and damage the structures. The result of these movements is the well-known ‘ground shaking’ that can lead to significant damage and/or collapse of buildings,infrastructure systems(e.g. dams, roads, bridges, via ducts etc.), landslides, when soil slopes lose their cohesion, liquefaction in sand and destructive waves or‘ tsunamis’ in the maritime environments. Here are the biggest reasons buildings fail in an earthquake.
1.1 INTRODUCTION TO FLOTING COLUMNS
Available online: https://edupediapublications.org/journals/index.php/IJR/ P a g e | 1720
floating column after providing lateral bracing is analyzed. A comparative study of the results obtained is carried out for all above three models. After providing bracings the buildings with floating column showed the improved seismic performance.
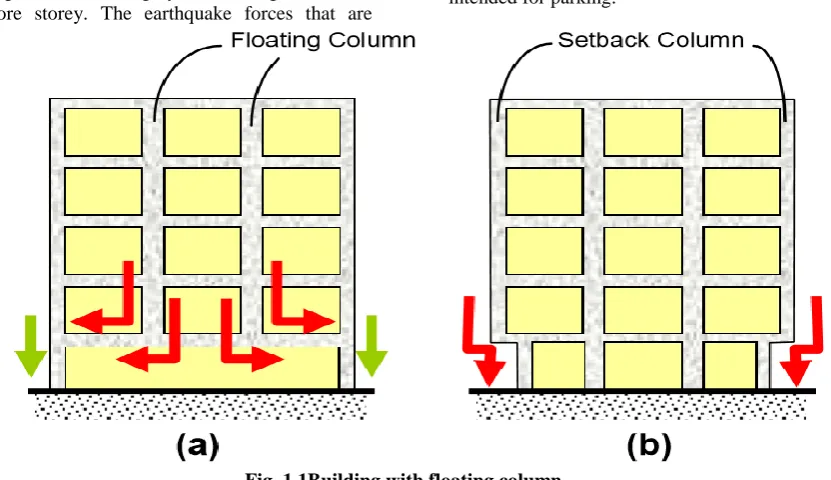
Now a day’s, multi-storey buildings in urban cities are required to have column free space due to shortage of space, population and also for aesthetic and functional requirements. For the buildings built in seismically active areas with floating columns are highly disadvantageous at one or more storey. The earthquake forces that are
developed at different floor levels in a building need to be carried down along the height to the ground by the shortest path. Deviation or discontinuity in this load leads to the transfer of path which results in poor performance of the building. The behavior of a building during earthquakes depends critically on its overall shape, size and geometry, in addition to how the earthquake forces are carried to the ground. Many buildings are collapsed or severely damaged in Gujarat during the 2001 Bhuj earthquake and the buildings are of mostly with an open ground storey intended for parking.
Fig. 1.1Building with floating column 1.2 FLOATING COLUMN:
A column is nothing but a vertical member transferring the load to the ground and starts from the ground level. The term floating column is also a vertical element which (due to architectural design/ site situation) at its lower level (termination Level) rests on a beam which is a horizontal member. The beams in turn transfer the load to other columns below it.
In this century due to huge population the no. of areas in units are decreasing day by day. Few years
Available online: https://edupediapublications.org/journals/index.php/IJR/ P a g e | 1721
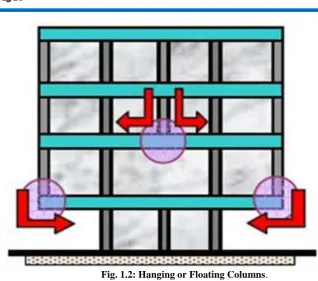
Fig. 1.2: Hanging or Floating Columns. 1.3 TRANSFER BEAM:
In Frame as load carrying system when column is not allowed to continue downward due to some restriction, problem is resolved by using transfer beam. A transfer beam is typically a column which carries the load of an especially heavy load. It is used to transfer the load of a column above to two separate columns below. This is often needed in cases where you need different or larger column spacing. Where we often see transfer beams is in high rise buildings is one example. These buildings often have retail spaces and parking garages at the lower levels and residential or office units on the upper levels.
1.4 HIGH-RISE BUILDINGS:
Buildings 35 meters or greater in height which are divided at regular intervals into accusablelevels are generally high rise buildings. Undeniably the high-rise buildings are also seen as a wealth-generating mechanism working in an urban economy. High-rise buildings create a lot of real estate out of a fairly
small piece of land so they are largely constructed. Because of the availability of global technology and the growing demand for real estate, high rise buildings are seen as the most fitting solution to any city that is spatially challenged and can't comfortably house its inhabitants.
Available online: https://edupediapublications.org/journals/index.php/IJR/ P a g e | 1722
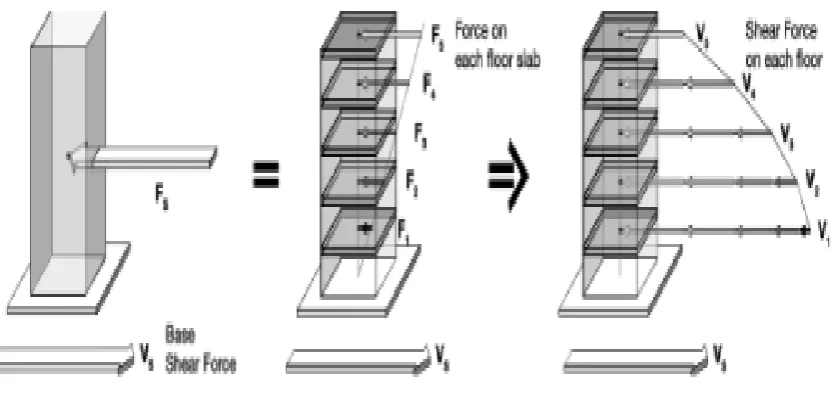
Fig No.1.3: Lateral forces and Shear forces generated in buildings due to ground motion
II. OBJECTIVE AND SCOPE If structure is not constructed in earthquake prone areas the structure needs not to be analyzed for the seismic analysis, the dead load and live load analysis is enough without considering the seismic forces. As occurrence of earthquakes in India is increasing day by day the demand of seismic analysis is increasing. In this present work Dynamic analysis of a High-rise building with and without Floating Columns has been analyzed under Response spectrum Analysis.
The purpose of this project is
1. To study the seismic behavior of High-rise building with and without Floating
Columns using Response Spectrum analysis by using ETABS software.
2. To study and evaluate various Seismic assessment parameters such as Storey
Displacement, StoreyDrift.
3. To compare the maximum Storey Drift, Storey Displacement of a Normal High-rise Building With and without
Floating Columns obtained by the Response Spectrum method.
III. METHODOLOGY
On the basis of external action, the behavior of structure or structural materials, and the type of structural model selected the analysis is performed. Based on the type of external action and behavior of structure, the analysis can be further classified as given below
A. Equivalent static analysis B. Nonlinear Static Analysis C. Response Spectrum Method
From the above methods I have chosen the Response Spectrum Analysis for the analysis of a Flat Slab, Grid Slab and Flat Plate.
A response spectrum is simply a steady state response (displacement, velocity or acceleration) of a series of oscillators of varying natural frequency, that are forced into motion by the same base vibration or shock or a peak. To pick off the response of any linear system, given its natural frequency of oscillation the resulting plot is used. One such use is in assessing the peak response of buildings to earthquakes. For correlation with seismic damage, the values from the ground response spectrum is used by the science of ground motion. (calculated from recordings of surface ground motion from seismographs).
IV.MODELLING
Nine High –rise building with and without Floating Columns are taken for the analysis. The height of each
Available online: https://edupediapublications.org/journals/index.php/IJR/ P a g e | 1723
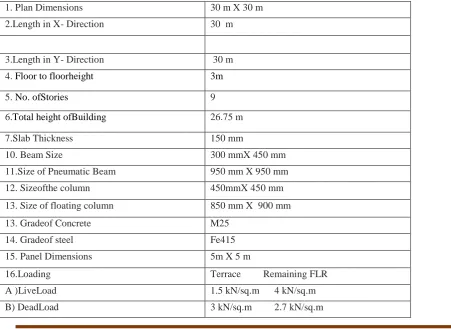
4.1 DETAILS OF HIGH-RISE BUILDING WITHOUT FLOATING COLUMN Table No 4.1 shows the details of High-rise Building without Floating Column
1. Plan Dimensions 30 m X 30 m
2.Length in X- Direction 30 m
3.Length in Y- Direction 30 m
4. Floor to floorheight 3m
5. No. ofStories 9
6.Total height ofBuilding 26.75 m
7.Slab Thickness 150 mm
10. Beam Size 450 mmX 600 mm
11. Size of column 600 mmX 600 mm
13. Gradeof Concrete M25
14. Gradeof steel Fe415
15. Panel Dimensions 5m X 5 m
16.Loading Terrace Remaining FLR
A )LiveLoad 1.5 kN/sq.m 4 kN/sq.m
B) DeadLoad 3 kN/sq.m 2.7 kN/sq.m
4.2 DETAILS OF HIGH-RISE BUILDING WITH FLOATING COLUMN
Table No 4.2 shows the details of High-rise Building with Floating Column
1. Plan Dimensions 30 m X 30 m
2.Length in X- Direction 30 m
3.Length in Y- Direction 30 m
4. Floor to floorheight 3m
5. No. ofStories 9
6.Total height ofBuilding 26.75 m
7.Slab Thickness 150 mm
10. Beam Size 300 mmX 450 mm
11.Size of Pneumatic Beam 950 mm X 950 mm
12. Sizeofthe column 450mmX 450 mm
13. Size of floating column 850 mm X 900 mm
13. Gradeof Concrete M25
14. Gradeof steel Fe415
15. Panel Dimensions 5m X 5 m
16.Loading Terrace Remaining FLR
A )LiveLoad 1.5 kN/sq.m 4 kN/sq.m
Available online: https://edupediapublications.org/journals/index.php/IJR/ P a g e | 1724
V .ANALYSIS OF MODEL
4.1 HIGH-RISE BUILDING WITHOUT FLOATING COLUMN BY USINGETABS
Fig3.1 Three-DimensionalViewofHigh-Rise Building without Floating Column inEtabs.
4.2HIGH-RISE BUILDING WITHOUT FLOATING COLUMN BY USINGETABS
Fig4.2 Three-Dimensional View of High-Rise Building without Floating Column in Etabs.
Available online: https://edupediapublications.org/journals/index.php/IJR/ P a g e | 1725
V. RESULTS AND DISCUSSION
The maximum storey Displacement and drifts of High-Rise Building with and Without Floating Columns in different stories for Response spectrum analysis has been collected. The Storey Drift and Displacement of High-Rise Building with and Without Floating Columns in buildingresultsare takenfor Response spectrum analysisdrawn based on theresults.
5.2.1 Story Displacement in ZoneIII:
The Below Figures from5.1 Show the Storey Displacement of High-Rise Building without Floating Columns With respect to Zone III Medium Soil(soil Type II). The below figure Represents the Displacement of a Normal Building in X-direction and Y-Direction. The Diplacement is Same In Both Action in Normal Building.
Fig.5.1Storydisplacementin Zone III Soil II Graph for Without Floating Columns
The below Figure5.2 Show the Story Displacement of High-Rise Building with Floating Columns With respect to Zone III Medium Soil(soil Type II). The below figure
Represents the Displacement of a Floating Column Building in X-direction and Y-Direction. The Diplacement is Same In Both Action in Normal Building.
Base Storey
1
Storey 2
Storey 3
Storey 4
Storey 5
Storey 6
Storey 7
Storey 8
Storey 9
X-Direction 0 18.95 44.872 72.257 97.968 121.001 140.672 156.393 167.713 174.617
Y-Direction 0 18.951 44.874 72.259 97.969 121.002 140.672 156.393 167.714 174.618
0 20 40 60 80 100 120 140 160 180 200
Sto
rey
Dis
p
p
lace
m
en
t
in
m
m
Storey Level
Available online: https://edupediapublications.org/journals/index.php/IJR/ P a g e | 1726
Fig.5.2 Storey displacement in Zone III Soil II Graph for With Floating Columns
Displacement in X- Direction for with and Without Floating Columns
Fig.5.3 Storey displacement in Zone III Soil II Graph for with and without Floating Columns
The above graph (fig no 5.3) shows the storey displacement of a high-rise building with and without floating columns. here the maximum displacement occurs in without floating column building compare to high- rise building with floating columns due to the distribution of load to the sub structure. the above graph show the displacement in x- direction and y- direction of a high- rise building without and with floating
Base Storey1 Storey2 Storey3 Storey4 Storey5 Storey6 Storey7 Storey8 Storey9
X-Direction 0 13.321 37.931 62.359 85.163 105.752 123.536 138.001 148.709 155.541
Y-Direction 0 13.502 38.422 63.127 86.166 106.953 124.893 139.469 150.241 157.098
0 20 40 60 80 100 120 140 160 180
Sto
rey
Dis
p
lace
m
en
t
in
m
m
Storey Level
Storey Displacement of a Floating Columns Building
Base Storey1 Storey2 Storey3 Storey4 Storey5 Storey6 Storey7 Storey8 Storey9
Without Floating 0 18.95 44.872 72.257 97.968 121.001 140.672 156.393 167.713 174.617
With Floating 0 13.321 37.931 62.359 85.163 105.752 123.536 138.001 148.709 155.541
0 20 40 60 80 100 120 140 160 180 200
Sto
rey
Dis
p
lace
m
en
t
in
m
m
Available online: https://edupediapublications.org/journals/index.php/IJR/ P a g e | 1727 columns. and the maximum displacement was occur in without floating column due to distribution of load from super structure to the sub structure
5.2.2 Story Drift Zone III:
The Below Figures from 5.4-5.5 Show the Story Drift of High –Rise Building Without and with Floating Columns With respect to Zone III Medium Soil(Soil Type II).
Base Storey
1
Storey 2
Storey 3
Storey 4
Storey 5
Storey 6
Storey 7
Storey 8
Storey 9
X- Direction 0 0.0069 0.0091 0.0091 0.0086 0.0078 0.0068 0.0055 0.0040 0.0026
Y-Direction 0 0.0069 0.0091 0.0091 0.0086 0.0078 0.0068 0.0055 0.0040 0.0026
0 0.001 0.002 0.003 0.004 0.005 0.006 0.007 0.008 0.009 0.01
S
to
rey
Drif
t
in
m
m
Storey Level
Available online: https://edupediapublications.org/journals/index.php/IJR/ P a g e | 1728
Fig.5.4Storey drift in Zone III Soil II Graph for Without Floating Columns
The above figure5.4 show the storey displacement of high-rise building without floating columns with respect to zone iii medium soil(soil type ii). the below figure represents the displacement of a floating column building in x-direction and y-direction. the diplacement is same in both action in normal building.
Fig.5.5 Storey drift in Zone III Soil II Graph for With Floating Columns
From the above Graphs I concluded that The Provision of Floating Column gives the less Storey Drift compare to Normal Building.
By the Provision of Floating Column the Building is to resist the Seismic Loads from the above Stories by Providing the Boundary beam size as more than the Normal Beams.
VII.CONCLUSIONS
Following conclusions can be drawn for Normal Building, Floating Column buildings from the results obtained in chapter5:
1. As the mode number is getting increased the time period of the structure is getting decreased and frequency of the building is increasing.
2. As the time period is decreasing the acceleration in X and Y direction is increasing and at some points the
acceleration became constant (from2 to mode-7).
3. In present Study the normal building, Floating column buildings are analyzed
In Zone III medium soil (Soil Type II).
4. The provision of a floating column in a high rise building Pneumatic Beam
Compare to Normal Building in Zone III, medium Soil (Soil Type II).
It can be summarized that the response of a floating column building is less compare to Normal Building. In Floating column the Pneumatic Beams are acting as a Girders to transfer the load from the Superstructure to the sub structure. Storey Displacement and Storey Drift Performance is observed to be within the permissible limits in
Base Storey
1
Storey 2
Storey 3
Storey 4
Storey 5
Storey 6
Storey 7
Storey 8
Storey 9
X-Direction 0 0.0048 0.0082 0.0082 0.0077 0.0070 0.0061 0.0050 0.0037 0.0024
Y-Direction 0 0.0049 0.0083 0.0083 0.0077 0.0070 0.0061 0.0050 0.0037 0.0024
0 0.001 0.002 0.003 0.004 0.005 0.006 0.007 0.008 0.009
Sto
rey
Dr
if
t
in
m
m
Storey Level
Available online: https://edupediapublications.org/journals/index.php/IJR/ P a g e | 1729
floating column building is the preferable in Zone III, Medium Soil (Soil Type II).
VIII.REFERENCES
[1] Hossain Mohammad Muyeed- Ul-Azam
and Khan Mahmud Amanat [1] (2005). Effect
of Infill a Structural Component on the
Column Design of Multi-storied Building.
UAP Journal of
Civil and Environmental Engineering Vol. 1,
No. 1, 2005.
[2]. J. Dorji and D.P. Thambiratnam [2] (2009).
Modeling and Analysis of Infilled Frame
Structures
Under Seismic Loads. The Open Construction
and Building Technology Journal, 2009, 3,
119-126.
[3]. Kashif Mahmud, Md. Rashadul Islam and Md.
Al-Amin [3] (2010). Study of the
Reinforced Concrete Frame with Brick
[4]. Masonry Infill due to Lateral Loads.
International Journal of Civil & Environmental
Engineering IJCEE-IJENS Vol. 10, No. 04.
[5]. Kodur, V.R.; Erki, M.A.; Quenneville, J.H.P. [4]
(1995). Seismic design and analysis of Masonry
Infilled frames. Canadian Journal of Civil
Engineering, 22, (3), pp. 576-587, June 01, 1995.
[6]. P.G. Asteris, M.ASCE (2003). Lateral
Stiffness of Brick Masonry Infilled Plane
Frames. Journal of Structural Engineering ©
ASCE / August 2003 / 1071.
[7]. P.M. Pradhan, P.L. Pradhan, R.K. Maskey
(2012). A Review on Partial Infilled Frames
Under
Lateral Loads. Kathmandu University
Journal of Science, Engineering and
Technology Vol. 8,
No. 1, February, 2012, pp. 142-152.
[8]. Mulgund G.V. and Dr.Kulkarni A.B.
(2011). Seismic Assessment of RC Frame
Buildings with
Brick masonry infill. Mulgund GV Et Al. /
(IJAEST) International Journal of Advanced
Engineering Sciences And Technologies
Vol. 2, Issue No. 2.
[9] “The effect of masonry infill's on the seismic response of a four- storey reinforced concrete frame
A Deterministic assessment”, Journal of Engineering Structure., 168-172.
[10] KasimArmaganKorkmaz, and Mustafa (2007)” Earthquake Assessment of RC Structures with
Masonry Infill Walls. International Journal of Science & Technology”, Volume 2, No 2, 155-
164, 2007.
[11] B.Srinivas and B.K.Raghu Prasad. “The Influence of Masonry Infill in Reinforced Concrete
Multi-Story Buildings to Near-Fault Ground Motions”, Department of Civil Engineering, Indian
Institute of Science, Bangalore
Karnataka-560012, India.
[12] George C Manos, JafarThaumpta and Bilal Yasin (2000). “Influence of masonry infill’s on the
Earthquake response of multi-story
reinforced concrete structures”, Journal of
WCEE.
Available online: https://edupediapublications.org/journals/index.php/IJR/ P a g e | 1730
Multi-Storey Infilled Frames, Building and
science”, Vol. 2, pages. 247-257.
[14] Diptesh Das and C.V.R. Murty (2004)
“Brick masonry infill’s in seismic design of RC
frame
Buildings”, Part 2 Behavior. Indian
concrete journal, pages. 374-387.
[15] FakhredinDanesh and VahidBehrang
(2004) “The influence of masonry infill walls on dynamic Behavior of concrete structures”,
13th World Conference on Earthquake
Engineering Paper No. 1984.
[16] Mehmet MetinKose (2008). “Parameters affecting the fundamental period of RC buildings with Infill walls, Engineering Structures”, pages. 240-250.
[17] MatjazDolsek and Peter Fajfar, “On seismic behavior and mathematical modelling of infilled
RC frame structures”, Journal of WCEE.
[18] Laura Liberatore, Luis D. Decanini and DomenicoLiberatore (2004). “Seismic Lateral
Deformation and energy demands in bare and infilled RC frames”, 13th World Conference on
Earthquake Engineering Page no 7007.
[19] Harpal Singh, D. K. Paul, V. V. Sastry (1998) “Inelastic dynamic response of reinforced concrete Infilled frames,
[20] Mehmet M Kose and OzgeKarslioglu (2009) “effects of infills on high-rise buildings: a case
Study”, pages. 123-135
[21] M. Sobaih and M. M. Abdin (1988), “Seismic analysis of infilled reinforced concrete frames,
Computers and structures” Vol. 30, No. 3, pp. 457-464.
[22] Smith, S. B. and Carter, C. (1969), “A method of analysis of in-filled frames Proceedings,
Institution of Civil Engineers, London”, Vol. 44, pp. 31-48.
[23] KonuralpGirgin and KutluDarılmaz, “Seismic Response of Infilled Framed Buildings Using
Pushover Analysis, ARI the Bulletin of the Istanbul Technical University” Volume 54,
[24] IS 456-2000” Plain and Reinforced concrete. Code of practice”.
[25] “Federal Emergency Management Agency” codes no 356.