A FPGA Implementation on Skin Cancer
Detection Using TDLS Algorithm
V. Krishna Sree
1, J. Khushbu
2Associate Professor, Dept. of ECE, VNR Vignana Jyothi Engineering College, Hyderabad, India1 PG Student [VLSI], Dept. of ECE, VNR Vignana Jyothi Engineering College, Hyderabad, India2
ABSTRACT: Melanoma is one of the deadliest forms of skin cancer if it is left untreated. Incidence rates of melanoma have been increasing, especially among adults, but survival rates are high if detected early. The time and costs required for the patients to go for dermatologist for melanoma are prohibitively expensive. One challenge in implementing such a system is locating the skin lesion in the digital image. The goal of this paper is to develop a framework that automatically correct and segment the skin lesion from an input photograph. The first part of this paper is to model illumination variation using a proposed multi-stage illumination modelling algorithm and then using that model to correct the original photograph. Second, a set of representative texture distributions are learned from the corrected photograph and texture distinctiveness metric is calculated for each distribution. Finally, a texture-based segmentation algorithm classifies regions in the photograph as normal skin or lesion based on the occurrence of representative texture distributions. The resulting segmentation can be used as an input to separate feature extraction and melanoma classification algorithms.
KEYWORDS: Melanoma, skin cancer, segmentation, texture, neural network.
I.INTRODUCTION
Melanoma is a cancer of the melanocytes, the cell found in the skin’s epidermis that produces melanin. Melanoma most commonly occurs on the trunk or lower extremities. While malignant melanoma is less common than non-melanoma skin cancer [1], it is considered the most deadly form of skin cancer. This is because melanoma accounts for approximately 75% of deaths associated with skin cancer. In 2013, it is estimated that 76,690 people will be diagnosed with melanoma and 9,480 people will die of melanoma in the United States. In Canada, 1 in 74 men and 1 in 90 women will develop melanoma in their lifetime.
The recent trends in melanoma incidence rates are more alarming. a study of the melanoma trends from 1992-2006 found that incidence rates for non-hispanic white males and females were increasing at an annual rate of approximately 3% . For young adults ages 15-30, melanoma is one of the most commonly diagnosed forms of cancer. if melanoma is detected early, while it is classified at Stage I (less than 0.76mm thick), the year survival rate is 96%. However, the 5-year survival rate decreases to 5% if the melanoma is in Stage IV. The cost of treatment of Stage IV melanoma is also 30 times the cost of treatment for Stage I melanoma. With the rising incidence rates in certain subsets of the general population, early melanoma screening is beneficial.
A special device named dermatoscope is used for assessing the risk of skin lesions [2]. Dermoscopy images are the images which are acquired through digital dermatoscope. Early work on automated systems to assess the risk of melanoma used dermoscopy images. There images are needed for a segmentation algorithm for dermoscopy images of skin lesions. The majority of proposed segmentation algorithms are only applicable to dermoscopy images, which has better contrast between the lesion and surrounding skin area for certain types of lesions before extracting features from the skin lesion and classifying the lesion as malignant or benign, segmentation algorithm is used to identify the location of the lesion border.
For the melanoma images there are different types of segmentation algorithm has been proposed. A recent summary by celebi et al. [3] reviews the existing segmentation algorithms for dermoscopy images. The mostly segmentation algorithms include thresholding, active contours [4], and regions merging [5], features from pixel color drive segmentation
Another approach to segment skin lesions is to use textural information, because normal skin and lesion areas have different textures. Different texture information images are extracted and textures from different regions are compared. Stoecker et al. [6] analyzed texture in skin images using basic statistical approaches, such as the gray level co occurrence matrix. They found that texture analysis could accurately find regions with a smooth texture and that texture analysis is segmentation of dermatological images.
Texture-based segmentation algorithms have been applied to dermoscopy images. The algorithm proposed by Xu et al.
[7] learns a model of the normal skin texture using pixels in the four corners of the image, which is later used to find the lesion. Hwang and celebi [8] use Gabor filter to extract texture features features and use a g-means clustering approach for segmenting the lesion.
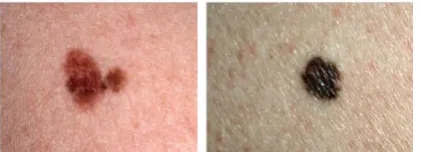
Fig 1: Example of digital images of malignant melanoma acquired using a digital camera, from the Dermquest database. In both images, the illumination variation changes horizontally
In this paper, a segmentation algorithm based on texture distinctiveness (TD) is used photographs. This algorithm is referred to as the TD lesion segmentation (TDLS) algorithm [9]. TD captures the dissimilarity between different texture distributions. Regions in the image are classified as begin part of lesion and skin based on TD metric.
Dermatologists diagnose malignancy in skin lesions based on their extensive training, experience from previous diagnoses, and their access to vast amounts of research. Their diagnosis is based on looking at a set of features, since a single feature alone cannot determine malignancy in the lesion. Experience and training-based learning is an important characteristic of neutral networks that makes it ideal for diagnosis application [10]. In this paper TDLS algorithm with back propagation neural network is proposed for accurate segmentation of melanoma images.
Fig.2: Architecture of the system
II.PROPOSED METHOD
The first step in the TDLS algorithm is to over-segment the corrected lesion image, dividing the image into a number of regions. This initial over-segmentation step is incorporated to increase the TDLS algorithm’s robustness to noise. Furthermore, it allows for the use of an efficient and fast classification algorithm, described to find the areas belonging to the skin lesion. The initial over-segmentation algorithm, adapted from the clustering algorithm, is described below. The main difference is that the clustering algorithm uses the image in the RGB colour space, while the TDLS algorithm converts the image to the XYZ colour space, as mentioned. The advantages of using the clustering algorithm as the initial over-segmentation algorithm is that it directly takes into account pixel location, is simple and computationally efficient.
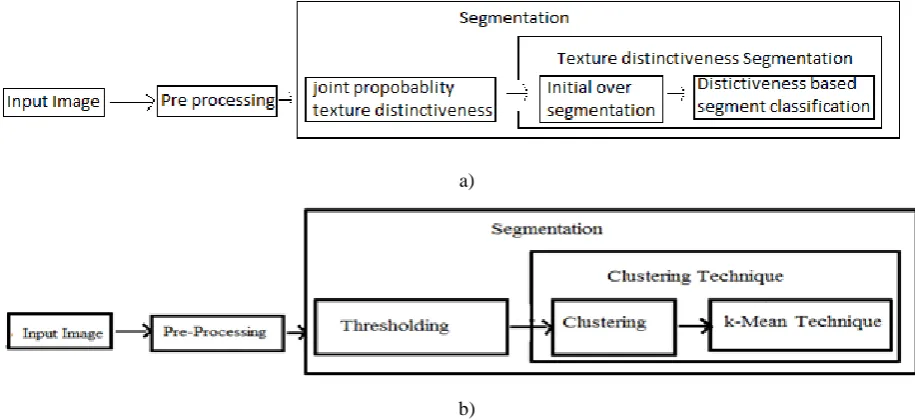
a)
b)
Fig 3: a) Algorithm flow chart highlighting steps in the TDLS Algorithm b) Simplified TDLS Algorithm
In the implementation of the TDLS algorithm as shown in the fig.3, the image is converted into XYZ color space. Terrillon et al. [11] found that the XYZ color space is to segment the skin region of human faces. Next step is to find local texture vector contains pixels in the neighborhood of size n centered on the pixel of interests. In the case of a multiple channels, patch centered at pixels and corresponding to channel A. the texture vector is constructed by concatenating each tA.s corresponding to the same pixel across all channels. For an image of size N x M, we have a set of texture vectors.
𝑇 = 𝑡𝑠𝑗 1 ≤ 𝑗 ≤ 𝑁 × M (1)
After extracting texture vectors, a two-step clustering algorithm is used. First, a k-means clustering algorithm is run, which is followed by learning a finite mixture model. K-means clustering finds K clusters of texture data. One limitation with k-means clustering is that it does not take into account any probabilistic information. Therefore, the second step is to apply finite mixture model clustering, in this implementation, a Gaussian distribution is assumed for all clusters and the model parameters are the distribution mean μ and distribution covariance Σ.
To measure similarity of two texture distributions, the metric lj, k is defined in (2). it gives the probability that the mean
of one texture distribution is a realization of mean of the other texture distribution let tj mean and covariance of
distribution Tj asymmetric, because when comparing most pairs of distribution, , Σi ≠ Σj . The measure of similarity
given in (3) is the average of lj,j and lk,j .
We are interested in finding distinct texture distributions. Because the lesion texture distribution are dissimilar form the normal skin texture distributions and also from other texture distributions due to color variation. The metric dj,k given in
(4) is the probability that a texture distribution is distinct from another texture distribution.
A TD metric Dj given in (5) is used to capture the dissimilarity of texture distribution Tj r
from the other texture distribution P(Tkr|l) is the probability of occurrence pixel begin associated with a texture distribution Tkr.
Dj= Σk=1kdj,k P(Tkr|l) (5)
In the case of normal skin texture distributions, the dissimilarity of one skin texture distribution from other skin texture distribution is very small. The TD metric for skin texture distribution is small overall. Lesion texture distributions are dissimilar from other skin and lesion texture distributions, so the textural distinctiveness metric is large.
The second main step in the TDLS algorithm is to find and classify regions in the input image as being part of the lesion based on the sparse texture distributions and their associated TD metric. The corrected lesion image is divided into a large number of regions using clustering algorithm [12]. Clustering contains two main steps: a sorting step and a merging step. In the first step, clustering sorts pixels in an image to determine the order in which pixels are compared. In the second step, clustering merges pairs of pixels into regions based on their similarity. The output of clustering is large number of regions.
A TD metric is calculated for each texture distribution based on the probability of it begins similar to other texture distributions. This information is combined with the contents of each region to determine a regional TD metric, DR. DR
represents the average TD across region R (6), where P(Tjr|R) is probability of a pixel begin associated with the jth
texture distribution in a region R.
DR= ΣK=1Kdj,k P(Tjr|R) (6)
Each region is classified as lesion or skin based on TD metric DR. The classification step is illustrated in (7), where y is
the resulting segmented map. It is 1 for lesion and 0 for normal skin. The threshold is denoted by r and it represents the decision boundary between the normal skin and lesion class. The threshold r is defined to divide the set of representative texture distributions into two classes, normal skin and lesion, and is also based on the TD metrics. It is determined by Otsu's threshold.
𝑦 (R) =1, 𝐷𝑅 ≥ 𝜏 (7) 0, 𝑜𝑡ℎ𝑒𝑟𝑤𝑖𝑠𝑒
III. DIFFERENT APPROACHES
A. Skin Cancer Recognition by Using a neuro-Fuzzy System
Image processing techniques, a neural network system (NN) and a fuzzy inference system were used in this study as promising modalities for detection of different types of skin cancer. The accuracy rate of the diagnosis of skin cancer by using the hierarchal neural network was 90.67% while using neuro-fuzzy system yielded a slightly higher rate of accuracy of 91.26% in diagnosis skin cancer type. The sensitivity of NN in diagnosing skin cancer was 95%, while the specificity was 88%. Skin cancer diagnosis by neuro-fuzzy system achieved sensitivity of 98% and a specificity of 89%.
The results of testing the studied sample of images by using hierarchal NN system gave 90.67%, accuracy, while using neuro-fuzzy system gave better results than using the hierarchal NN system alone, with accuracy rate of 91.26%. Image processing is the primary foundation of this study, and the concept of improving the means of extracting features of the skin image is the main recommendation for researchers to follow in the future. The output of both hierarchal NN and neuro-fuzzy systems depends on these features. The more accurate these feature are, the better the results will be. B. Neural Network
Features/patterns are given to a network via the input layer, which are connected to one or more hidden layers. The actual processing is done in the hidden layers through a system of weighted connections. The hidden layers are connected to output layer. The output layer provides the outcome of the processing or classification [13].
Most neural network contains some kind of learning function, which modifies the weights of the connections according to the training pattern presented to it. The individual neurons are trained with patterns, which is very similar to how the human brain learns to classify. This aspect of neural networks makes an ideal system for medical diagnosis, where learning to recognize patterns is the key to accurate diagnosis.
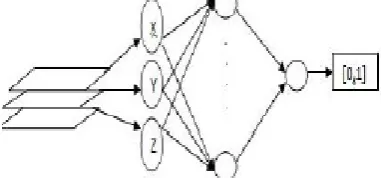
Fig 4: Structure of neural network
In this a back propagation neural network with one hidden layer is implemented to get the advantages of experience. The neural network learns the XYZ values of each pixel in the skin and lesion regions from the set of segmented images. The network responses in the output neuron and produces the 1 for lesion and 0 for skin. The structure of neural network is given in fig 4.
The output of TDLS algorithm is a binary image in which brighter pixels correspond to lesion and darker pixels corresponds to skin. The output of TDLS may not accurate due to thresholding. So it is given to neural network for testing. Based on the classification result of neural network, output of TDLS is corrected. Final output will be the more accurate segmented image.
Advantage: The proposed system is proved to be much convenient than the conventional Biopsy method. Since this method is Computer Based Diagnosis, there is no need for any skin removal for diagnosis. It requires only the Dermoscopic image. This methodology has got good accuracy also. By varying the Image processing techniques and Classifiers, the accuracy can be improved for this system
IV.EXPERIMENTAL RESULTS
The below fig.5 shows the experimental results of a FPGA implementation on skin cancer detection using the TDLS algorithm. As the project is by using FPGA, firstly the input image is separated into the pixel values. This pixels value is given as the input to the FPGA. In this project we are going to using the MATLAB and XILINX 10.1 software tool. The model illumination variation uses a clustering modelling algorithm and then using that model to correct the original photograph. A set of representative texture distributions are learned from the corrected photograph and texture distinctiveness metric is calculated for each distribution. Finally, a texture-based segmentation algorithm classifies regions in the photograph as normal skin or lesion based on the occurrence of representative texture distributions. The resulting segmentation can be used as an input to separate feature extraction and melanoma classification algorithms
Fig.5: (a) original image (b) pre-processing c) Segmentation
V. CONCLUSION
segmentation algorithm we can separate the normal skin and effected skin by using the TD metric. Any incorrectness in the segmented output of the Texture based segmentation algorithm is corrected.
REFERENCES
[1] M. E. Celebi, H. A. Kingravi, B. Uddin, H. Iyatomi, Y. A. Aslandogan, W. C. Stoecker, and R. H. Moss, “A methodological approach to the classification of dermoscopy images,” Comput. Med. Imag. Graph., vol. 33, no. 2, pp. 362-373, Sep.2007.
[2] B. Erkol, R. H. Moss, R. Joe Stanley, W. V. Stoecker, and E. Hvatum,“Automatic lesion boundary detection in dermoscopy images using gradient vector flow snakes,” Skin Res. Technol., vol. 11, no. 1, pp.17–26,2005.
[3] M. E. Celebi, H. A. Kingravi, H. Iyatomi, Y. A. Aslandogan, W. V. Stoecker, R. H. Moss, J. M. Malters, J. M. Grichnik, A. A. Marghoob, H. S. Rabinovitz, and S. W. Menzies, Border detection in dermoscopy images using statistical region merging,” Skin Res.Technol., vol. 14, no. 3, pp. 347–353, 2008.
[4] W. V. Stoecker, C.-S. Chiang, and R. H. Moss, “Texture in skin images:Comparison of three methods to determine smoothness,” Comput. Med.Imag. Graph., vol. 16, no. 3, pp. 179–190, 1992.
[5] L. Xu, M. Jackowskia, A. Goshtasby, D. Roseman, S. Bines, C. Yu, A. Dhawan, and A. Huntley, “Segmentation of skin cancer images,” ImageVis. Comput., vol. 17, pp. 65–74, 1999
[6] S.Hwang and M. E. Celebi, “Texture segmentation of dermoscopy images using Gabor filters and g-means clustering,” in Proc. Int. Conf.ImageProcess., 882 886.
[7] Jeffrey Glaister, Alexander Wong “Segmentation of Skin Lesions From Digital Images Using Joint Statistical Texture Distinctiveness”IEEE Trans.Bio.Med,April 2014,vol.61,no. 4.
[8] D. S. Rigel, R. J. Friedman, and A. W. Kopf, “The incidence of melanoma in the United States: Issues as we approach the 21st century,” J.
Amer. Acad. Dermatol., vol. 34, no. 5, pp. 839-847, 1996.
[9] Automatic Melanoma Detection Using MultiStage Neural Networks Nikhil Cheerla1, Debbie Frazier2 Student, Monta Vista High School, Cupertino, CA, USA 1 Teacher, and Biology, Monta Vista High School, Cupertino, CA, USA 2.
[10] J.-C. Terrillon, M. Shirazi, H. Fukamachi, and S. Akamatsu, “Comparative performance of different skin chrominance models and chrominance spaces for the automatic detection of human faces in color images,” in Proc. 4th IEEE Int. Conf. Autom. Face Gesture Recog., 2000, pp. 54–61.
[11] M. Celebi, H. M. Celebi, H. Iyatomi, G. Schaefer, and W. V. Stoecker, “Lesionborder detection in dermoscopy images,” Comput. Med. Imag. Graph. vol. 33, no. 2, pp. 148–153, 2009.
[12] R. Nock and F. Nielsen, “Statistical region merging,” IEEE Trans. Pattern Anal. Mach. Intell., vol. 26, no. 11, pp. 1452–1458, Nov 2004. [13] Bishop, M Christopher. Neural networks for pattern recognition. Oxford university press, 1995.
[14] M. E. Celebi, H. A. Kingravi, H. Iyatomi, Y. A. Aslandogan,W. V. Stoecker, R. H. Moss, J. M. Malters, J. M. Grichnik, A. A. Marghoob, H. S. Rabinovitz, and S. W. Menzies, “Border detection in dermoscopy images using statistical region merging,” Skin Res. Technol., vol. 14, no. 3, pp. 347–353, 2008.
[15] P. G. Cavalcanti, J. Scharcanski, andC. B. O. Lopes, “Shading attenuation in human skin color images,” in Advances in Visual Computing, G. Bebis, R. Boyle, B. Parvin, D. Koracin, R. Chung, R. Hammoud, M. Hussain, T. Kar-Han, R. Crawfis, D. Thalmann, D. Kao, and L. Avila, Eds., (ser. Lecture Notes in Computer Science), vol. 6453 Heidelberg, Germany: Springer, 2010, pp. 190–198.