Optimization of the Process Parameters of Wire Edm of A Hardened
Steel 60hrc Component by Taguchi Based Design of Experiments
P. SARITHA
Assistant Professor (Ph.D), Dept of Mechanical engineering, Anurag Group of Institutions,(Formerly CVSR Engineering College), Venkatapur(V), GhatkesarH. AMERESH
Assistant Professor (Ph.D), Dept of Mechanical engineering, Anurag Group of Institutions,(Formerly CVSR Engineering College), Venkatapur(V), GhatkesarBARMAVATU PRAVEEN Research Scholar, JJTU, Rajasthan & Assistant Professor (Ph.D), Dept of Mechanical
engineering, Anurag Group of Institutions,(Formerly CVSR Engineering College), Venkatapur(V), Ghatkesar.Y. AKSHAY KUMAR
M.TECH Assistant Professor , Dept of Mechanical engineering, Anurag Group of Institutions,(Formerly CVSR Engineering College), Venkatapur(V), GhatkesarABSTRACT
The Machining parameters tables provided by the machine tool manufacturers often do not meet the operator requirements and sometimes even do not even provide efficient guidelines to manufacturing engineers. Hence, a suitable selection of machining parameters of CNC wire cut electrical discharge machining (EDM) process is necessary.
In this project work we perform an experimental investigation to determine the parameters setting during the machining of Hardened steel 60HRC. The Taguchi method, a powerful tool for experimental design, is used to optimize the CNC-wire cut-EDM parameters. According to the Taguchi quality design Concept, a L9 (34)orthogonal array was used to
determine the S/N ratio, and an analysis of variance (ANOVA) and the F-test values were used to indicate the significant machining parameters affecting the machining performance.
From experimental results and through ANOVA and F-test values, the significant factors are determined for each machining performance criteria, such as the metal removal rate, surface roughness, Cylindricity and spark gap (gap width). Considering these significant CNC wire cut-EDM parameters, verification of the improvement in the quality characteristics for machining Hardened steel 60HRC was made with a confirmation test with respect to the
chosen initial or reference parameter setting. Mathematical models relating to the machining performance are established using the linear regression for the effective machining of Hardened steel 60HRC. The determined optimal combination of CNC-wire cut- EDM parameters obtained from the study satisfy the real requirement of quality machining of Hardened steel 60HRC in practice.
Keywords— Orthogonal Array, Taguchi, Wire Electro Discharge Machining, Hardened Steel 60Hrc, MRPI,ANOV
1. INTRODUCTION
Technologically advanced industries like aeronautics, nuclear reactors, automobiles, etc have been demanding materials like high temperature resistant alloys having ―high strength to weight‖ ratio. Researchers in the area of material science are developing materials having higher strength, hardness, toughness and other diverse properties. This also needs the development of improved cutting tool materials so that the productivity is not hampered.
economic cutting speeds) materials like titanium, stainless steel, nimonics and similar other high strength temperature resistant alloys, fiber-reinforced composites,stellites,ceramicsand difficult to machine alloys. Production of complex shapes in such materials by traditional methods is still more difficult. Other higher level requirements are better finish, low values of tolerances, higher production rates, etc. To meet such demands, different classes of machining processes have been developed. They are known as advanced machining processes.
These machine tools should not only be able to easily machine the difficult to machine materials to intricate and accurate shapes but also should be adaptable to automation. In order to meet this challenge a number of newer material removal processes have been developed to the level of commercial utilization. These newer methods are also called unconventional in the sense that conventional tools are not employed for metal cutting. Instead energy in its direct form is sued to remove material from the work piece. The range of applications by the newly developed machining processes is determined by the work material properties like electrical and thermal conductivities, melting temperature, electro chemical equivalent, etc. Some of these newly developed processes can also machine work pieces in the areas which are inaccessible for conventional machining processes. The use of these processes is becoming increasingly un avoidable and popular at the shop floor. These processes become still more important when one considers the precision machining and the ultra precision machining. Also high accuracy cannot be achieved in conventional machining processes where the material is removed in the form of chips. However they can be achieved in some of the advanced machining techniques whereby the material is removed in the form of atoms or molecules individually or in groups.
ELECTRIC DISCHARGE MACHINING (EDM)
Whenever sparking takes place between two electrical contacts, a small amount of material is removed from each of the contacts. This fact is realized and the attempts were made to harness and control the spark energy to employ it for useful purposes, say for
machining of metals. It was found that the sparks of short duration and high frequency are needed for efficient machining. Further, it was also observed that if the discharge is submerged in dielectric, the energy can be concentrated into a small area.
As soon as the potential across the electrodes crosses the breakdown voltage, the sparking takes place at the point of least electrical resistance. It usually occurs at the smallest inter-electrode gap. After each discharge, the capacitor recharges and the spark appears at the next narrowest gap. Occurrence of each spark generates heat energy which is shared in different modes by work piece, tool, dielectric, debris and other parts of the system.
The dielectric serves some important functions. It cools down the tool and work piece, cleans or flushes away the inter electrode gap and localizes the spark energy into a small cross sectional area. Energy content in each spark and frequency of sparking are governed by the conditions in the inter electrode gap.
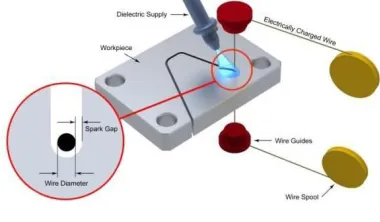
GENERAL WORKING PRINCIPLE
Fig 1.1: Principle of EDM process
Fig1.2: Wire EDM Process
Features of Wire EDM
1. Forming electrode adapted to product shape is not required.
2. Electrode wear is negligible. 3. Machined surfaces are smooth.
4. Geometrical and dimensional tolerances are tight.
5. Straight holes can be produced to close tolerances.
6. Machine can be operated unattended for a long time at high operating rate.
7. Complex structures can be machined with high machining accuracy.
PROBLEM STATEMENT
In this project work we attempt to optimize the Wire EDM process involved in the machining of the spool
bore of the body of an Electro Hydraulic Servo Valve (EHSV). It is an electrically operated valve that controls how hydraulic fluid is ported to an actuator. Servo valves and servo-proportional valves are operated by transforming a changing analogue or digital input signal into a smooth set of movements in a hydraulic cylinder. Servo valves can provide precise control of position, velocity, pressure and force with good post movement damping characteristics. The particular EHSV mentioned here is a type II EHSV that is used primarily in military and space applications. For example it is used in the Prithvi and Agni III missile series for wing tip control. As shown in the Fig: 1.10, the body of the EHSV has three bores, starting from the clockwise direction from the top, they are the nozzle bore, the spool bore and the filter bore. Of the three bores, the spool bore is the most important as this is the bore through which the spool is inserted. It is the position of the spool that is measured using a LVDT and is then demodulated and fed back to the controller where it is compared with the command signal. The controller drives the pilot stage until the error between command signal and feedback signal will be zero. Thus the position of the spool is proportional to the electric command signal. Hence the machining of the spool bore if of a high importance as far as the functionality of the component is considered.
Chapter-2
LITERATURE REVIEW
Y.S Liao et al. [1, 2] devised a method to determine the settings for the machining parameter settings for WEDM process. Based on the Taguchi quality design and the analysis of variance (ANOVA), the significant factors affecting the machining performance such as MRR, gap width ,surface roughness, sparking frequency ,average gap voltage, normal ratio(ratio of normal sparks to total sparks) are determined. By means of regression analysis, mathematical models relating the machining performance and various machining parameters are established.
Taguchi‘s parameter design significant machining parameters affecting the performance are identified as discharge current, pulse duration, pulse frequency, wire speed, wire tension & dielectric flow. In this study the relationship between control factors & responses like MRR, surface finish and kerf are established by means of non linear regression analysis resulting in a valid mathematical model.
Mu Tian Yan et al.[4] devised a new pulse discriminating and control system for process monitoring and control of the micro wire EDM process. This system functions by identifying four major gap states classified as open circuit, normal spark, arc discharge and short circuit based on based on characteristics of gap voltage waveform.
S. Thamizhmanii et al attempted to analyze the surface roughness produced by turning process on hard martensitic stainless steel by Cubic Boron Nitride cutting tool. The work piece material was hard AISI 440C martensitic stainless steel. Through this paper we have tried to get a better understanding of (hardened) Stainless Steel 440C.
Chapter-3
DESIGN OF EXPERIMENTS ON WIRE EDM
The design of experiment (DOE) is not a simple one step process but is actually a series of steps which must follow a certain sequence for the experiment to yield an improved understanding of product or process performance. Experimental design is a body of knowledge and techniques that assist the experimenter to conduct experiments economically analyze the data and make connections between the conclusions from the analysis and the original objectives of the investigation
A designed experiment is a simultaneous evaluation of parameters (factors) for their ability to affect the resultant average or variability of a particular product or process characteristic. To achieve this in an effective and statistically proper fashion, the levels of the factors are varied in a strategic manner. The results of the particular test combinations are observed, and the complete set of results is analyzed to determine the
influential factors and preferred levels and whether increasing or decreasing those levels will potentially lead to further improvement.
MAJOR STEPS INVOLVED IN AN
EFFECTIVE DESIGNED EXPERIMENT
1. State the problem or area of concern. 2. Select the objective of the experiment. 3. Select the quality characteristic and
measurement system.
4. Identify control and noise factors (Taguchi centric)
5. Select the levels of the factors.
6. Select the appropriate orthogonal arrays (OA). 7. Select interactions that may influence the
selected quality characteristics or go back to step 4 (iteration).
8. Assign factors to OA and locate interactions. 9. Conduct tests described by trials in the OA. 10. Analyze and interpret results of the
experimental trials.
11. Conduct confirmation experiment.
DEVELOPMENT OF ORTHOGONAL DESIGNS
Dr Genichi Taguchi suggested the use of orthogonal arrays for designing the experiments. He has also developed the concept of linear graph which simplifies the design of OA experiments. These designs can be applied without acquiring advanced statistical knowledge. The main advantage of these designs lies in their simplicity and easy adaptability to more complex experiments involving number of factors with different number of levels. They provide the desired information with the least possible number of trials and yet reproducible results with adequate precision. These methods are usually employed to study the main effects and applied in screening experiments.
The resource difference in terms of the number of experiments conducted between OA and full factorial experimentation is given below.
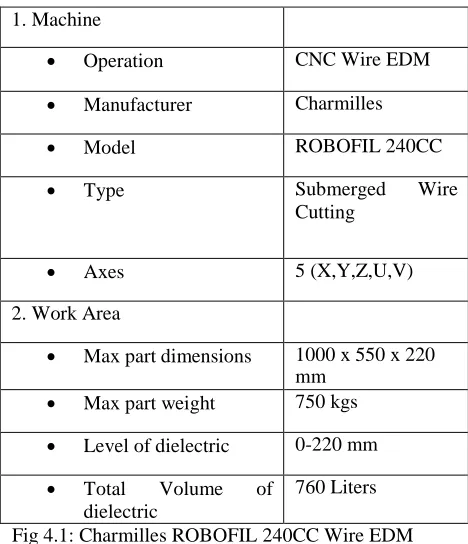
4.1 CHARMILLES ROBOFIL 240CC WIRE EDM
The machine used for the machining of the component is a Charmilles ROBOFIL 240CC Wire EDM Machine.
The specifications of the machine are:-
Table 4.1 Charmilles Robofil 240 cc specifications:
Selection of orthogonal arrays
The selection of which OA to use predominantly depends on the following factors in order of priority [16]:
The number of factors and interactions of interest
The number of levels for the factors of interest
The desired experimental resolution of cost limitations
The first two items determine the smallest orthogonal array that is possible to use, but this will automatically be the lower resolution lowest-cost experiment. The experimenter may choose to run a larger experiment consisting of a larger OA which will have higher resolution m potential but will be more expensive to complete.
In Taguchi designs, a measure of robustness used to identify control factors that reduce variability in a product or process by minimizing the effects of uncontrollable factors (noise factors). Control factors are those design and process parameters that can be controlled. Noise factors cannot be controlled during production or product use, but can be controlled during experimentation. In a Taguchi designed experiment, you manipulate noise factors to force variability to occur and from the results, identify optimal control factor settings that make the process or product robust, or resistant to variation from the noise factors. Higher values of the signal-to-noise ratio (S/N) identify control factor settings that minimize the effects of the noise factors
Chapter 4
EXPERIMENTAL ANALYSIS OF WIRE EDM
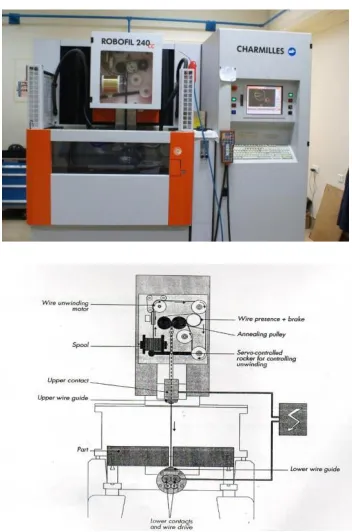
Fig 4.1: Charmilles ROBOFIL 240CC Wire EDM machine
So urc e
DO F
Adj SS
Adj MS
F- Val ue
P.val ue
% Rank of Signif icanc e
A 2 0.524
2
0.262 08
4.94 0.168 27.68
% 2
C 2 1.051
5
0.525 74
9.92 0.092 55.57
% 1
D 2 0.317
5
0.158 74
2.99 0.250 16.75
% 3
Err or
2 0.106
0
0.053 01 Tot
al
8 1.999
2
Number of factors
Number of levels
Number of experiments
Full factorial
Taguchi
3 2 8 4
7 2 128 8
15 2 32768 16
4 3 81 9
13 3 1594323 27 1. Machine
Operation CNC Wire EDM
Manufacturer Charmilles
Model ROBOFIL 240CC
Type Submerged Wire
Cutting
Axes 5 (X,Y,Z,U,V)
2. Work Area
Max part dimensions 1000 x 550 x 220 mm
Max part weight 750 kgs
Level of dielectric 0-220 mm
Total Volume of dielectric
Fig 4.2: Schematic of ROBOFIL 240CC
WORK MATERIAL USED
The different sets of experiments were performed using a 5 axis Charmilles ROBOFIL 240CC wire cut EDM machine, Component Material is Hardened Stainless steel 60HRC.
The electrode (wire) used is an ACTCUT 500 Brass wire of 0.25mm diameter.
Chapter-5
Results and discussion
ANOVA-Analysis of Variance
CYLINDRICITY
The design of the experiment is fully saturated. There is a factor available in every available column in the L9 array. Therefore we have to pool one of our factors to provide an error term with which to calculate the F- ratio. Hence we remove the term that has the smallest value of ―Adj MS‖ from the model and then perform ANOVA using MINITAB 17 software. Removing the term with the smallest value of ‗Adj MS‖ will not
affect the result as it has the smallest F-ratio i.e. the weakest effect. The rank of significance is dependent on the ‗%‘ column which is obtained from the F-values of the corresponding factors. The rank of significance arranges the factors in their order of significance towards that particular response parameter starting from 1 as the most significant and so on.
For Cylindricity factor ‗B‘ has the lowest ―Adj MS‖ value. Hence we remove B from the table and perform ANOVA for the remaining terms.
Table 5.13: ANOVA Table for Cylindricity
SURFACE ROUGHNESS
For Surface roughness factor ‗C‘ has the lowest ―Adj MS‖ value of 0.004015.Hence we remove C from the table and perform ANOVA for the remaining terms.
Table 5.14: ANOVA Table for Surface
roughness
MRR
For MRR, the factor ―C‖ has the lowest ‗Adj MS‖ value of 0.000015.hence we remove C from the table
Sou rce
D O
F
Adj SS Adj
MS F-
Val
ue P.va
lue
% Rank
of
Signific
ance
A 2 0.030
696
0.015
348 3.8
2 0.2
07 50.9
3% 1
B 2 0.008
089
0.004
044 1.0
1 0.4
98 13.4
7% 3
D 2 0.021
452
0.010
726 2.6
7 0.2
72 35.6
0% 2
Err
or
2 0.008
030
0.004
015
Tot
al
8 0.068
267
and perform ANOVA for the remaining terms.
The regressive analysis gives us the mathematical equation
E = 2.4 + 0.027 A - 0.100 B + 0.0412 C + 0.123 D
Here E = Theoretical value of Cylindricity
A, B, C, D = Input Parameters
SURFACE ROUGHNESS
The regressive analysis gives us the mathematical equation
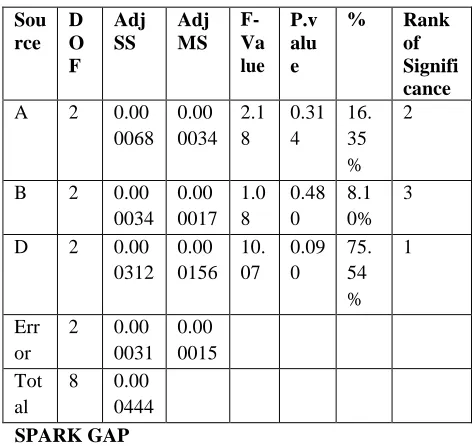
SPARK GAP
For Spark Gap, the factor D has the lowest ―Adj MS‖ of 0.000.Hence we remove D from the table and perform ANOVA for the remaining terms.
Table 5.16: ANOVA Table for Spark Gap
Sou rce
D O F
Adj SS
Adj MS
F- Va lue
P.v alu e
% Rank of Signifi cance A 2 0.00 0.00 10. 0.08 42. 1
0002 0001 69 6 50 % B 2 0.00 0.00 7.0 0.12 27. 2
0001 0001 0 5 83 % C 2 0.00 0.00 7.4 0.11 26. 3
0001 0001 6 8 66 % Err 2 0.00 0.00
or 0000 0000 Tot 8 0.00
al 0005
MATHEMATICAL MODELS
The mathematical models are created using linear regression in MINITAB 17 software.
G = 5.200 - 0.0705 A - 0.0867 B - 0.00400 C - 0.2226 D
Here G = Theoretical value of Surface Roughness
A, B, C, D = Input Parameters
MRR
The regressive analysis gives us the following mathematical equation
F = 0.1566 - 0.00225 A + 0.00465 B - 0.000224 C + 0.02194 D
Here F = Theoretical value of MRR
A, B, C, D = Input Parameters
SPARK GAP
The regressive analysis gives us the following mathematical equation
H = -0.1578 + 0.000575 A + 0.000500 B + 0.000046 C + 0.000538 D
Here H = Theoretical value of Spark Gap
A, B, C, D = Input Parameters
CONFIRMATION TESTS.
CYLINDRICITY
•From the results of the experiments performed and the Sou
rce D O F
Adj SS
Adj MS
F- Va lue
P.v alu e
% Rank of Signifi cance A 2 0.00
0068 0.00 0034
2.1 8
0.31 4
16. 35 %
2
B 2 0.00 0034
0.00 0017
1.0 8
0.48 0
8.1 0%
3
D 2 0.00 0312
0.00 0156
10. 07
0.09 0
75. 54 %
1
Err or
2 0.00 0031
0.00 0015 Tot
al
data obtained (chapter 4-5), we can determine the optimum machine setting for best Cylindricity.
•The required setting is
Table 5.17: Optimum settings for Cylindricity
•The confirmation test has to be performed at the setting A1B3C1D2
•Result for the confirmation experiment for Cylindricity is:-
SURFACE ROUGHNESS
•From the results of the experiments performed and the data obtained we can determine the optimum machine setting for best surface roughness.
•The required setting is
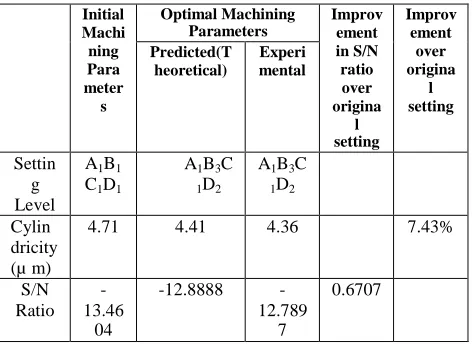
Table 5.18: Results of confirmation experiments for
Cylindricity Initial Machi ning Para meter s Optimal Machining Parameters Improv ement in S/N ratio over origina l setting Improv ement over origina l setting Predicted(T heoretical) Experi mental Settin g Level A1B1 C1D1
A1B3C
1D2
A1B3C
1D2
Cylin dricity (µ m)
4.71 4.41 4.36 7.43%
S/N Ratio
- 13.46
04
-12.8888 - 12.789
7
0.6707
•The confirmation test has to be performed at the setting A3B2C2D2
•Results from the confirmation test for Surface Roughness is:
Results of confirmation experiments for surface roughness
Initial Machining Parameters Optimal Machining ParametersImprovement in S/N ratio over original setting Improvement over original setting.
Table5.20: Results of confirmation experiments for surface roughness Initial Machi ning Param eters Optimal Machining Parameters Improv ement in S/N ratio over origina l setting Improv ement over origina l setting Predicted(T heoretical) Experi mental Settin g Level
A1B1C1
D1
A3B2C2
D2
A3B2C2
D2 Surfa ce Roug hness 0.84,0. 84,0.88
0.5342 0.54,0.5
2,0.50
39.06%
S/N Ratio
1.3757 5.4491 5.6756 4.2999
MRR
•From the results of the experiments performed and the data obtained we can determine the optimum machine setting for best MRR
•The required setting is
Optimum settings for MRR
Factor Level
Level Value of Parameter at Corresponding
A 2 49
B 3 7.5
C 1 40
D 2 1.5
•The confirmation test has to be performed at the setting A2B3C1D2
•Result for the confirmation experiment for cylindricity is:-
Table 5.22: Results of confirmation experiments for MRR
Initi Optimal Machining Impro Impro
al Parameters vemen vemen
Mac Predicted( Experi t in t over hini
ng Par
Theoretical )
mental S/N ratio over
45
S/N Ratio
18.0 96
18.173 18.315 0.219
SPARK GAP
From the results of the experiments performed and the data obtained we can determine the optimum machine setting for best Spark Gap
The required setting is
Table 5.23: Optimum settings for spark gap
Factor Level Value of
Parameter at Corresponding Level
A 3 50
B 3 7.5
C 3 60
D 3 1.6
The confirmation test has to be performed at the setting A3B3C3D3
Result for the confirmation experiment for Spark Gap is:-
Table 5.24: Results of confirmation experiments for spark gap
Table 5.25 Percentage of Improvement in result
S.l No Name of the factor Percentage of improvement
1 Cylindricity 7.43%
2 Surface Roughness 39.06%
3 MRR 17.17%
4 Spark Gap 2.49%
Graph 5.9 Percentage of Improvement in results
For the given Machining Parameters maximum improvement observed in surface roughness
CONCLUSION
On the basis of experimental results, the calculated S/N
ratios, the analysis of ANOVA, F-test values,
confirmation tests and the regression analysis, the
following conclusions are drawn for the effective
machining of Hardened Stainless Steel 60HRC by the
CNC-wire cut EDM process:
1. For optimum Cylindricity (decreased) the recommended parametric combination is
A B C D where A is 48.1 V, B3 is 7.5µs,
1 3 1 2 1
C1 is 40 KHz and D2 is 1.5N. ame
ters
origina l setting Settin
g Level
A1B
1C1
D1
A2B3C1
D2
A2B3C1
D2
MRR (mm3/ s)
0.08 954
0.105175 0.1054 55
17.77%
S/N Ratio
- 20.9 597
-19.5617 - 19.583 7
1.376
Initi al Ma chin ing Par ame ters
Optimal Machining Parameters
Impro vemen t in S/N ratio over origina l setting
Imp rove men t over orig inal setti ng Predicted(T
heoretical)
Experi mental
Settin g Level
A1B
1C1
D1
A3B3C3
D3
A3B3C3
D3
Spark Gap
- 0.12
2. For optimum surface roughness (decreased) the recommended parametric combination is A3B2C2D2where A3 is 50 V, B2 is 7µs, C2 is
50 KHz and D2 is 1.5 N.
3. For optimum MRR (increased), the recommended parametric combination is A2B3C1D2where A2 is 49 V, B3 is 7.5µs, C2 is
40 KHz and D2 is 1.5 N.
4. For optimum Spark Gap (decreased) the parametric combination is A3B3C3D3where A3
is 50V, B3 is 7.5µs, C3 is 60 KHz and D3 is
1.6N.
5. The control parameters in order of their significance for affecting Cylindricity are frequency, set value of average machine voltage, wire tension and interval between two pulses.
6. The control parameters in order of their significance for affecting surface roughness are set value of average machine voltage, wire tension, interval between two pulses and frequency.
7. The control parameters in order of their significance for affecting MRR are wire tension, set value of average machine voltage, Interval between two pulses and frequency. 8. The control parameters in order of their
significance for affecting spark gap are set value of average machine voltage, interval between two pulses, frequency and wire tension.
9. Mathematical models for different machining performance characteristics of the wire EDM process have been proposed by means of linear regression and are as follows.
Cylindricity = 2.4 + 0.027 A - 0.100 B + 0.0412 C + 0.123 D
Surface roughness = 5.200 - 0.0705 A - 0.0867 B - 0.00400 C - 0.2226 D
MRR = 0.1566 - 0.00225 A + 0.00465 B - 0.000224 C + 0.02194 D
Spark gap = -0.1578 + 0.000575 A + 0.000500 B + 0.000046 C + 0.000538 D
Where A= set value of average machine voltage, B= interval between two pulses, C= frequency and D= wire tension
10. The ANOVA analysis can be made more accurate and significance of all 4 factors can be calculated by increasing the OA from L9 to
L18 or L27.
11. By setting the machine to the parametric combination of A1B3C1D2 instead of the initial
setup of A1B1C1D1 the Cylindricity has
decreased from 4.71µ m to 4.36µm.An optimization of 7.43%
12. By setting the machine to the parametric combination of A3B2C2D2 instead of the initial
setup of A1B1C1D1 the surface roughness has
decreased from an average of 0.8533µm to an average of 0.52µ m .An optimization of39.06%.
13. By setting the machine to the parametric combination of A2B3C1D2 instead of the initial
setup of A1B1C1D1 the MRR has increased
from 0.089540 mm3/s to 0.105455 mm3/s. An optimization of 17.77%.
14. By setting the machine to the parametric combination of A3B3C3D3 instead of the initial
setup of A1B1C1D1 the Spark Gap has been
decreased from 0.1245 to 0.1214.Hence optimized by 2.49%.
FUTURE SCOPE:
Interactions between response parameters can be used to find the optimal parametric arrangement for a combination of response parameters all taken at once.
Similar process can be applied to other manufacturing techniques after identifying their
Signal and Noise factors.
The mathematical models obtained can be combined with Operational research techniques to obtain a range of working conditions for the required output.
Application of Genetic Algorithm can help obtain a global parametric arrangement.
REFERENCE
[1]. Y.S. Liao, Y.Y. Chu and M.T. Yan, ―Study of wire breaking process and monitoring of WEDM‖, International Journal of Machine Tools & Manufacture, 37 (1997) pp. 555-567.
[2].Y.S Liao,J.T.Huang, ―A study on the machining parameter optimization of WEDM‖, Journal of Material Processing Technology, 71(1997) pp. 487-493
[3]. S.S Mahapatra, Amar Pattnaik,‖Optimization of WEDM process parameters using Taguchi method‖, International Journal of Advanced manufacturing Technology (2006)
[4].Mu-Tian Yan,Hsing – TsungChien,‖ Monitoring & Control of the micro wire –EDM process‖, International Journal of Machine Tools &Manufacture, 47(2007) pp.148-157.
[5].Williams, R.E., Rajurkar, K.P., 1991, "Study of Wire Electrical Discharge Machining Surface Characteristics", Journal of Materials Processing Technology, Vol. 28, pp.486-493.
[6].Asoken P, Ravi Kumar R, Jeypaul R, Santhi M, ―Development of multi-objective optimization models for electrochemical machining process‖,International Journal of Advanced Manufacturing Technology 39, 2008, 55-63.
[7]. Munda .J and Bhattacharyya .B, "Investigation into electrochemical micromachining (EMM) through response surface methodology based approach", International Journal for Advanced Manufacturing Technology, Vol.35, pp.821-832, 2008