Scholarship@Western
Scholarship@Western
Electronic Thesis and Dissertation Repository
8-8-2014 12:00 AM
Automated Image Interpretation for Science Autonomy in Robotic
Automated Image Interpretation for Science Autonomy in Robotic
Planetary Exploration
Planetary Exploration
Raymond Francis
The University of Western Ontario Supervisor
K. McIsaac
The University of Western Ontario Joint Supervisor G. R. Osinski
The University of Western Ontario
Graduate Program in Electrical and Computer Engineering
A thesis submitted in partial fulfillment of the requirements for the degree in Doctor of Philosophy
© Raymond Francis 2014
Follow this and additional works at: https://ir.lib.uwo.ca/etd
Part of the Artificial Intelligence and Robotics Commons, Atmospheric Sciences Commons, Geology Commons, Meteorology Commons, Numerical Analysis and Scientific Computing Commons, Operational Research Commons, Other Aerospace Engineering Commons, Other Earth Sciences Commons, Other Electrical and Computer Engineering Commons, Other Engineering Commons, Other Oceanography and Atmospheric Sciences and Meteorology Commons, Robotics Commons, Signal Processing Commons, Systems Engineering Commons, Systems Engineering and Multidisciplinary Design Optimization Commons, and the The Sun and the Solar System Commons
Recommended Citation Recommended Citation
Francis, Raymond, "Automated Image Interpretation for Science Autonomy in Robotic Planetary Exploration" (2014). Electronic Thesis and Dissertation Repository. 2250.
https://ir.lib.uwo.ca/etd/2250
This Dissertation/Thesis is brought to you for free and open access by Scholarship@Western. It has been accepted for inclusion in Electronic Thesis and Dissertation Repository by an authorized administrator of
(Thesis format: Integrated Article)
by
Raymond Francis
Graduate Program in Electrical and Computer Engineering
A thesis submitted in partial fulfillment
of the requirements for the degree of
Doctor of Philosophy
The School of Graduate and Postdoctoral Studies
The University of Western Ontario
London, Ontario, Canada
c
Advances in the capabilities of robotic planetary exploration missions have increased the wealth of scientific data they produce, presenting challenges for mission science and operations imposed by the limits of interplanetary radio communications. These data budget pressures can be relieved by increased robotic autonomy, both for onboard operations tasks and for decision-making in response to science data.
This thesis presents new techniques in automated image interpretation for natural scenes of relevance to planetary science and exploration, and elaborates autonomy scenarios under which they could be used to extend the reach and performance of exploration missions on planetary surfaces.
Two computer vision techniques are presented. The first is an algorithm for autonomous classification and segmentation of geological scenes, allowing a photograph of a rock outcrop to be automatically divided into regions by rock type. This important task, currently performed by specialists on Earth, is a prerequisite to decisions about instrument pointing, data triage, and event-driven operations. The approach uses a novel technique to seek distinct visual regions in outcrop photographs. It first generates a feature space by extracting multiple types of visual information from the image. Then, in a training step using labeled exemplar scenes, it applies Mahalanobis distance metric learning (in particular, Multiclass Linear Discriminant Analysis) to discover the linear transformation of the feature space which best separates the geological classes. With the learned representation applied, a vector clustering technique is then used to segment new scenes.
The second technique interrogates sequences of images of the sky to extract, from the motion of clouds, the wind vector at the condensation level — a measurement not normally available for Mars. To account for the deformation of clouds and the ephemerality of their fine-scale features, a template-matching technique (normalized cross-correlation) is used to mutually register images and compute the clouds’ motion.
Both techniques are tested successfully on imagery from a variety of relevant analogue environments on Earth, and on data returned from missions to the planet Mars. For both, scenarios are elaborated for their use in autonomous science data interpretation, and to thereby automate certain steps in the process of robotic exploration.
Keywords: robotic autonomy, planetary exploration, computer vision, natural scene inter-pretation, distance metric learning, machine learning, Mahalanobis distance, Linear Discrim-inant Analysis, image registration, normalized cross-correlation, planetary science, geology, atmospheric science
Chapters 3 through 6 represent technical papers prepared for other fora before their integration here to describe the present research program. Each has several co-authors, a testament to the collaborative and interdisciplinary nature of the research.
Kenneth McIsaac, co-author on chapters 3 – 6, is the student’s primary research su-pervisor in the graduate program in Electrical and Computer Engineering. He provided guidance throughout the research program, including in the selection and formulation of the problems, and selection and evaluation of techniques to address them. He also provided support in the presentation of the work in each forum, especially for chapter 5.
Gordon R. Osinski, co-author on chapters 3 – 6, is the student’s co-supervisor, providing guidance especially in planetary geology. He provided insight and instruction in the practice of terrestrial and planetary field geology, including an understanding of the types of problems to be solved and the operational implications of tools to address them. He led, or supervised, most of the field expeditions on which data was gathered for each investigation reported here.
John Moores, co-author on chapters 5 and 6, is the student’s supervisor in the Mars Science Laboratory (MSL) mission science team, and became an academic co-supervisor during the research program. He originated the technique of manual cloud-tracking for wind estimation on the Mars Phoenix mission, and proposed the project to automate it. He provided access to the MSL mission, allowing new data to be gathered and the automation work to be funded.
David R. Thompson, co-author on chapters 3 and 4, hosted and supervised the stu-dent as a Visiting Stustu-dent Researcher at the NASA Jet Propulsion Laboratory, California Institute of Technology. He provided guidance in machine learning techniques and in-terpretation of natural scenes in the context of exploration, and led a field expedition on which much of the data for the geologically-focused investigation was gathered.
Claire Newman, co-author on chapter 6, is a colleague on the MSL science team and a specialist in climate modeling and atmospheric science. She provided the data from her work with the MarsWRF model to support interpretations and conclustions drawn from the MSL wind observations presented in chapter 6. This included preparing Figure 6.4.
David Choi, co-author on chapter 5, was consulted on past experience in techniques for feature-based tracking of clouds in the atmosphere of Jupiter.
Moreover, there is an infinite number of worlds, some like this world, others unlike it. . . . And further, we must not suppose that the worlds have necessarily one and the same shape. For nobody can prove that in one sort of world there might not be contained, whereas in another sort of world there could not possibly be, the seeds out of which animals and plants arise and all the rest of the things we see. . .
Further, we must hold that to arrive at accurate knowledge of the cause of things of most moment is the business of natural science, and that happiness depends on this (viz. on the knowledge of celestial and atmospheric phenomena), and upon knowing what the heavenly bodies really are, and any kindred facts contributing to exact knowledge in this respect.
Epicurus,Letter to Herodotus, circa 300 BCE
This thesis is the product of a complex, interdisciplinary, and very busy research program which would not have been possible without the support of a large number of people. On reflection, the number of rich experiences, enabled by great teams of people, that I’ve been able to take part in during this degree program is remarkable, and I’m very thankful.
Dr. Ken McIsaac has provided throrough, helpful, and close support and guidance through-out the research program. He has consistently made time to consult on this work, despite his numerous other responsibilities. His guidance has consistently been helpful, timely, and re-spectful, and has allowed a level of close co-operation that greatly enhanced both the work and my experience as a graduate student. His willingness to support a complex and ambitious re-search program with numerous collaborators and complementary elements enabled the success of this research, and allowed me to gain experience and knowledge I could not otherwise have had.
Dr. Gordon Osinski provided an essential element to this program – close consultation and support from an experienced expert in planetary geology. His active field program afforded me experiences far beyond what is normally available to a student of Electrical and Computer Engineering. He assigned me to rare and valued slots on field expeditions to remote arctic research sites, and trusted me with important roles in his analogue mission research project. From these I gained the underestanding of field geology, and of mission operations to support it, that I needed to formulate and pursue this research program.
Dr. John Moores brought an unexpected and unparalleled opportunity in his offer to partic-ipate in a proposal to the Mars Science Laboratory Participating Scientist program. Supporting MSL, both in developing the automated data interpretation tools, and in learning to work in mission operations for a rover on the surface of Mars has been an exciting, humbling, and fulfilling experience. It has greatly enhanced this research program — I can’t think of a better activity to enrich a degree in robotics, or to demonstrate the value of engineers understanding well the science served by the tools they build.
Along with John, several members of the MSL science team have been very helpful in preparing the observation campaign reported in this thesis, and in guiding me through my training in mission operations. These include Keri Bean, Mark Lemmon, Claire Newman, Michael Mischna, Manuel de la Torre Juarez, Michael Wong, Tim McConnochie, Amy Culver, and Roger Wiens.
Dr. David Thompson, of the Jet Propulsion Laboratory, provided a tremendously valuable opportunity to extend and enrich this research by hosting me under the JPL Visiting Student Researchers Program. His close support helped guide the development of the machine learning tools and their application to natural scenes, and the immersion in the JPL environment, the
Bue, and Bill Abbey.
Here at Western, the Centre for Planetary Science and Exploration (CPSX) provided an-other fertile environment for learning what I needed to complete this work. The ability to follow nearly all elements of the planetary science graduate program, in addition to the full program in engineering, was a rare opportunity that paid back well for the extra effort it de-manded. Immersion in a large and active group conducting research on nearly every aspect of planetary exploration provided no shortage of new knowledge and camaraderie, and filled in the context for my own efforts to contribute to the field.
Much of what I learned came from working closely with a number of colleagues, especially Dr. Osinski’s students, on field expeditions. Particular thanks for helping my field studies go to Cassandra Marion-Beauchamp, Marc Beauchamp, Annemarie Pickersgill, and Marianne Mader, along with Tim Barfoot and Braden Stenning of the University of Toronto Institute for Aerospace Studies, Anthony Jenkinson of the Innu Nation, and the anonymous employee of Innu Mikun Airlines who made sure their Twin Otter had an emergency survival kit.
Thanks as well to those whose patience and guidance let me wade into the new world of planetary science more easily, including Bhairavi Shankar, Alexandra Pontefract, Emily McCullough, Melissa Battler, Haley Sapers, Mary Kerrigan, Parshati Patel, Alyssa Gilbert, Michael Bramble, and many others along the way.
Adam Dalziel, Matthew Gillespie, Justin Guay, Steven Schaffer, and Matthew Cross all helped out with making ends meet on one or more logistics problems for research trips.
Thanks to Piotr Jasiobedzki, Nadeem Ghafoor, Michel Bondy, Ho-Kong Ng, and Cameron Dickinson for supporting and facilitating the internship at MDA Space Missions early in the degree program.
Annemarie Pickersgkill provided a great help in editing this document.
Finally, I’d like to thank my parents, Claude and Heather Francis, for a lifetime of uncom-promising support. Writing a document like this starts with learning to read; the suggestion that the world and the study of it is interesting; and the idea that goals are reached by building oneself into the kind of person who can achieve them. They gave me all of these, and more.
Principal funding for this project came in the form of a PhD scholarship from the NSERC CREATE Canadian Astrobiology Training Program. The Canadian Space Agency funded the MSL participation, through a grant to Dr. Moores.
The implementation of Linear Discriminant Analysis makes use of the Matlab Toolbox for Dimensionality Reduction v0.8.1, produced and distributed by Laurens van der Maaten of the Technische Universiteit Delft.
Abstract ii
Co-authorship statement iii
List of Tables xi
List of Figures xii
List of Abbreviations xiv
1 Introduction, Context, and Motivation 1
1.1 Context: Planetary exploration . . . 2
1.1.1 Planetary science . . . 2
1.2 The challenge of communications . . . 4
1.3 Addressing the problem: autonomous science . . . 6
1.4 Research problem . . . 6
1.4.1 Segmentation of images of rock outcrops by geological unit . . . 8
1.4.2 Cloud-tracking for winds-aloft studies on Mars . . . 9
1.5 Research contributions . . . 10
Bibliography . . . 12
2 Literature Review and Background 14 2.1 Image processing for classification . . . 14
2.1.1 Natural scenes . . . 14
2.1.2 Complex and variable natural scenes: the example of medical imaging . . . 15
2.2 Geological classification . . . 18
2.2.1 Image-processing for geology . . . 18
2.2.2 Machine learning . . . 20
2.2.3 Distance metric learning . . . 22
2.2.4 Linear Discriminant Analysis . . . 24
2.2.5 Data clustering . . . 26
2.2.6 Evaluating segmentations . . . 27
2.2.7 Approach . . . 29
2.3 Atmospheric applications: Tracking clouds . . . 31
2.3.1 Remote sensing . . . 32
2.3.4 Approach . . . 35
Bibliography . . . 38
3 Autonomous Mapping of Outcrops Using Multiclass Linear Discriminant Analysis 49 3.1 Introduction . . . 49
3.1.1 Improving scientific throughput . . . 50
3.1.2 Geological investigations: In-place materials and contacts . . . 50
3.1.3 Present work . . . 51
3.2 Existing techniques . . . 51
3.2.1 Geological classification . . . 51
3.2.2 Distance metric learning . . . 52
3.3 Method . . . 53
3.3.1 Strategy . . . 53
3.3.2 Channel set . . . 53
3.3.3 Learning step . . . 54
3.3.4 Assessing the segmentation . . . 55
3.4 Experiment design . . . 55
3.5 Results . . . 56
3.5.1 Scene types . . . 58
Type A: Basalt blocks and sand . . . 58
Type B: Massive basalt and lahar deposit . . . 58
Type C: Layered volcanic deposits . . . 59
Type D: Complex intermixed volcanic materials . . . 59
Type E: Impact breccia . . . 60
Type F: Mineralized veins in Martian sandstone . . . 60
3.5.2 Discussion . . . 62
3.6 Conclusion . . . 65
Bibliography . . . 67
4 Autonomous Rock Outcrop Segmentation as a Tool for Science and Exploration Tasks in Surface Operations 70 4.1 Progress and constraints in planetary exploration . . . 70
4.2 Exploring a geological setting . . . 73
4.3 Completing the picture with chemistry and composition . . . 75
4.3.1 Remote-sensing instruments . . . 75
4.3.2 Contact science instruments . . . 75
4.3.3 Sample-analysis instruments . . . 76
4.3.4 A progressive investigation sequence and the place for autonomy . . . . 76
4.4 The visual segmentation algorithm . . . 78
4.5 Autonomy scenarios enabled by visual outcrop mapping . . . 79
4.5.1 The map as data product . . . 79
4.5.2 Regional mapping . . . 79
4.5.3 Data triage . . . 80
4.5.6 Enabling contact science . . . 81
4.5.7 Strategic use to improve mission throughput . . . 82
4.6 Conclusion . . . 82
Bibliography . . . 83
5 Observations of Wind Direction by Automated Analysis of Images from Mars and the MSL rover 89 5.1 Introduction . . . 89
5.1.1 Context . . . 89
5.1.2 Present work . . . 90
5.1.3 Contents . . . 90
5.2 Motivation . . . 91
5.2.1 Atmospheric science . . . 91
5.2.2 Operational efficiency . . . 91
5.3 Approach . . . 92
5.3.1 Background . . . 92
5.3.2 Technique . . . 92
5.4 Current results . . . 94
5.4.1 Performance for terrestrial clouds . . . 94
5.4.2 Application to imagery from the Phoenix mission . . . 103
5.4.3 Limitations . . . 105
5.5 Application to the Mars Science Laboratory (MSL) mission . . . 106
5.6 Future work . . . 107
5.6.1 The dust case . . . 108
5.6.2 On-board processing . . . 108
Bibliography . . . 109
6 Winds Aloft Measured by Atmospheric Imaging on the Mars Science Labora-tory Mission, and the Case for Onboard Autonomy 111 6.1 Autonomous image processing for upper-winds estimation . . . 112
6.2 Observations from the Mars Science Laboratory mission . . . 114
6.2.1 Zenith imaging for cloud-tracking . . . 114
6.2.2 Rover Environmental Monitoring Station (REMS) wind sensor . . . 114
6.2.3 Comparison of winds at the surface and aloft . . . 115
6.2.4 Comparison to modeling work . . . 117
6.3 Limitations on cloud-tracked wind observations . . . 121
6.3.1 Visibility of clouds . . . 121
6.3.2 Solar geometry . . . 122
6.3.3 Dynamics assumptions . . . 122
6.3.4 Wind speed ambiguity . . . 123
6.3.5 Scarce spacecraft resources . . . 123
6.3.6 Data budgets . . . 123
6.4 Scenarios for on-board autonomy . . . 124
6.4.3 Data triage . . . 125
6.4.4 Hardware . . . 126
6.5 Conclusions . . . 127
Bibliography . . . 128
7 Discussion and Future Work 133 7.1 Making use of geological maps in exploration . . . 133
7.1.1 Instrument targeting . . . 134
7.1.2 Regional mapping . . . 136
7.1.3 Data triage . . . 138
7.2 New visual features . . . 139
7.2.1 New image operations . . . 140
7.2.2 Multispectral imagery . . . 141
7.2.3 Lidar . . . 141
Reflection Intensity . . . 142
Application to Geology . . . 143
Data processing and normalization . . . 144
Combining data types . . . 144
Addition to the feature space . . . 145
7.3 New applications . . . 145
7.3.1 Dust cover estimation . . . 146
7.3.2 Geological photomicrographs . . . 147
7.3.3 Remote-sensing imagery . . . 149
7.4 Further developments . . . 151
7.4.1 New capabilities . . . 153
7.5 Advancing the cloud-tracking algorithm . . . 153
7.5.1 New capabilities . . . 155
Bibliography . . . 156
8 Conclusion 164
A Example labeled images 166
Curriculum Vitae 169
2.1 Contingency table for assessing segmentations . . . 28
3.1 Segmentation algorithm performance . . . 57
4.1 Simplified investigation sequence for exploring a geological environment . . . 77
5.1 Comparison of computed wind direction to values from human inspection . . . 98 5.2 Algorithm results for Phoenix supra-horizon images . . . 105
6.1 NavCam & REMS wind observations from MSL sols 1-360 . . . 116
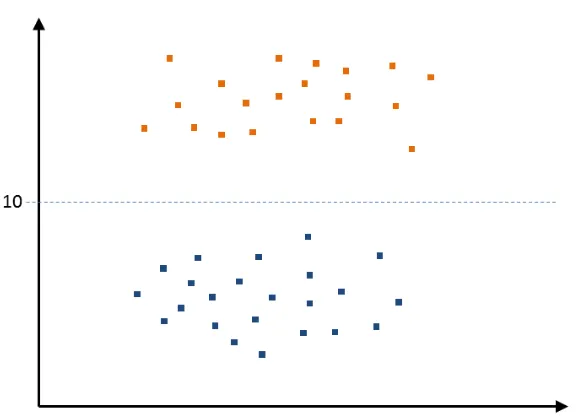
2.1 Illustration of a distance metric and discriminant surface . . . 22
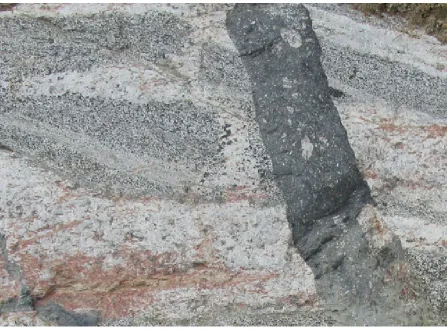
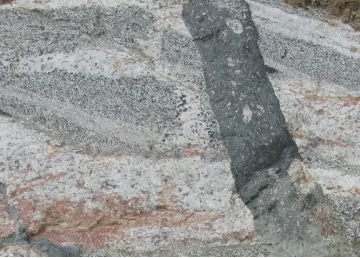
2.2 Rock outcrop showing visually distinct materials . . . 23
2.3 Illustration of finding an ideal vector basis . . . 25
2.4 Examples of processing an outcrop photo to create a feature space . . . 30
2.5 Sequence of cloud images showing evolution of features . . . 36
2.6 Illustration of template-target cross-correlation . . . 37
3.1 Example of scene type A: Basalt blocks and sand . . . 58
3.2 Example of scene type B: Massive basalt and lahar deposit . . . 59
3.3 Example of scene type C: Layered volcanic materials . . . 60
3.4 Photograph of complex geological scene, image number 0495 . . . 61
3.5 Segmentation map of image number 0495 . . . 61
3.6 Performance of MDA learning as compared to PCA . . . 63
3.7 Photograph of Sudbury impact breccia, image number 9735 . . . 64
3.8 Segmentation map of image number 9735, without the learning step applied . . 64
3.9 Segmentation map of image number 9735, with the learning step applied . . . . 64
3.10 MSL MastCam image of calcium sulfate veins in mudstone (image ref s133r1) . 66 3.11 Segmentation map of image s133r1 . . . 66
4.1 A progression of landed rover systems: Pathfinder, MER, MSL . . . 71
4.2 Examples of geological contacts and the spatial relationships they reveal . . . . 74
5.1 Example of cloud imagery sequence for terrestrial clouds . . . 95
5.2 Example of wind vector calculation for terrestrial clouds . . . 95
5.3 Example of cirroform clouds from the Canadian arctic . . . 96
5.4 Example of rapidly evolving broken cloud layer from the Canadian arctic . . . 97
5.5 Mean of correlation confidence scores for image pairs, as a function of time between image acquisitions . . . 99
5.6 Standard deviation of wind direction computed from image pairs, as a function of time between image acquisitions. . . 100
5.7 Standard deviation of wind direction values for the visually-ambiguous case of 9 July 2012 . . . 101
5.8 Mean wind direction values for the visually-ambiguous case . . . 102
5.9 Example of cloud imagery sequence from the Phoenix mission . . . 104
5.10 Example of wind vector calculation for Martian clouds . . . 104
5.11 Example of cloud imagery sequence for Martian airborne dust . . . 106
6.3 Plot of modeled wind azimuth with altitude for the MSL landing site . . . 119
6.4 Plots of meridional wind with altitude (km) over a north-south cross-section of Gale Crater, at four points during the Martian day corresponding to sol 310. The wind magnitude is given in m/s, and the local time is given in decimal hours, Local Mars True Solar Time. Significant variations of winds with al-titude are noticeable, with variation throughout the day. Data derived from a version of the MarsWRF model with nested scales focusing on Gale Crater. . . 120
7.1 Examples of targeting strategies for a segmented rock outcrop . . . 135
7.2 Example of a geological map informed by outcrop visits . . . 137
7.3 Illustration of event-driven activities for regional mapping . . . 138
7.4 Illustration of event-driven activities for data triage . . . 139
7.5 Example outcrop image and its HSV representation . . . 140
7.6 Lidar image of an outcrop . . . 143
7.7 Examples of dust-covered rocks on Mars . . . 146
7.8 Photomicrographs of a rock sample by various imaging modalities . . . 148
7.9 Photomicrograph of lunar gabbro showing distinct mineral grains . . . 149
7.10 Orbital image of dunes and craters on the surface of Mars . . . 150
A.1 Label example, scene type A . . . 166
A.2 Label example, scene type B . . . 167
A.3 Label example, scene type C . . . 167
A.4 Label example, scene type D . . . 167
A.5 Label example, scene type E . . . 168
A.6 Label example, scene type F . . . 168
AEGIS Autonomous Exploration for Gathering Increased Science
ANN artificial neural network
APXS Alpha Particle X-ray Spectrometer
ARI Adjusted Rand Index
CSA Canadian Space Agency
DRT Dust Removal Tool
ECMWF European Centre for Medium-Range Weather Forecasts
EM electromagnetic
ESA European Space Agency
EU European Union
EUMETSAT European Organisation for the Exploitation of Meteorological Satellites
FP5 Fifth Framework Programme
GCM general circulation model
GMS Geostationary Meteorological Satellite
GOES Geostationary Operational Environment Satellite
HiRISE High Resolution Imaging Science Experiment
HSV hue-saturation-value
IEEE Institute of Electrical and Electronics Engineers
IR infrared
i-SAIRAS International Symposium on Artificial Intelligence, Robotics and Automation in Space
ISPRS International Society for Photogrammetry and Remote Sensing
LDA Linear Discriminant Analysis
MAHLI Mars Hand Lens Imager
MDA Multiclass Discriminant Analysis
MDA* MacDonald, Dettwiler and Associates
MER Mars Exploration Rovers
MR8 Maximum Response 8 (filter bank)
MRO Mars Reconnaissance Orbiter
MSL Mars Science Laboratory
mSM Mobile Scene Modeler
MSSS Malin Space Science Systems
NASA National Aeronautics and Space Administration
NCA Neighbourhood Components Analysis
NESDIS National Environmental Satellite Data and Information Service
NMR nuclear magnetic resonance
NSERC Natural Sciences and Engineering Research Council of Canada
OASIS Onboard Autonomous Science Investigation System
OCPP Orbiter Cloud Photopolarimeter
PCA principal components analysis
PET positron emission tomography
RANSAC Random Sample Consensus
REMS Rover Environmental Monitoring Station
RGB red-green-blue
SIFT Scale-Invariant Feature Transform
SLAM simultaneous localization and mapping
SLR single lens reflex
SSI Surface Stereo Imager
TLS terrestrial laser scanner
TRL Technology Readiness Level
US ultrasound
UV ultraviolet
VIRTIS Visible and Infrared Thermal Imaging Spectrometer
WMO World Meteorological Organization
XRT x-ray tomography
Introduction, Context, and Motivation
The first decade of the twenty-first century has seen an unprecedented period of progress in
the robotic exploration of the solar system. At present, spacecraft missions are underway to
the Earth’s moon, all but the outermost planets, and several minor bodies across all regions
of the system. The missions have produced tremendous amounts of data from the instruments
they carry, allowing new discoveries that have greatly affected our understanding of the Earth’s
neighbourhood. This large data volume presents challenges for mission scientists and
engi-neers, however, as radio links over interplanetary distances limit the rate at which the data can
be returned to Earth. In fact, the bottleneck of the communications system is a key driver for the
entire mission architecture used in planetary missions, from the selection of instruments and
design of spacecraft subsystems to the scheduling of observations and the choice of landing
sites and targets of investigation.
Even after the data is delivered to Earth, significant challenges remain in making the best
use of it. A single mission can gather data for many years, and several missions to the same
or similar target bodies can produce great volumes of data that are difficult to analyze as a
whole. Significant effort is needed, and not always available, to thoroughly investigate
incom-ing data, and new discoveries are often found by reviewincom-ing old data and comparincom-ing it with
newer acquisitions.
New data processing techniques can present a way of addressing both problems – data
re-duction aboard the spacecraft and interpretation on Earth. For data from imaging systems, this
can take the form of autonomous image-processing techniques, which allow computer systems
to autonomously identify features of interest in images. A great variety of such techniques have
been developed to address specific problems in terrestrial applications, but the application of
autonomous image-processing to the types of problems found in planetary exploration remains
very new, with a great many potential uses.
The present work develops new approaches to autonomous robotic science in the context
of planetary exploration. It begins by assessing current challenges in planetary science to find
promising areas for science autonomy focused on image processing. It then addresses specific
problems of image processing of natural scenes in geology and atmospheric science,
produc-ing new techniques to automatically extract semantically-useful data from photographs. These
techniques are tested on imagery of representative scenes from a variety of relevant terrestrial
analogue settings, as well as on data from surface missions to the planet Mars. Finally,
scenar-ios are presented to incoporate these new tools into autonomous robotic science operations in
planetary missions, respecting the typical constraints of mission design and operation, and the
practice and goals of robotic field science as practiced in surface missions.
1.1
Context: Planetary exploration
1.1.1
Planetary science
Speculation about the nature of other worlds has been common since antiquity [1], but only
since the invention of the telescope could these discussions be informed by observational data
[2]. Continued advancement in imaging techniques has allowed new insights into the nature
of the planets, often with revolutionary implications for our understanding of the Earth and its
place in the universe. Knowledge gained from the use of ground-based telescopes has been
expanded as spacecraft took images from progressively closer vantage points, first flying by,
then orbiting, then landing on other worlds.
bodies which inhabit the solar system are now known to have formed from a common
proto-solar nebula [3]. During their formation and evolution, common processes affected them all,
bringing each to the state in which we find it today. The modern, interdisciplinary practice of
planetary science is to consider each of these bodies as discrete examples from a continuous
spectrum of variation in the way planets can form, given the materials from which they are
derived, their size, their position relative to the parent star, and other key variables. The recent
discovery of large numbers of exoplanets has helped to solidify this view, and to shed light on
the space of variation for the planet-forming process [4].
In modern planetary science, then, processes which are common to several planetary bodies
can be best studied by comparison of examples across locales. Impact cratering, for example,
long thought to be absent or nearly so on Earth, is now seen as a dominant process on the
surface of planetary bodies having a solid surface [5]. Models of impact crater formation are
now discussed in the context of examples from all the terrestrial planets, as well as satellites
and minor bodies throughout the solar system. Impact craters on Earth are used as test cases
for the models, and as ground truth for the assumptions on which they are based, being much
more accessible than craters on other bodies. Terrestrial craters are also used as analogues for
the geology and terrain to be found on the Earth’s moon, on Mars, or on other worlds, given
the prevalence of craters as a landform on those bodies. Studies of atmospheres, volcanism,
erosional processes, and planetary interiors are all conducted in this powerful context of each
planet as a particular case of a general phenomenon.
Working in that context requires the use of datasets from the planetary bodies to be
ex-plored, all obtained by instruments aboard spacecraft sent to explore the solar system. A great
many techniques are now available, using magnetism, radar, laser altimetry, studies of the
vari-ations in radio signals from spacecraft, and more, but imaging in the visible and adjacent bands
remains a key technique. Landforms are identified and interpreted from orbital imagery, and
regional and global maps are built up [6]. Images from landed platforms stand in for the eyes of
The practice over many years has been for images to be sent to Earth for study, and based on
the interpretations of these images by geologists, for further imagery to be taken of particular
targets, in a process which becomes cyclical.
These images, primarily visible-wavelength photographs, are the key tools for navigation
of mobile assets on planetary surfaces. Rovers are guided towards targets of interest identified
by scientific interpretation of received imagery. Safe routes towards the targets, obstacles,
and dangerous terrain are identified by an engineering analysis. This again requires a cyclical
process in which images are captured and sent to Earth for interpretation, then decisions based
on their interpretation are formulated into commands for rover motion and new imaging. The
operational and scientific use of the imagery happen side by side, and are dependent on each
other, forming a fundamental working process of planetary mission operations.
1.2
The challenge of communications
Data from spacecraft throughout the solar system is sent back to Earth by a remote
commu-nications link, with radio-frequency links still the best available. These spacecraft operate at
great distances from their ground stations – even the closest planets are tens of millions of
kilo-metres away from the Earth. This, along with the limited size of antennas and power available
for transmission, and other operational restrictions, limits the rate at which data can be sent
over the communications links.
This data limitation is a key restriction on the capabilities of a planetary mission, and drives
the design of the mission architecture, the operations planning, and the selection of instruments.
Instrumentation and experiments which produce high volumes of data compete for the limited
data budget, and may not be worth including if they can be used only infrequently. Very high
resolution imagery is often very desirable for the level of detail visible in observed features, but
when digital images are large, fewer of them can be transmitted. Data-heavy operations may
and reducing the versatility of the overall spacecraft system. And the need for a fraction of the
data to directly support engineering and planning needs means that the budget for science data
is even further constrained.
In many cases a mission could be much more capable if its communications limits could
be relaxed – if the instrument data products were smaller, the data budget larger, or the amount
of data needed to answer a question or make a discovery lower. Reducing the number of
observations to fit the data budget decreases the effective scope of the mission. But a second
problem also throttles the rate at which the mission can work. This is the need to send imagery
to Earth for intepretation.
Regardless of scale or type, the features captured in planetary imagery must be interpreted
by human operators, all of whom, at present, work on Earth. This step requires:
• the transmission of the data to Earth,
• dissemination of data to the science team,
• time for interpretation of the imagery and comparison with other data,
• decision-making with respect to next steps for the mission, given the new data, and
• preparation of the next cycle’s commands and their upload to the spacecraft
The interpretation of the data and the steps taken to enable it take time, and introduce
a necessary cadence of data-intepretation and command cycles into the mission operations.
Since the spacecraft often cannot continue work until new commands are sent to it on each
cycle, the time taken for data interpretation on Earth limits the rate at which mission objectives
can be carried out. Faster interpretation of data, or a reduced need to have humans perform the
1.3
Addressing the problem: autonomous science
To address the challenges of transmitting and interpreting planetary imagery, a possible strategy
is to improve the ability of computer systems to autonomously interpret image data. Increased
autonomy of instruments could mean that short statements of the interpretation could be sent
to Earth instead of large sets of images, at a reduced data cost, freeing up space in the data
budget for other observations. Overall, more scientific work could be accomplished for the
same data budget, even if fewer images are returned to Earth. Initial progress has already been
made in this area, with the Mars Exploration Rovers (MER) able to select rocks of scientific
interest based on albedo [7] and automatic detection of certain transient surface events aboard
the Earth Observing One satellite [8].
Even for image sets sent for human analysis, automated or computer-aided interpretation
could speed the work of science teams, guiding them to key features or unexpected
observa-tions. In some cases the gain will be in reliability – humans will make mistakes and oversights,
but the computer can provide a redundant mode of image inspection, possibly seeing things that
humans overlook. In other cases the gain will be from efficiency – the time spent interpreting a
large series of images can be used for other work if the interpretation can be reliably performed
by computer. Even if the computer can provide a first-order interpretation, selecting key
tar-gets or classifying features before they are presented to scientists, significant savings may be
possible. Finally, gains may be found in the correlation of data from long data series, or across
data series in the comparison of data from multiple sensors. Autonomous image processing
could prove a very valuable tool for spacecraft science teams, even if it is used on Earth, rather
than aboard the spacecraft.
1.4
Research problem
The autonomous interpretation of planetary image scenes represents a broad class of image
iden-tifying features of interest in natural scenes of planetary surfaces and atmospheres at a range
of scales. They have the common motivation of enhancing the performance of planetary
ex-ploration missions by reducing the data volumes needed for specific observations, and the task
load of scientists analyzing and interpreting data. They have a common target user and
prin-cipal beneficiary: the planetary scientist, whose work of analyzing data of many types and
sources would benefit from more powerful analytical tools.
Within this set of problems, a variety of specific tasks exist, each best suited to
particu-lar image-processing algorithms and techniques. In all cases, however, the common goal of
improving autonomous robotic science leads to a consistent approach. The image-processing
technique developed must automate a task of image interpretation which currently requires a
ground-in-the-loop control cycle for planetary missions. To be useful, it must solve a genuine
problem of extracting useful information from images of natural scenes, representative of the
kinds of scenes to be interpreted in real mission settings. To be of practical value to future
science missions, it must moreover address this problem in a way that produces meaningful
science information relevant to the stepwise processes used to understand and explore a region
of a planet’s surface.
For missions operating on planetary surfaces, two broad domains of such problems present
themselves: studies of the planet’s surface, and studies of its atmosphere. For surface
investi-gations, geology is a prime focus, with an essential task being the recognition, classification,
and mapping of different types of surface materials. This information underpins every
higher-level interpretation of the nature and history of a geological setting, and guides geochemical
and mineralogical studies using non-photographic instruments. For the atmosphere, a main
image-interpretation task is the detection and tracking of transient visible features, such as
clouds, whose form and motion reveal much about the physical conditions and dynamics of the
atmosphere.
The present work addresses problems representative of the kinds of computer vision tasks
automatically segment photographs of rock outcrops by rock type, with numerous potential
applications to mapping, guiding autonomous instrument targeting, target selection, and data
triage. For atmospheric science, a new technique is developed to track clouds in sequences
of photographs of the sky, with application to studies of winds aloft and the dynamics of the
atmosphere far above sensors on the planetary surface.
1.4.1
Segmentation of images of rock outcrops by geological unit
Visible-wavelength cameras are universally included on landed platforms, as they provide a
wealth of information readily understood to humans viewing their imagery. They are also a
standard tool of field geologists, who use them to record their observations for later analysis
and review. A wealth of images of geological scenes exists both for sites on Earth and other
planets.
A key task for human geologists studying rock outcrops (in photographs, or in person) is
to recognize the boundaries between different and adjacent types of rock. Detecting the spatial
distribution of such variations in material is the first step towards understanding the spatial
relationships between different materials, and identifying the materials themselves — and thus
to all of the study and interpretation undertaken of a geological setting.
The potential scientific value of autonomous geological classification is considerable. As
an example application, impact craters are a dominant geological process on all planetary
bod-ies with solid surfaces [9]. Identifying the position and relationships between emplacements
of impact-generated materials is a central task of understanding the formation and nature of an
impact crater [5]. Discovering and interpreting these relationships requires the identification
and classification of the geological units which can be seen, for example as impact melt rocks
(derived from material melted and re-solidified during the impact), impact breccias (formed
by fragmentation, mixing, and re-lithification of rocky materials during the impact), and target
rocks (the original materials present at the site prior to the impact event) [10]. An
interpreting the arrangements of these materials – which occur together and separately, which
types overlie others, and such.
But more generally, such techniques of identifying rock types within a scene
(‘geologi-cal units’) and the relationships between them, is a core technique of geologi(‘geologi-cal exploration
[11]. The techniques used for classification and segmentation of geological scenes would likely
see application, adapted for each case, to a great variety of environments both on Earth and
throughout the solar system. An autonomous geological classifier, even one which works only
for specific rock types or specific environments, would be a very valuable tool for increasing
the autonomy, scientific return, and scientific discovery rate of planetary exploraton missions.
The current state of literature with respect to automated image interpretation for geology,
science autonomy in planetry exploration, and relevant image-processing and data analysis
techniques is given in section 2.2 and its subsections.
1.4.2
Cloud-tracking for winds-aloft studies on Mars
The goal of this investigation is to demonstrate autonomous estimation of the wind direction
using images of the Martian atmosphere taken from a landed platform. The task requires an
image-processing algorithm working on a series of images of the same part of the Martian sky
taken over a short period of time. The algorithm would identify clouds, track them as they
move in the camera’s field of view over the course of the image series, and, with knowledge of
the camera pointing and relevant geometry, determine the wind direction.
Such an algorithm would reduce a large set of image data to a single short string of digits
describing the wind direction, at significant data savings should it later be implemented on a
spacecraft. For Earthbound use, it would greatly improve the speed at which cloud-based wind
studies could be conducted, allowing the study of large, long-term datasets quickly. A study of
such image sets allows investigation of wind at altitude on any planetary surface mission where
a suitable camera is present (rather than requiring specialized atmospheric sounding systems
both on future missions, and using archived data. A consequence of such studies would be a
source of new, previously unavailable reference data for ground-truthing (so to speak) numeric
circulation models of the Martian atmosphere.
Such a tool would allow a greater understanding the wind patterns in the condensing (i.e.,
cloud-forming) layers of Mars’ atmosphere both diurnally and over the course of years, an
analysis which would be very difficult and labour-intensive to do manually. This investigation
has implications for heat, mass, and water transport in the Martian atmosphere, and thus for
planetary climate modeling. The wind patterns also have implications for the transportation
and preservation of fine geological materials – clay, dust, sand, and others – that can include
biomarkers, the evidence for past biological activity. Unknown behaviour of wind in the
Mar-tian atmosphere is also a major source of uncertainty for spacecraft entering and descending
through the atmosphere to land, and the models used in designing these systems would benefit
from a greater understanding of the atmosphere’s behaviour.
The history and current state of research of cloud-tracking in computer vision and in
plane-tary science, along with relevant image processing techniques, are described in section 2.3 and
its subsections.
1.5
Research contributions
The work described in the subsequent chapters details several related research contributions.
In particular, these include:
• A novel technique for processing a photograph of a geological scene to generate a
fea-ture space of visual characteristics which contains information relevant to the task of
discriminating between types of rock.
• A new technique for autonomous segmentation of geological images using only colour
photographs, by searching for regions which are internally visually similar, while being
a number of visually-challenging geological scenes of relevance to planetary exploration.
These include images from several planetary analogue sites on Earth, and high-value
science investigation sites visited by the Mars Science Laboratory (MSL) mission on
Mars.
• A strategy for employing autonomous geological image segmentation to enable greater
science autonomy in robotic planetary surface missions, including a formalization of
the process of robotic geological exploration compatible with the practices of both field
geology and planetary robotics. The elaborated scenarios include several scales of
imple-mentation for a variety of tasks, encompassing the space of instrument suites and science
investigations foreseen for planetary missions over the coming decade and beyond.
• A novel technique for autonomously processing sequences of images of clouds as viewed
from below, to compute the wind vector at the cloud altitude by application of image
cross-correlation. This technique has been demonstrated successfully on images of a
variety of cloud morphologies from Earth and the Mars Phoenix mission, and is now in
routine use to support data processing from the MSL mission.
• The first comparative analysis of winds observed at the surface and aloft, at equatorial
latitudes on the planet Mars, using data from the MSL mission.
• A strategy for onboard autonomy to conduct monitoring on Mars of a previously
unavail-able meteorological variunavail-able — the condensation-level winds — at efficient data cost, by
using automated image analysis. This includes an assessment of the requirements for
such a system, and the decision case for implementing it.
In addition, the techniques developed during the research program leading to the above
con-tributions were also used to enable additional research not presented in this document. These
include, especially, contributions to the evaluation and field testing of a system of geological
surface classification [12], and the development of a novel architecture for mission science
Bibliography
[1] T. Lucretius,De rerum natura (On the Nature of Things), 58BC, circa 58 BCE. [Online]. Available: http://classics.mit.edu/Carus/nature things.html
[2] G. Galilei, Sidereus Nuncius (Starry Messenger), 1610. [On-line]. Available: http://lhldigital.lindahall.org/cdm4/document.php?CISOROOT=
/astro early&CISOPTR=68&REC=9
[3] M. M. Woolfson, The Origin and Evolution of the Solar System. The Institute of Physics Publishing, 2000. [Online]. Available: http://books.google.ca/books?id= KantSzMGPSkC
[4] R. P. Butler, J. T. Wright, G. W. Marcy, D. A. Fischer, S. S. Vogt, C. G. Tinney, H. R. A. Jones, B. D. Carter, J. A. Johnson, C. McCarthy, and A. J. Penny, “Catalog of nearby exoplanets,” The Astrophysical Journal, vol. 646, no. 1, pp. 505 – 522, 20 July 2006. [Online]. Available: http://iopscience.iop.org/0004-637X/646/1/505
[5] G. R. Osinski and E. Pierazzo, Eds.,Impact Cratering: Processes and Products, 1st ed. Wiley-Blackwell, December 2012, ISBN: 978-1-4051-9829-5.
[6] R. Greely, Introduction to Planetary Geomorphology. Cambridge University Press, 2013. [Online]. Available: http://books.google.ca/books?id=fZwNNP-IzicC
[7] T. Estlin, B. Bornstein, D. Gaines, D. R. Thompson, R. Casta˜no, R. C. Anderson, C. de Granville, M. Burl, M. Judd, and S. Chien, “AEGIS automated targeting for the MER opportunity rover,” in Proceedings of the 10th International Symposium on Artificial Intelligence, Robotics and Automation in Space (i-SAIRAS 2010), Sapporo, Japan, 29 August - 1 September 2010, 2010. [Online]. Available: http://aegis.jpl.nasa.gov/publications/
[8] S. Chien, R. Sherwood, D. Tran, B. Cichy, G. Rabideau, R. Casta˜no, A. Davis, D. Mandl, S. Frye, B. Trout, S. Shulman, and D. Boyer, “Using autonomy flight software to improve science return on Earth Observing One,” Journal of Aerospace Computing, Information, and Communication, vol. 2, pp. 196 – 216, April 2005. [Online]. Available: http://www-aig.jpl.nasa.gov/public/papers/chien JACIC2005 UsingAutonomy.pdf
[9] B. M. French, Traces of Catastrophe: A Handbook of Shock-Metamorphic Effects in Terrestrial Meteorite Impact Structures. Houston: Lunar and Planetary Institute, 1998, lPI Contribution No. 954.
[10] R. A. F. Grieve and A. M. Therriault, Impactites: Their Characteristics and Spatial Distribution. John Wiley & Sons, 2013, ch. 7. [Online]. Available: http://books.google.ca/books?id=PsrtMhr-1gsC
[12] D. L. Bekker, D. R. Thompson, W. J. Abbey, N. A. Cabrol, R. Francis, K. S. Manatt, K. F. Ortega, and K. L. Wagstaff, “A field demonstration of a smart instrument performing autonomous classification of geologic surfaces,” Astrobiology, vol. 14, no. 6, pp. 486–501, June 2014. [Online]. Available: http://online.liebertpub.com/doi/abs/10.1089/ast.2014.1172
[13] J. Moores, R. Francis, M. Mader, G. Osinski, T. Barfoot, N. Barry, G. Basic, M. Battler, M. Beauchamp, S. Blain, M. Bondy, R. Capitan, A. Chanou, E. Clayton, J. and; Cloutis, M. Daly, C. Dickinson, H. Dong, R. Flemming, P. Furgale, J. Gammel, N. Ghafoor, M. Hussein, R. Grieve, H. Henry, P. Jasiobedzki, A. Lambert, K. Leung, C. Marion, E. McCullough, C. McManus, C. Neish, H. Ng, A. Ozaruk, A. Pickersgill, L. Preston, D. Redman, H. Sapers, B. Shankar, A. Singleton, K. Souders, B. Stenning, P. Stooke, and P. Sylvester, “A mission control architecture for robotic lunar sample return as field tested in an analogue deployment to the Sudbury impact structure,” Advances in Space Research, vol. 50, no. 12, pp. 1666 – 1686, 15 December 2012. [Online]. Available: http://www.sciencedirect.com/science/article/pii/S0273117712003183
Literature Review and Background
2.1
Image processing for classification
The task of image segmentation and classification is a classic problem of machine vision.
Numerous basic image characteristics can be used to discriminate between regions in an image.
Colour, intensity, and the numerical derivatives thereof can be assumed to correlate to the
presence of particular objects, materials, or features. Edge-detectors and contour techniques
can exploit these characteristics to find boundaries, with suitable assumptions and parameters.
More advanced mathematical techniques – Gabor filters, wavelet and Fourier transforms, or
component analyses, for example – can be applied in an effort to extract less
immediately-apparent information from the pixels. These are particularly useful where experience or an
understanding of the mechanisms underlying the formation of the viewed scene give an insight
into their relation to the appearance of the objects viewed. This often applies to visual texture,
where the statistical patterns of image pixels can have, at once, a mathematical distinctness, a
correlation to a real object or feature, and a distinct visual appearance, for given image regions.
2.1.1
Natural scenes
Natural scenes present a particular challenge for segmentation. Such scenes are often complex,
with many types of textures in a single scene, and texture regions having irregular,
poorly-defined, or gradational boundaries. There are often complex relationships between the basic
image characteristics for given regions, and signifiant variation in the properties of a given
object or feature can exist. Multiple signals can overlay each other, and noise or unrelated
processes can overlay or partially obscure the features of interest.
Such is the case in geology. Rocks are often very complex in appearance, and a field
geologist requires a great deal of training and experience to be able to identify rocks visually
[1]. Even then, full classification of rocks must often wait for detailed microscopic or chemical
investigation, due to the fine scale of key features, or ambiguity due to the similar appearance
of different rock types under varying conditions, such as weathering. Basic heuristics and
selective inspection techniques are taught to new geologists in field courses, where students
see rocks of various types in their natural settings, and learn to discriminate between them
and map their extent and relationships [2]. Such knowledge is gained alongside theoretical
courses in the chemistry and physics that drive the formation, morphology, and appearance of
rocks. The two can be correlated, to an extent, and an analytical understanding of the expected
appearance of geological materials can help in their classification, but the visual mechanics
are not always conscious. Much depends on the experience, keen eye, and familiarity of the
geologist with the materials at hand.
2.1.2
Complex and variable natural scenes: the example of medical
imaging
Heuristics and the familiarity of experts had long been the basis for interpreting medical
im-ages as well. These, like planetary imim-ages, display complex natural scenes, prone to noise,
acquisition limitations, and significant variability in the appearance of features. Unlike for
planetary imagery, much work has been done in the field of automated processing of medical
images, driven by the much wider use of medical imaging, the significant costs associated with
assigning physicians and radiologists to visually interpret images, and the potential for
hu-man error. Decades of research have led to very succesful automated interpretation algorithms
boundaries between regions, and other challenges to automated interpretation. Planetary scenes
have been much less studied for the purposes of automated interpretation, but their
interpreta-tion faces many of the same difficulties, and techniques which have shown success in medical
imaging may well provide guidance to the interpretation of geological and atmospheric scenes.
Medical images concern the interior of the human body, which presents a complex
collec-tion of tissues having variable appearance and irregular boundaries. Regardless of the
modal-ity used – x-ray tomography (XRT), nuclear magnetic resonance (NMR), positron emission
tomography (PET), or other – the problem is usually one of segmentation and classification,
with the goal of identifying tissues to find tumours, inflammation, or tissue features
indicat-ing trauma or disease. Such an effort represents the segmentation and classification of natural
scenes having a highly complex and variable appearance and very large parameter space [3].
As in imagery of geological scenes, medical images are also affected by variations in
acqui-sition, leading to differences in speckle, contrast, brightness, and missing boundaries [4]. In
geological imagery, similar difficulties are presented by changes in lighting, weathering and
dust covering on rocks, vegetation (on Earth), and instrument differences.
Meeting or mitigating these challenges to achieve useful automated image processing is
a difficult task. In the medical field, ultrasound (US) is a particularly challenging modality,
due to the high incidence of speckle, poor signal-to-noise ratio, low contrast resolution, and
frequent discontinuity of boundaries [5]. Patient motion during imaging adds to the difficulty
in localizing boundaries [6], and is nearly inevitable in imaging of cardiac, pulmonary, and
other tissues. Such challenges have made direct analytical image analysis techniques difficult,
and led to the use of statistical and pattern-recognition techniques in US image processing, of
which [7] give a comprehensive review.
The challenges are similar to those for planetary scenes, where contrast and noise are
lim-ited by lighting conditions that cannot be controlled, and where boundaries can be obscured for
a variety of reasons. Contacts – the boundaries between geological units – are often gradational,
– fragmentation, mixing, and re-lithification of materials – leading to fragmentary and broken
boundaries between rock types, while the edges of pre-existing geological units can be
mod-ified by the heat and pressure of new molten materials solidifying adjacent to them. Surface
weathering, the overlay of dust, and erosion of the rock surface contribute to the noise in the
image – such effects reduce the strength of the visual signal corresponsing to the rock itself,
mixing it with other components. Atmospheric imaging faces similar problems, particularly in
the dusty atmosphere of Mars, where the dust contributes to obscuration and effective noise,
and where the clouds are of poorly-predictable, inconsistent, and dynamic morphology. Here,
segmentation of individual clouds from the dust and the background sky, and classification
of cloud types, will face similar challenges of noise, contrast, variability of appearance, and
boundary ambiguity in geological and US imagery.
A great variety of techniques have been used for segmenting US images. Artificial
neu-ral networks (ANN) are very common, performing well at segmenting images of a variety of
tissues, including in the heart [8], prostate [9], bloodstream [10], brain stem [11], liver [12]
and elsewhere. Techniques using shape, physical, and other priors have also met with success,
and may in some cases have analogies in geology. Knowledge about the expected clast shape
in sedimentary rocks or breccias, or about the orientation of sedimentary beds, for example,
could be used as prior information to inform a classification algorithm dealing with these kinds
of materials. Similarly, models of cloud type and convective dynamics inform classification
algorithms for atmospheric features. Energy-minimization methods are also used in US image
analysis, as are Bayesian, level set, and active contour techniques, with [7] giving a
compre-hensive overview of the application of each.
Given the difficulties in managing the complex feature space of geological scenes, and the
difficulty in reverse-engineering the visual heuristics of an experienced field geologist, such
techniques may find similar utility in geological image interpretation as well, or, indeed, in
2.2
Geological classification
Field geologists have traditionally used classical tools of exploration, such as the map,
com-pass, hammer, and measuring tools [13]. Photographs are often taken of features of interest,
and other imaging modalities such as lidar have come to be used in recent years [14], but such
images are generally used as records, for reporting and later review. Attempts at providing
automated interpretation of geological scenes have largely been driven by work in remote
en-vironments, including meteorite searches in Antarctica [15], and surface exploration of Mars
[16]. For conventional geologists, image interpretation appears, to date, to remain largely the
work of humans; one modern textbook on visual interpretation of geological scenes makes no
mention of automated techniques [17]. The section that follows describes the current state
of work in obtaining geological information autonomously by processing of photographic
im-agery.
2.2.1
Image-processing for geology
Geologists on Earth make use of direct visual inspection of rock features to interpret and
un-derstand the geology of a site. On Mars, or elsewhere in the solar system, this has not been
possible, and all investigations are at present carried out with imagery and instrument data
returned by robotic probes. In recent years, the data-collecting ability of these probes has
increased, while data delivery to Earth remains restricted by the limitations of radio
com-munication across interplanetary distances. This has led to research in onboard science data
interpretation for both orbiting and surface probes, and relatedly, in techniques for autonomous
decision-making and planning by the spacecraft in response to these interpretations.
As early as 1999, terrestrial analogue work included tests of on-board geological analysis.
The Marsokhod deployment of that year [18] included tests of image-processing algorithms to
detect rocks strewn on the ground surface, to find the horizon, and to detect layered structures
data acquired during the field test.
The rock detector in that test used the known position of the sun to derive expected
posi-tions of rocks by searching for shadows in images. It also had some difficulty, but was followed
in subsequent years by other efforts with similar goals, though often different approaches.
Casta˜noet al.[20], for example, developed a system using edge-detection in grayscale images.
A system by Viola and Jones [21] used image integration and a cascade of different
classifica-tion techniques applied to successively smaller and more confidently-selected image regions.
Gor et al. [22] used pixel brightness and stereo range information. Thompson and Casta˜no
[23] carried out a performance comparison of seven such systems, reporting on the merits of
each. No detector was able to find more than 60% of the rocks in the test images, and the
authors suggested that further research, or an alternate approach using non-visual sensors or
sensor fusion, might give better results.
Nonetheless work has continued in using rock-detection systems to inform on-board
decision-making. The Onboard Autonomous Science Investigation System (OASIS) algorithm,
devel-oped at NASA’s Jet Propulsion Laboratory, used rock-detection and characterization to
pri-oritize imagery for transmission [24], and led to the Autonomous Exploration for Gathering
Increased Science (AEGIS) system used on the MER Opportunity rover [25], which is able to
flag rocks for rover instrument work based on albedo. The OASIS system was further refined
to use a broader set of classfication criteria [26]. Later work used the results of a rock-detection
system to choose targets for an infrared spectrometer [27]. Other researchers have made similar
efforts, using rock characteristics to asses the merit of a target and re-plan a traverse [28].
Prioritization of targets for imagery or instrument targeting is greatly aided by identification
of the target material. Work in parallel with the rock-detection efforts has investigated rock
classification. This has largely been limited to the case of loose rocks sitting on the ground
surface, and has used a variety classification parameters including shape, colour, albedo and
other image-derived features, as well as infrared spectrometry (e.g. [29], [30], [31]). A further
classification of the rocks over the course of a traverse, in an effort to find boundaries between
geological units [32].
Other work has attempted to apply visual geological classification to soils and
unconsoli-dated material on the surface, such as gravel, sand, and other loose materials. Visual texture
analysis has been applied to this problem [33], and recent efforts saw an attempt at reducing
the computational power required [34].
Current work aims to use texture-based classification on solid material to identify
partic-ular biogenic structures for astrobiology survey [35], an approach which has shown promise
in classifying surfaces using a machine-learning technique ([36],[37]). Many other types of
material can in principle be studied using similar approaches.
In light of the difficulties in obtaining information from imagery in order to prioritize
im-ages, at least one effort examined a content-independent metric, correlating compressed image
size to scientific merit as ranked by geologists [38].
2.2.2
Machine learning
The challenges of interpreting geological imagery — complex and varied appearance, a
diver-sity of visual cues, complicating noise components, gradational boundaries, and visual
sim-ilarity between different materials — mean that producing a direct, analytical algorithm to
discriminate between rock types is very challenging. Unlike elementary computer vision tasks,
a simple thresholding or differencing operation cannot, in general, allow a useful segmentation
into rock types. Even in such elementary cases, prior knowledge of the scene is necessary, for
example to allow a value of the threshhold to be chosen. But for geological imagery, the visual
complexities mean that the discriminant values of visual features are difficult to know – for
example, which colours are useful to tell one rock from another, or which albedo differences
indicate lithological differences, and not just internal variation within a rock type? In fact,
given the diversity of rocks and of their appearances, the space of such features is very large.
features is challenging.
Nonetheless, human geologists use visual cues to detect differences between rock types.
While reproducing the visual cues they use by direct analytical programming is difficult, the
feature choice, and discriminant values, might be discoverable. In similar cases in medical
imaging, machine learning approaches have proven fruitful in discovering useful information
in high-dimensionality spaces of visual features (see section 2.1.2 above). Current work on
geological imaging has also begun to explore this class of techniques [37].
Machine learning represents a class of optimization techniques in which performance is
improved by consideration of knowledge gained by experience in operation [39]. In general,
these techniques seek to discover a suitable criterion for decision-making based on the outcome
of past decisions. A broad range of approaches has been developed, often driven by the variety
of applications to which they have been applied. Image interpretation is among the domains
where this class of techniques have been applied, with a great vareity of approaches, generally
driven by specific image interpretation problems [40]. These include, for example,
classifi-cation (pixel-wise or of whole scenes), segmentation, object recognition, event detection, and
novelty detection.
Two broad categories of learning approaches exist [41]. Insupervised learning, the learning
algorithm is provided with information about the particular classes into which the data is to
to be divided. In image processing, this can take the form of labeled pixel data, where the
user provides a set of training data augmented with descriptions of which class each pixel
shouldbe assigned. In contrast,unsupervised learningaims to discover structure in data, such
as class distinctions, without the guidance of labeled data. These approaches often rely on
discovering statistical groupings and correlations within the data, and clustering groups of data
points within ann-dimensionalfeature spacecomposed of thentypes of quantifiable attributes,