ABSTRACT
SANIGA, KRISTEN NOELLE. A Case Study Of Factors Impacting Food Safety Training Effectiveness In Dairy Processing. (Under the direction of Dr. Clint Stevenson).
Internal food safety training is often performed by food production companies to fulfill requirements of regulatory agencies or private industry. There are a variety of food safety training methods, yet little research has been performed to determine which methods are most effective. There is also not a complete understanding of how food safety culture affects food safety training outcomes. The purpose of this study was to evaluate the effect of learning theories, training format, and food safety culture on changes in food safety
knowledge, intentions, and compliance
Individualized and group trainings were developed using behaviorism and constructivism learning theories on four food safety topics: Introduction to Good Manufacturing Practices and Material Controls, Personal Hygiene and Communicable Diseases, Allergen Control, and Food Defense. The training programs were implemented at 66 dairy processing plants. Pre and post-training evaluations were received from 793 employees at 22 dairy plants using a validated evaluation method. Data was collected in the form of pre- and post- training supervisor audits and employee surveys. Employees surveys contained questions to evaluate the food safety culture of the corresponding processing plant and questions to measure employees’ attitudes, perceived norms, personal agency, intentions, and knowledge related to the corresponding training topic.
employee food safety knowledge. This study did not find a change in non-compliance associated with receiving training, however that could be due to the fact that non-compliances were self-reported by the company and not recorded by a third party.
Regressions also revealed that knowledge was a significant positive predictor of compliance, whereas intention was not.
A Case Study Of Factors Impacting Food Safety Training Effectiveness On Dairy Processing Employees
by
Kristen Noelle Saniga
A thesis submitted to the Graduate Faculty of North Carolina State University
in partial fulfillment of the requirements for the degree of
Master of Science
Food Science
Raleigh, North Carolina 2018
APPROVED BY:
_______________________________ _______________________________
Dr. Clint Stevenson Dr. Benjamin Chapman
DEDICATION
To my parents, John and Denise Saniga, and my grandparents, Ken and Karen Marks.
BIOGRAPHY
Kristen Saniga is the daughter of John and Denise Saniga. She spent her early childhood growing up on the eastern coast of Virginia with her parents and her older brother. In 2006, she moved to North Carolina with her parents where she gained an appreciation for “real” barbecue.
Growing up, Kristen spent much of her free time playing field hockey, cooking with family, and camping. In addition to learning about food science, she currently enjoys kayaking, napping in her eno hammock, cooking, and cross-stitching.
Kristen completed her Bachelors of Science in Food Science with a Minor in
ACKNOWLEDGMENTS
First and foremost, I would like to thank my advisor, Dr. Clint Stevenson, for his guidance and support over the past four years. He let me join his team as an undergraduate and has challenged me ever since then to become a better scientist. I would also like to thank my committee members, Dr. Ben Chapman, Dr. Keith Harris, and Dr. Anne McLaughlin for their guidance, suggestions, and expertise over the course of this project. I would also like to thank Bethanne Tobey, the instructional designer that helped build the training tools used in this project for her help and general life advice. I would also like to thank the undergraduate students (Alec, Alee, Michael, Christin, Monica, and Haley) who spent countless hours helping my input the survey data into Qualtrics.
I would like to give a huge thank you to all of my friends that have supported me over the past two years by making me laugh, letting me stress-rant, encouraging me when I felt
overwhelmed, and feeding me when I forgot to feed myself. Thank you for putting up with my quirkiness, my random food science facts, and mini-lectures on food safety. I would especially like to thank my “food science friends” that I’ve made within the walls of Schaub Hall. Thank you for being a community that supported me and giving me a second home.
I would also like to thank all of the items, activities, and fictional characters that gave me an outlet for stress or helped keep me functioning and sane over the past two years: Raleigh coffee shops, mug cakes, The Office, Parks and Recreation, group fitness classes, Spotify,
kayaking, Jimmy John’s, and George R.R. Martin. I would also like to thank Amy Poehler/Leslie Knope for being a continuous source of inspiration and motivation.
TABLE OF CONTENTS
LIST OF TABLES………. viii
LIST OF FIGURES………... xii
CHAPTER ONE- The Current View of Food Safety Training and Food Safety Culture: A Review of Selected Literature……… 1
Introduction……… 1
Methods………. 2
Results……… 3
Discussion………..……… 7
CHAPTER TWO- The Effects of Food Safety Trainings on Employee’s Food Safety Knowledge, Intentions, and Behaviors: Comparing Learning Theories……… 11
Introduction……… 11
Methods……….… 13
Results……… 19
Discussion………..……… 24
Conclusion……….……… 27
References………..………… 83
CHAPTER THREE- The Effects of Food Safety Culture on Food Safety Training Outcomes and Food Safety Attitudes and Knowledge……….…… 85
Introduction……… 85
Methods……….……… 87
Results……… 91
Discussion………..……… 93
Conclusion……….……… 95
References………..……… 101
CONCLUSION……….. 102
APPENDICES………...……… 104
Appendix A- Recent Conference Proceedings on Food Safety Training……..…… 105
Appendix B- Programmed Instruction and Direct Instruction Training Modules for Introduction to Good Manufacturing Practices and Material Controls…….……… 106
Appendix C- Introduction to Good Manufacturing Practices and Material Controls Training Evaluation Survey………... 108
Appendix D- Personal Responsibility and Communicable Diseases Training Evaluation Survey………..……… 124
Appendix E- Allergen Controls Training Evaluation Survey……… 143
Appendix F- Food Defense Training Evaluation Survey………….………. 166
LIST OF TABLES
Table 2.1 Learning Theories of Training Deliveries………..16 Table 2.2 Response Rate for Training Evaluation Surveys and Audit Forms………... 29 Table 2.3 Introduction to Good Manufacturing Practices and Material Controls
Reliability Analyses for each Integrated Behavior Model Construct……… 30 Table 2.4 Personal Responsibility and Communicable Diseases Reliability Analyses
for each Integrated Behavior Model Construct……….. 31 Table 2.5 Allergen Control Reliability Analyses for each Integrated Behavior Model
Construct……… 32 Table 2.6 Food Defense Reliability Analyses for each Integrated Behavior Model
Construct……… 33 Table 2.7 Introduction to Good Manufacturing Practices and Material Controls
Attitude principle component analysis (PCA) factor loadings……….. 33 Table 2.8 Introduction to Good Manufacturing Practices and Material Controls
Attitude principle component analysis (PCA) factor loadings……….. 34 Table 2.9 Introduction to Good Manufacturing Practices and Material Controls
Injunctive Norm principle component analysis (PCA) factor loadings…… 34 Table 2.10 Introduction to Good Manufacturing Practices and Material Controls
Descriptive Norm (Employee) principle component analysis (PCA) factor..35 Table 2.11 Introduction to Good Manufacturing Practices and Material Controls
Perceived Control principle component analysis (PCA) factor loadings….. 35 Table 2.12 Introduction to Good Manufacturing Practices and Material Controls
Perceived Control principle component analysis (PCA) factor loadings….. 35 Table 2.13 Introduction to Good Manufacturing Practices and Material Controls Self
Efficacy principle component analysis (PCA) factor loadings……….. 36 Table 2.14 Introduction to Good Manufacturing Practices and Material Controls
Intention principle component analysis (PCA) factor loadings……….36 Table 2.15 Personal Responsibility and Communicable Diseases Experiential
Table 2.16 Personal Responsibility and Communicable Diseases Instrumental
Attitude principle component analysis (PCA) factor loadings…………...37 Table 2.17 Personal Responsibility and Communicable Diseases Injunctive Norm
principle component analysis (PCA) factor loadings ………37 Table 2.18 Personal Responsibility and Communicable Diseases Descriptive Norm
principle component analysis (PCA) factor loadings……… 38 Table 2.19 Personal Responsibility and Communicable Diseases Perceived Control
principle component analysis (PCA) factor loadings……….38 Table 2.20 Personal Responsibility and Communicable Diseases Perceived Control
principle component analysis (PCA) factor loadings……… 38 Table 2.21 Personal Responsibility and Communicable Diseases Self-Efficacy
principle component analysis (PCA) factor loadings……….39 Table 2.22 Personal Responsibility and Communicable Diseases Intention principle
component analysis (PCA) factor loadings………39 Table 2.23 Allergen Controls Experiential Attitude principle component analysis
(PCA) factor loadings……….39 Table 2.24 Allergen Controls Instrumental Attitude principle component analysis
(PCA) factor loadings……… 40 Table 2.25 Allergen Controls Injunctive Norm principle component analysis (PCA)
factor loadings ………... 40 Table 2.26 Allergen Controls Descriptive Norm principle component analysis (PCA)
factor loadings………41 Table 2.27 Allergen Controls Perceived Control principle component analysis (PCA)
factor loadings ………... 41 Table 2.28 Allergen Controls Perceived Control principle component analysis (PCA)
factor loadings………41 Table 2.29 Allergen Controls Self Efficacy principle component analysis (PCA)
Table 2.31 Food Defense Experiential Attitude principle component analysis (PCA) factor loadings………42 Table 2.31 Food Defense Instrumental Attitude principle component analysis (PCA)
factor loadings ………43 Table 2.33 Food Defense Injunctive Norm principle component analysis (PCA)
factor loadings……….. 43 Table 2.34 Food Defense Descriptive Norm principle component analysis (PCA)
Factor loadings………... 44 Table 2.35 Food Defense Perceived Control principle component analysis (PCA)
factor loadings ………44 Table 2.36 Food Defense Perceived Control principle component analysis (PCA)
factor loadings ………44 Table 2.37 Food Defense Self Efficacy principle component analysis (PCA) factor
loadings……….. 45 Table 2.38 Food Defense Intention principle component analysis (PCA) factor
loadings……….. 45 Table 2.39 Paired T-Test Results of Integrated Behavior Model Constructs for
Introduction to Good Manufacturing Practices and Material Controls
Training Model……….. 46 Table 2.40 Paired T-Test Results of Integrated Behavior Model Constructs for
Personal Responsibility and Communicable Diseases Training Model…… 52 Table 2.41 Paired T-Test Results of Integrated Behavior Model Constructs for
Allergen Controls Training Model………. 60
Table 2.42 Food Defense Paired T-Test Results of Integrated Behavior Model
Constructs for Food Defense Training Model………... 68 Table 3.1 Learning Theories of Training Deliveries………..89 Table 3.2 Logistic Regression of SQF Audit score on Supervisor Audit Response
Table 3.5 Regression of Food Safety Culture on Pre-Training Knowledge Scores for Aggregate Data………...………... 98 Table 3.6 Regression of Food Safety Culture on Pre-Training Intention Scores for
Aggregate Data……….. 98 Table 3.7 Regression of Food Safety Culture on Change in Knowledge
Scores for Aggregate Data.……… 98 Table 3.8 Regression of Food Safety Culture on Change in Knowledge Scores by
Training Delivery……….……….. 98 Table 3.9 Regression of Food Safety Culture on Change in Intention Scores for
Aggregate Data………..……… 98 Table 3.10 Regression of Food Safety Culture on Change in Intention Scores by
LIST OF FIGURES
Figure 1.1 Peer- Reviewed Food Safety Training-Related Publications Per Year……..8 Figure 2.1 Peer-Reviewed Food Safety Training-Related Publications Per Year…….. 75 Figure 2.2 The Integrated Behavior Model………. 75 Figure 2.3 The Effect of Food Safety Training on Non-Compliances……… 76 Figure 2.4 The Effect of Food Safety Training on Knowledge Scores for Aggregate
Data and by Training Topic………... 77 Figure 2.5 The Effect of Food Safety Training on Knowledge Scores for Introduction
To Good Manufacturing Practices and Material Controls Training………. 78
Figure 2.6 The Effect of Food Safety Training on Knowledge Scores for Personal Responsibility and Communicable Diseases Training……….. 79 Figure 2.7 The Effect of Food Safety Training on Knowledge Scores for Allergen
Controls Training……….. 80 Figure 2.8 The Effect of Food Safety Training on Knowledge Scores for Food
Defense Training……… 80 Figure 2.9 Effect of Training Delivery on Change in Food Safety Knowledge………. 81 Figure 2.10 Regression of the Integrated Behavior Model with Pre-Training Results…. 81 Figure 2.11 Regression of the Integrated Behavior Model with Change After Training
CHAPTER ONE
The Current View of Food Safety Training and Food Safety Culture: A Review of Selected Literature
INTRODUCTION
Employee food safety training is performed by many companies as a requirement of either regulation or private industry. The primary goal of food safety training is to increase the food safety knowledge of employees in order to support proper food safety behaviors. Although food safety training is often a requirement, there is no guideline or standard of how training should be designed, implemented, or evaluated. Across various industries and companies, there are a wide variety of types of training programs that are used. These varieties include: bulletins, pamphlets, posters, magazines, books, oral presentations, short courses, films, PowerPoints (Schuler, 1975). More recently, a food safety survey by Campden BRI revealed that the ten most common types of food safety training performed in the food industry are (in descending order): on the job training, reading policies, onboarding training, refresher training, on-site classroom internal training, coaching, examinations, on-site classroom external training, off-site external training, and computer-based training (Emond, 2015).
only able to find four papers that study food safety training in a manufacturing setting (Fenton et al., 2006; Hicks et al., 2004; Nieto-Montenegro et al., 2008; Worsfold, 2005).
As researchers and professionals venture to answer the question of how to improve food safety behaviors, food safety culture has become an important new focus. Food safety culture is a subset of organizational culture, similar to how safety culture is subset of organizational culture. Schein (1985) has defined culture as “the accumulated shared learning of that group as it solves its problems of external adaptation and internal integration; which has worked well enough to be considered valid and, therefore, to be taught to new members as the correct way to perceive, think, feel, and behave in relation to those problems. This accumulated learning is a pattern of system of beliefs, values, and behavioral norms that come to be taken for granted as basic assumptions and eventually drops out of awareness.” Food safety culture has been defined as “the shared attitudes, values and beliefs, towards the food safety behaviors that are routinely demonstrated in food handling organizations (Griffith et al., 2010). Food safety culture is now considered a primary way to predict and change behavior (Yiannas, 2009). Some researchers have set up the field of research for there to be a connection made between food safety culture and food safety training (Jespersen et al, 2017; Nyarugwe et al., 2006; Griffith et al., 2017). Food safety training has even been identified as factor to consider when performing food safety culture research (Nyarugwe et al., 2016).
METHODS
food safety training, food safety culture, and organizational culture and training, and training effectiveness were reviewed.
RESULTS Evaluations of Food Safety Trainings
There is a general lack of information regarding food safety training evaluations in a manufacturing environment. Nieto-Montenegro et al. observed that little research has been done on the effects of food safety training on behaviors in food manufacturing settings. This review of literature found a similar lack of studies. With the search terms “food safety” + “training”, only two peer-reviewed papers were conducted in a manufacturing setting (Nieto-Montenegro et al, 2008.; Worsfold 2005). However, other papers were found that performed studies in a
manufacturing setting that did not meet the search criteria (Fenton et al., 2006; Hicks et al., 2004), but there is still a lack of research done on training in manufacturing compared to training in retail, food service, or catering.
Potential Training Outcomes and Factors Affecting Training Outcomes
Across industry and academia, there is strong support for the notion that an increase in employees’ knowledge is one of the primary outcomes of food safety training
(Nieto-Montenegro et al., 2008; Lynch et al., 2003; Worsfold, 2005). By surveying environmental health specialists, Nummer et al. (2010) found that there was a general agreement that food safety training was a key element of food safety in retail and food service. However, they discovered that there was disagreement over whether or not the training was effective because several restaurants have closed due to violations, despite receiving food safety training. Nummer et al. (2010) reported that the environmental health specialists thought there was a strong
relationship between the quality of the training and its effect on behaviors. Several studies have linked training to increases in knowledge and some have even linked it to improvements in food safe behaviors. Nieto-Montenegro et al. (2008) found that training led to a significant increase in knowledge and incidence of handwashing for employees in the mushroom industry. Lynch et al. (2003) also found that restaurant managers who had received formal food safety training had higher knowledge scores than managers that had not received training and that more experienced managers tended to have higher knowledge scores than managers with less experience. Worsfold (2005) reported that surveyed food manufacturing managers stated that benefits of food safety training are to satisfy requirements, increase knowledge of staff, improve food quality and food safety, increase employee satisfaction, and improve confidence to delegate.
time commitment, and lack of appropriate training courses. In the retail and food service sector, Nummer et al. (2010) found that some shortcomings of training programs are that trainers are poor communicators, do not have a full understanding of the topic being taught, and do not provide an evaluation of the training program. They also found that many of the environmental health specialists they surveyed stated that they were uncomfortable with their current food safety training program and believed that it could be improved, whether that be improving the trainer, the objective of the training, the formatting details of the training, employee motivation, and management commitment (Nummer et al., 2010). In order for training programs to be effective, Nik Husain et al. (2016) concluded that trainings should be built considering the learning process and theories, behavioral theories, and communicating information. Trainings that utilize primarily sequential verbal presentations can limit participant’s learning and may fail to engage participants of varying backgrounds (Weber, 2007). Poorly designed training using traditional methods can lead to a lack of motivation, misperceptions, and lack of knowledge in participants (ISU, 2003). Learning theory-related research has created knowledge that can help design more effective training and education tools (Weber, 2007).
Gap Between Food Safety Training and Behavior
applied a Precede- Proceed model to employee behaviors, suggesting that there are many factors impacting employee food safety behaviors, including: knowledge, perceived risk, perceived control, exposure to training, work pace, worker literacy, other employee’s attitudes towards food safety, incentives for proper behavior, job stress, and perceived organizational justice. The factors impacting employee food safety behaviors are categorized into three groups: predisposing factors, enabling factors, and reinforcing factors. Predisposing factors include factors that
“provide the rationale or motivation for engaging” in a particular behavior, enabling factors include factors that “make it easier for motivated individuals to engage” in a particular behavior, and reinforcing factors include factors that “appear subsequent to the behavior and provide continuing reward or incentive for the behavior to continue” (Mitchel et al., 2007).
Food Safety Culture and Food Safety Training
Several studies have noted connections between food safety training and food safety culture. In their survey of environmental health specialists, Nummer et al. (2010) found that many felt that employees may understand and know the training content, but still did not display safe food behaviors because food safety is not prioritized by management and other employees. Similarly, Nieto-Montenegro et al. (2008) found that post-training supervisor enforcement helped to significantly improve hand-washing in employees in mushroom packing facilities. Food safety training has also been identified by Nyarugwe et al. (2016) as a metric to consider when evaluating food safety culture.
Measuring Food Safety Culture
culture are management commitment to workers and worker food safety behavior. Ungku Fatimah et al. (2014) measured food service employee’s perception of food safety culture by surveying employees to evaluate management and coworkers’ support, communication, self-commitment, environmental support, work pressure, and risk judgement. Jespersen et al. (2016) developed a survey tool using a food safety culture maturity model to measure a company’s position in the framework of the model. This model measures five capability areas (perceived value, people system, process thinking, technology enabled, and tools and infrastructure) and identifies which stage of maturity (doubt, react to, know of, predict, internalize) the company is in for each capability. De Boeck et al. (2015) created a survey instrument to assess food safety culture of an organization by measuring leadership, communication, commitment, resources, and risk awareness.
CONCLUSION
Figure 1.1- Peer-Reviewed Food Safety Training-Related Publications Per Year. 0
1 2 3 4 5 6 7 8 9 10
197
5 1980 1985 1990 1995 2000 2005 2010 2015
Num
be
r of
P
ubl
ic
at
ions
Publication Year
REFERENCES
1. Clayton, D. A., & Griffith, C. J. (2008). Efficacy of an extended theory of planned behaviour model for predicting caterers' hand hygiene practices. International Journal Of Environmental Health Research, 18(2), 83-98.
2. De Boeck, E., Jacxsens, L., Bollaerts, M., & Vlerick, P. (2015). Food safety climate in food processing organizations: Development and validation of a self-assessment tool. Trend in Food Science and Technology. 45(2015). 242-251.
3. Emond, B. (2015). Global Food Safety Training Survey 2015 {PDF}. Campden BRI. 4. Fenton, G. D., LaBorde, L. F., Radhakrishna, R. B., Brown, J. L., & Cutter, C. N. (2006).
Comparison of knowledge and attitudes using Computer-based and Face-to-Face personal hygiene training methods in food processing facilities. Journal of Food Science Education, 5(3), 45-50.
5. Griffith, C.J., Livesey, K.M., Clayton, D. (2010). The assessment of food safety culture. British Food Journal. 112(4). 439-456.
6. Hicks, D., Wiedmann, M., Scott, V., Collette, R., Jahncke, M., & Gall, K. (2004). Minimizing listeria contamination in smoked seafood: Training plant personnel. Food Protection Trends, 24(12).
7. Jespersen, L., Griffiths, M., Maclaurin, T., Chapman, B., & Wallace, C. A.
(2016). Measurement of food safety culture using survey and maturity profiling tools. Food Control. 79 (2017). 371-379.
8. Lynch, R. A., Elledge, B. L., Griffith, C. C., & Boatright, D. T. (2003). A comparison of food safety knowledge among restaurant managers, by source of training and experience, in oklahoma county, oklahoma. Journal of Environmental
Health, 66(2), 9-14, 26.
9. Indiana State University (ISU): 2003, Learning Styles,
(http://www.indstate.edu/ctl/styles/ learning. html# LSTEACH)
10.Mitchell, R. E., Fraser, A. M., & Bearon, L. B. (2007). Preventing food-borne illness in food service establishments: Broadening the framework for intervention and research on safe food handling behaviors. International Journal Of Environmental Health Research, 17(1), 9-24.
hispanic workers in the mushroom industry using the health action model. Food Control. 19(6), 616-633.
13.Nik Husain, N. R., Wan Muda, W. M., Noor Jamil, N. I., Nik Hanafi, N. N., & Abdul Rahman, R. (2016). Effect of food safety training on food handlers' knowledge and practices. British Food Journal, 118(4), 795-808.
14.Nummer, B., PhD, Fraser, A., PhD, Marcy, J., PhD, & Klein, R. (2010). Assessing food safety training needs of environmental health specialists in the U.S.: Focus group summary. Journal of Environmental Health, 72(8), 16-7.
15.Nyarugwe, S. P., Linnemann, A., Hofstede, G. J., Fogliano, V., & Luning, P. A.
(2016). Determinants for conducting food safety culture research. Trends in Food Science and Technology. 56(2016). 77-87.
16.Schuler, G.A. (1975). A Survey of Educational Materials available for Training Food Processing and Food Service Employees in the Area of Sanitation Including: Personal Hygiene, Microbiology, Food Borne Illness, Cleaning and Sanitizing, Food Safety, and Food Plant Construction, Poultry Science, 54 3), 1, 927–944. 17.Weber, J. A. (2006). Business Ethics Training: Insights from Learning Theory. Journal of
Business Ethics, 70 (1), 61-85.
18.Worsfold, D. (2005). A survey of food safety training in small food
manufacturers. International Journal of Environmental Health Research, 15(4), 281-288.
CHAPTER TWO
The Effects of Food Safety Trainings on Employee’s Food Safety Knowledge, Intentions, and Behaviors: Comparing Learning Theories
INTRODUCTION
Over the past 20 years, the topic of food safety training has become more of a concern and priority of those in both academia and industry. This growing concern is evident by looking at the number of peer-reviewed food safety training-related papers published per year (Figure 2.1). Beginning in 2001, peer-reviewed papers were published with “food safety” and “training” in the title every year, with 9 papers published in 2013. This increase in attention is likely due to regulatory or audit-related requirements and increased importance being placed on food safety behaviors caused by the rise of food safety culture awareness (Griffith 2010). Companies are beginning to focus more on their employees and their competencies and attitudes (Griffith 2010; Lynch et al. 2003; Nieto-Montenegro et al. 2008, Dodd et al. 2013, Sinclair et al. 2003), as they realize that on-the-floor employees are extremely influential in the safety of the final product. Since training is one of the most traditional methods of knowledge transfer and is commonly required by regulatory or auditing agencies, many in industry and academia are asking how employee food safety training can be used more effectively in order to affect behavioral change (Nummer et al., 2010; Nieto-Montenegro, 2008; Appendix A).
knowledge or skills, salience of behavior, environmental constraints, and habit (Glanz et al., 2008). The IBM suggests that knowledge is just one of the predictors of behavior, along with intention, personal agency, perceived norm, and attitudes. Several studies have observed a gap between food safety knowledge and food safety behaviors in food safety research, meaning that knowledgeable employees do not always have the most food safe behaviors. (Mullan et al., 2010; Nummer et al., 2010). Ajzen et al. (2011) suggests that actual knowledge is irrelevant to
behavior, while general knowledge or beliefs about a behavior are much stronger predictors of a behavior. In their study, they found that environmental knowledge did not affect energy
conservation and knowledge about the risks of alcohol did not affect drinking behavior. They found a positive effect of Muslim knowledge on pro-Muslim behavior, but this was due to participants’ positive attitudes towards Muslims. Thus, suggesting that training programs that also focus on improving food safety beliefs and are implemented in a supportive environment may have stronger effects on employee food safety behaviors.
“satisfied” with their current food safety training methods. Yet, the same processors reported that benefits of having effective employee training include improved food safety culture, improved product quality, and fewer consumer complaints (Emond, 2015).
This study explored the effect of three types of food safety trainings on employee attitudes, personal agency, perceived norm, intention, knowledge, and behavior. Individual e-learning modules, group e-e-learning modules, and group discussion-based virtual tour trainings were developed and assessed in order to compare effects of learning theories on changes in knowledge, attitudes, perceived norm, personal agency, and intentions. It was hypothesized that there would be differences in the effects of learning theories on training outcomes and that group trainings would be more effective than individual trainings. These training types were selected because these represent three of the more popular types of training performed within the food industry and the primary (Medeiros et al, 2011; Emond, 2015). These analyses emphasized the importance of training design and delivery methods, as well as highlighted the potential effect that training can have on employee knowledge, attitudes, perceived norm, personal agency, intentions, and behavior.
METHODS Training Module and Tour Development
through stimulation and reinforcement from the environment. Wu et al. (2011), described direct instruction as “a general term for explicit teaching using lectures rather than exploratory models such as inquiry-based learning.” Programmed instruction involves technology that presents structured material in a sequence that allows students to progress through the material at their own speed. Social learning involves learning through observation or imitation of others. The constructivism learning theory suggests that learning is an active process. Situated learning suggests that “learning is embedded within activity, context, and culture” and is “a product of the social practices of its educational professionals” (Wu et al, 2011).
The programmed instruction training was completed by employees individually, at their own pace, on a company computer, at work (Appendix B). It was created using Articulate Storyline e-learning software (Articulate). Each module began by reviewing the learning outcomes of the module. Each chapter or “page” of the module was accompanied by voiceover narration and had buttons on the bottom of the screen to advance the user to the next page. Each page had graphics or a type of animation requiring user interaction. “Knowledge Check”
questions were embedded throughout the module to ensure and measure user comprehension. If the questions were answered incorrectly, a narrated page would appear to explain why the chosen answer is incorrect and inform the user of the correct answer. After completing the module, the user’s knowledge score would appear informing them of whether or not they had passed the module.
The social and situated learning training consisted of a virtual tour, guided by a manager or supervisor, and was performed in a group setting. This training was developed using Panotour virtual tour creation software (Panotour). 360° still-images were taken in 10 locations in a dairy processing plant using six GoPro cameras mounted in a Freedom 360 mount. The dairy
processing plant processed both liquid milk and ice cream and therefore was representative of the majority of Company X’s plants, whether those plants processed liquid milk, ice cream, or other dairy products. Each social and situated learning training began in the training room and had a hotspot that opened a 1-3 minute introductory video or introductory text. Each room within the tour contain hot spots, or buttons, that could be clicked to reveal informative text and images. Transitional hot spots were also present and allowed the user to progress to the next room or return to the previous room. The social and situated learning trainings were designed to be led by a facilitator, either a plant manager or supervisor, and was accompanied by a facilitator’s guide that contained instructions of how to navigate the tour. The facilitator’s guide also contained accompanying narration and discussion-based knowledge questions that encourage group engagement and interaction.
Table 2.1: Learning Theories of Training Deliveries
Individual Training Group Training Computer Module Programmed Instruction (PI) Direct Instruction (DI)
Virtual-Tour Social and Situated Learning (SSL)
Instrument Development
The Integrated Behavior Model (Figure 2.2) (Glanz et al. 2008) was used as a framework for a brief questionnaire (15 minutes) (Appendix C-F). This food safety training-evaluation questionnaire (FSTEQ) measured employee attitudes, perceived norms, and personal agency, intentions, and knowledge regarding the food safety policies of the associated module using a 7-point Likert scale. The questionnaire was administered to employees immediately before and after the employees experienced training. Supervisor observation audits were also used to collect behavioral data by measuring non-compliances twice one month prior to the training being implemented and twice after the training had been completed (Appendix G-J). These observation audits recorded the level of compliance to various food safety policies that are covered in the training modules. These data were used to provide a complete picture of the effectiveness of the current training system.
Data Collection
training topic for which to perform the evaluations, in an effort reduce the extra workload assigned to each facility and the time taken during the training process.
Employees at each plant were offered a pre- and post-training survey, which they were instructed to place in a sealed “ballot box” created by Human Resources. The pre-training survey contained the FSTEQ and the post-training survey contained the FSTEQ and demographic questions. Once training at each location has been completed, the human resources manager shipped the box to researchers at NC State without breaking the seal on the box. All data collection methods and data collection tools were approved by the North Carolina State University Institutional Review Board prior to any data being collected.
Pilot Testing
The survey instrument was tested during a pilot study prior to being used to collect data. The pilot test was performed at a single processing plant. Data was collected from twenty employees using an online form of the survey. Only the Allergen Control programmed instruction training delivery was evaluated.
Populations and Sample
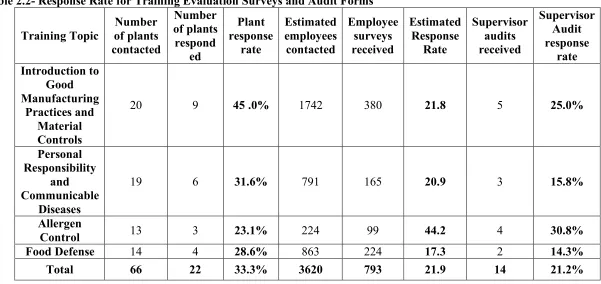
not a statistically significant difference between the audit scores of plants that submitted supervisor audits and those that did not (p=0.372) (Table 2.2).
Data Analysis
All pre-training IBM construct questions were tested for reliability and validity by calculating the Cronbach’s alpha scores and principal component scores. Before the analyses were run, all responses were adjusted to be measured on a negative (1) to positive (7) Likert scale.
The trainings were implemented at all 66 of Company X’s dairy processing plants. Evaluations were assigned and sent to each location. One third (N=22) of all plants mailed in completed employee surveys (Table 2.2). When considering the number of workers employed at responding plants, (N=3620), the total response rate of completed surveys was 21.9% (N=793). 21.2% (N=14) of all plants responded with completed supervisor audit data (Table 2.2).
Pre- and post-training knowledge quizzes were sorted to eliminate quizzes that had over 50% completion. Scores of quizzes with 50% completion or less were eliminated to control for inaccurate data due to skipped questions, while also allowing for the possibility that some questions may be skipped due to lack of knowledge.
Using SPSS, the IBM construct data, knowledge scores, and audit data were tested for normality with a Shapiro-Wilk test, which determined that all of the data was non-parametric. As a result, all pre- and post-training comparisons of non-compliances, IBM constructs, and
RESULTS Reliability and Validity
The Cronbach’s alpha score for each construct for each training topic was higher than 0.7 (Table 2.3-2.6) and the PCA factor loadings were 0.420 or higher, with only one principle
component per factor loading (Tables 2.7-38). Therefore, all evaluation questions are deemed to be reliable and valid (Hair et al., 2010).
Regression of Pre-Training Knowledge and Intention to Predict Non-Compliances
For the aggregate training data, the results of the multiple linear regression indicated that there was a significant collective effect of pre-training knowledge and intentions on pre-training non-compliances F(2, 235)-10.977, p<0.000, R2=0.078, This model only explains 7.8% of the variance in the regression. The individual predictors were examined further and indicated that only pre-training knowledge was a significant individual predictor (t=4.392, p<0.000). The standardized coefficients Beta (B=0.275) indicated that higher pre-training knowledge was associated with higher pre-training non-compliances.
However, these results were not consistent for the individual training topic data. There was not a significant collective effect on pre-training knowledge and intention on pre-training non-compliance scores for the Introduction to Good Manufacturing Practices and Material Controls, Personal Responsibility and Communicable Diseases, or Food Defense training topics (p<0.05). This analysis was not able to be performed for the Allergen Controls training topic. Regression of Change in Knowledge and Intention to Predict Change in Non-Compliances
Diseases training topics (p<0.05). This regression was not able to be performed from the Allergen Controls or Food Defense training topics.
Effect of Training on Employees’ Food Safety Knowledge
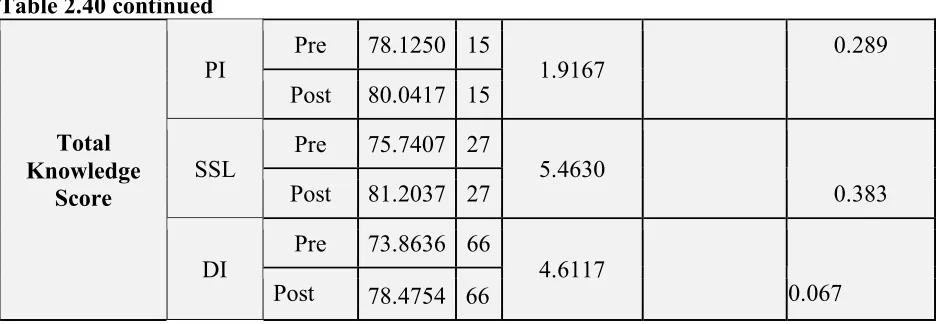
There was a significant difference in pre- (Median=75.00, Mean=74.82, SD=19.68) and post-training (Median=80.06, Mean=80.06, SD=18.62) knowledge scores for aggregate training data (p<0.000). There was also a significant increase in knowledge for each of the individual training topics, except Allergen Controls (Figure 2.4).
There was a significant increase in knowledge from pre-training knowledge scores (Median=83.33, SD=21.308) to post-training knowledge scores (Median=91.67, SD=19.326) for all Introduction to Good Manufacturing Practices and Material Controls trainings, p=0.001 (Figure 2.3). There was also a significant increase in knowledge for questions on Question 4: Ingredient and Packaging Storage (pre-training Median=1.00, Mean=0.80, SD=0.398; post training Median=1.00, Mean=0.87 SD=0.332), p=0.004) (Figure 2.5).
There was a not a significant increase overall in knowledge from pre-training knowledge scores (Median=62.50, SD=20.96) to post-training knowledge scores (Median=69.38,
SD=20.03) for Allergen Control trainings, p=0.094. However ,there was a significant increase in knowledge for questions on Question 2: % of Allergens (pre-training Median=1.00, M=0.67, SD=0.47; post-training Median=1.00, M=0.80, SD=0.40), p=0.005, Question 4: Source of Contamination (pre-training Median= 0.40, M=0.52, SD=0.35; post-training Median=0.75, M=0.62, SD=0.32), p=0.041), and Question 5: Cleaning Procedure (pre-training Median=1.00, M=0.53, SD=0.50; post-training Median= 1.00, M=0.66, SD=0.47), p=0.013) (Figure 2.7).
There was a significant increase overall in knowledge from pre-training knowledge scores (Median=73.33, SD=15.74) to post-training knowledge scores (M=75.00, SD=15.72) for Food Defense trainings, p=0.023 (Figure 2.4). There was also a significant increase in
knowledge for questions on Question 2: Food Defense vs. Food Safety (pre-training Median= 0.00, M=0.39, SD=0.482; post-training Median=1.0, M=0.61, SD=0.490), p=0.013) and Question 5: Product Vulnerability (pre-training Median=0.67, M=0.62, SD=0.30; post-training Median=0.67, M=0.73, SD=0.26), p<0.000) (Figure 2.8).
Effect of Training Delivery on Employees’ Food Safety Knowledge
analyses for each individual training topic, there was only a significant difference in pre and post-training knowledge scores for the Introduction to Good Manufacturing Practices and Material Controls direct instruction training (Tables 2.39-2.42).
Effect of Demographics on Change in Food Safety Knowledge
The aggregate data was tested to measure for differences in effects of various
demographic aspects. Speaking English as a primary language, Gender, Length of time worked for the company, and Ethnicity did not have a significant effect on the change in knowledge experienced by employees (p>0.05).
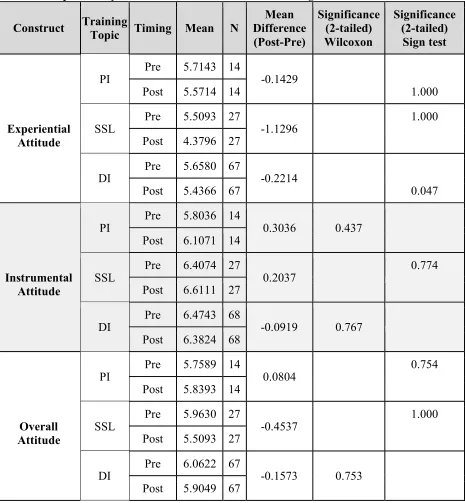
Effect of Training on Change in Intentions
For the aggregate data, a Wilcoxon test indicated that there was a significant increase in employee intentions from (Median=7.00, Mean=6.35, SD=0.90) to (Median=7.00, Mean=6.39, SD=1.03) after receiving training (p=0.007). When performing this test on each training
delivery, there was only a significant difference in intention for the direct instruction training from (Median= 6.50, Mean=6.26, SD=0.95) to (Median=6.75, Mean=6.35, SD=0.97) after receiving training (p=0.023). The direct instruction training was the only training to display significant increases in employee intentions, although significant increases were only seen for the Introduction to Good Manufacturing Practices and Material Controls and 2 training topics p<0.05) (Tables 2.39-2.42).
Integrated Behavior Model Confirmation- Pre-training results
individual predictors of pre-training intention (p<0.000) (Figure 2.10). This regression was also significant for the Introduction to Good Manufacturing Practices and Material Controls, Personal Responsibility and Communicable Diseases, Allergen Controls, and Food Defense training topics.
Integrated Behavior Model Confirmation- Change in Pre and Post-Training Constructs For each responding plant, post-training non-compliances were subtracted from pre-training non-compliances to determine the total change in non-compliances.
For the aggregate training data, there was not a significant regression between change in attitudes, personal agency, and perceived norm to predict change in intentions (p<0.05). The regression was also not significant for the Introduction to Good Manufacturing Practices and Material Controls, Personal Responsibility and Communicable Diseases, Allergen Controls, and Food Defense training topics (p<0.05).
Integrated Behavior Model Confirmation- Change in Training Constructs
For the aggregate data, results of the multiple linear regression explained 35.7% of the variation in the data and indicated that there was a significant collective effect of post-training attitude, perceived norm, and personal agency on post-training intention scores F(3,
DISCUSSION
Effect of Food Safety Trainings on Non-Compliances
Concerning the change in non-compliances reported on the supervisor audits from before and after training, significant changes were not found in the aggregate data or for individual training topics. This gap between training and behavior is consistent with findings from other studies (Nummer et al., 2009; Clayton et al., 2002). However, Nieto-Montenegro et al. (2008) did see a reduction in rates of non-compliance for several food safety behaviors in their study. This outcome could be influenced by the lower response rate (responding plants might have a lower number of pre-training non-compliances than non-responding plants), respondent bias (reporting fewer non-compliances than actually present), or the high starting level of compliance. Each plant that completed supervisor audits did not administer the same type of training to all employees, so comparisons were not able to be made of the effect of each training on measured non-compliance. Another study should be done that administers only one type of training to the employees of a manufacturing location and collects compliance data over a longer period of time with a more detailed audit and using behavioral observations.
Knowledge and Intention as Predictors of Non-Compliance
during a training intervention will not necessarily lead to an improvement in employee
behaviors. This is supported by the previously discussed finding that there was not a significant change in compliance after experiencing food safety training.
Effect of Food Safety Trainings on Knowledge
There was a significant increase in knowledge for the aggregate data and each training topic. This association between a training intervention and an increase in knowledge is consistent with findings from other studies (Nieto-Montenegro et al., 2007; Nummer et al., 2009; Lynch et al., 2003) In the comparison between pre- and post-training training knowledge scores, group training was generally more effective at generating knowledge gains. The two group training options (direct instruction and social and situated learning) displayed significant increases in knowledge for the aggregate data, but the programmed instruction did not. This data slightly contradicts the results of the effects of training delivery on non-compliance, but this test had a much larger sample size and fewer impacting external variables. This data demonstrates that, overall, group training may be more beneficial than individual training.
technological platform or the learning theory. Alternatively, the difference could be due to the fact that the direct instruction module as very structured and there was room for deviation and variation in the social and situated learning module. The data showed that the direct instruction training option was the most effective in terms of knowledge transfer. However, this training option was not designed for the study, but was created by the plant employees administering the training, so this result should be interpreted cautiously. Outside factors that might have affected the performance of the social and situated learning training option is the familiarity of the trainers and employees with the training medium. Virtual reality is still a novel concept, so it is possible that trainers were not comfortable in leading the training, despite having received training via webinar. Demographic variables such as gender, speaking English as a primary language, ethnicity, and length of time worked at the company did not have consistent notable effects on pre-training knowledge, post-training knowledge, or change in food safety knowledge. Effect of Food Safety Trainings on Intentions
For the aggregate data, there was a significant increase in food safety intentions after training, but when comparing the three training deliveries, there was only a significant increase observed for the direct instruction training. There was also a significant change in intentions for the Introduction to Good Manufacturing Practices and Material Controls and Personal
Responsibility and Communicable Diseases direct instruction training delivery and the Personal Responsibility and Communicable Diseases programmed instruction. training delivery. These data suggest that training that utilizes the direct instruction learning theory may have a
Integrated Behavior Model Confirmation
The multiple regressions showed that there was a significant predictive effect of pre and post-training employee attitudes, perceived norms, and personal agency on employee food safety pre- and post-training intentions for the aggregate data and for each training topic, which was expected by the IBM model (Glanz et al. 2008). There was also a significant positive effect of pre-training intention and knowledge on pre-training non-compliances for the aggregate data, but this was not consistent with the data for any of the individual training topics. The regression between change in knowledge and intention to predict change in non-compliances was also not significant or the aggregate data or any of the individual training topics. The main explanation for this is that non-compliances observed is an indirect measure of behavior, and thus does not necessarily fit into the model as the IBM is a measure to predict behavior (Glanz et al. 2008). A more accurate measurement would have been direct behavioral observations, but that was outside the scope and abilities of this project.
CONCLUSION
demonstrates that training design can impact the effectiveness of training. Furthermore, there was a difference in the effectiveness of training based on the learning theory applied, suggesting that the intentional application of learning theories.
Because the limitations of this study, direct behavioral observations were not able to be made and this weakened the accuracy of the compliance data in certain regards. Although the supervisor audit forms were able to measure compliance to certain standards, observations in the form of video surveillance would have been a more accurate measure.
Table 2.2- Response Rate for Training Evaluation Surveys and Audit Forms Training Topic Number of plants contacted Number of plants respond ed Plant response rate Estimated employees contacted Employee surveys received Estimated Response Rate Supervisor audits received Supervisor Audit response rate Introduction to Good Manufacturing Practices and Material Controls
20 9 45 .0% 1742 380 21.8 5 25.0%
Personal Responsibility
and Communicable
Diseases
19 6 31.6% 791 165 20.9 3 15.8%
Allergen
Control 13 3 23.1% 224 99 44.2 4 30.8%
Food Defense 14 4 28.6% 863 224 17.3 2 14.3%
Table 2.3- Introduction to Good Manufacturing Practices and Material Controls Reliability Analyses for each Integrated Behavior Model Construct
Sub-Construct Cronbach’s Alpha Construct Cronbach’s Alpha Construct Cronbach’s Alpha
Experiential
Attitude 0.949 Overall
Attitude 0.875
Intention 0.926 Instrumental
Attitude 0.925 Injunctive
Norm 0.957 Perceived
Norm 0.960
Descriptive
Norm 0.952
Perceived
Control 0.923 Personal
Agency 0.944
Table 2.4- Personal Responsibility and Communicable Diseases Reliability Analyses for each Integrated Behavior Model Construct
Sub-Construct Cronbach’s Alpha Construct Cronbach’s Alpha Construct Cronbach’s Alpha
Experiential
Attitude 0.841 Overall
Attitude 0.742
Intention 0.656 /0.825* Instrumental
Attitude 0.829
Injunctive Norm 0.883
Perceived
Norm 0.929
Descriptive
Norm 0.886
Perceived
Control 0.821 Personal
Agency 0.849 Self-Efficacy 0.628
/0.796*
Table 2.5- Allergen Control Reliability Analyses for each Integrated Behavior Model Construct
Sub-Construct Cronbach’s
Alpha Construct Cronbach’s Alpha Construct Cronbach’s Alpha
Experiential
Attitude 0.881 Overall
Attitude 0.861
Intention 0.976 Instrumental
Attitude 0.921
Injunctive
Norm 0.966 Perceived
Norm 0.971
Descriptive
Norm 0.955
Perceived
Control 0.925 Personal
Agency 0.944
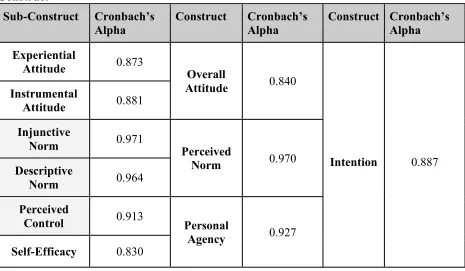
Table 2.6- Food Defense Reliability Analyses for each Integrated Behavior Model Construct
Sub-Construct Cronbach’s
Alpha Construct Cronbach’s Alpha Construct Cronbach’s Alpha
Experiential
Attitude 0.873 Overall
Attitude 0.840
Intention 0.887 Instrumental
Attitude 0.881
Injunctive
Norm 0.971 Perceived
Norm 0.970
Descriptive
Norm 0.964
Perceived
Control 0.913 Personal
Agency 0.927
Self-Efficacy 0.830
Table 2.7- Introduction to Good Manufacturing Practices and Material Controls Attitude principle component analysis (PCA) factor loadings. Each question was measured with a seven-point scale ranging from very gratifying (1) to very ungratifying (7).
EXPERIENTIAL ATTITUDE
Question: Please rank how gratifying you find the following tasks. Factor Loading Comp 1 Using the correct color of buckets and brushes to prevent contamination. 0.922 Keeping my workplace clean during my shift. 0.906 Making sure than cleaning compounds are properly labeled and stored
separately from raw materials. 0.949
Making sure that materials and ingredients are properly labeled, stored,
Table 2.8- Introduction to Good Manufacturing Practices and Material Controls Attitude principle component analysis (PCA) factor loadings. Each question was measured with a seven-point scale ranging from Extremely unlikely (1) to Extremely likely (7).
INSTRUMENTAL ATTITUDE
Question: Please rank how likely you find the following statements. Factor Loading Comp 1
Using the correct color of buckets and brushes supports the safety of the product.
0.895 Keeping my workplace clean throughout my shift supports the safety of
the product
0.891 Making sure that cleaning compounds are properly labeled and stored
separately from raw materials supports the safety of the product.
0.945 Making sure that materials and ingredients are properly labeled, stored,
and sealed supports the safety of the product.
0.894
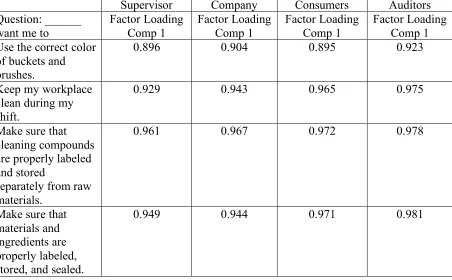
Table 2.9- Introduction to Good Manufacturing Practices and Material Controls Injunctive Norm principle component analysis (PCA) factor loadings. Each question was measured with a seven-point scale ranging from strongly disagree (1) to strongly agree (7). PCAs were run separately for each group: Supervisor, Company, Consumers, Auditors.
Supervisor Company Consumers Auditors Question: ______
want me to
Factor Loading Comp 1 Factor Loading Comp 1 Factor Loading Comp 1 Factor Loading Comp 1 Use the correct color
of buckets and brushes.
0.896 0.904 0.895 0.923
Keep my workplace clean during my shift.
0.929 0.943 0.965 0.975
Make sure that cleaning compounds are properly labeled and stored
separately from raw materials.
0.961 0.967 0.972 0.978
Make sure that materials and ingredients are properly labeled, stored, and sealed.
Table 2.10- Introduction to Good Manufacturing Practices and Material Controls Descriptive Norm (Employee) principle component analysis (PCA) factor loadings. Each question was measured with a seven-point scale ranging from strongly disagree (1) to strongly agree (7).
Question: My fellow employee…. Factor Loading Comp 1
Uses the correct color of bucket and brushes. 0.928 Keeps the workplace clean during their shift. 0.893 Makes sure that cleaning compounds are properly labeled and stored
separately from raw materials.
0.961 Makes sure that materials and ingredients are properly labeled,
stored, and sealed. 0.963
Table 2.11 Introduction to Good Manufacturing Practices and Material Controls Perceived Control principle component analysis (PCA) factor loadings. Each question was measured with a seven-point scale ranging from “not under my control” (1) to “under my control” (7). PCAs for Safety and Occasion were run separately.
Safety Question: Rank how much control you have over the safety of our
products by…
Factor Loading Comp 1 Using the correct color of buckets and brushes. 0.847
Keeping my workplace clean during my shift. 0.733 Making sure that cleaning compounds are properly labeled and
stored separately from raw materials.
0.916 Making sure that materials and ingredients are properly labeled,
stored, and sealed.
0.896
Table 2.12- Introduction to Good Manufacturing Practices and Material Controls
Perceived Control principle component analysis (PCA) factor loadings. Each question was measured with a seven-point scale ranging from “not under my control” (1) to “under my control” (7). PCAs for Safety and Occasion were run separately.
Occasion
Question: At every possible occasion, I am able to… Factor Loading Comp 1 Using the correct color of buckets and brushes. 0.819
Keeping my workplace clean during my shift. 0.755 Making sure that cleaning compounds are properly labeled and
stored separately from raw materials. 0.911
Making sure that materials and ingredients are properly labeled,
Table 2.13- Introduction to Good Manufacturing Practices and Material Controls Self Efficacy principle component analysis (PCA) factor loadings. Each question was measured with a seven-point scale ranging from “I could not” (1) to “certain I could” (7).
Question: I have the ability to… Factor Loading Comp 1 Use the correct color of buckets and brushes. 0.854
Keep my workplace clean during my shift. 0.846
Make sure that cleaning compounds are properly labeled and stored
separately from raw materials. 0.891
Make sure that materials and ingredients are properly labeled, stored, and sealed.
0.918
Table 2.14- Introduction to Good Manufacturing Practices and Material Controls
Intention principle component analysis (PCA) factor loadings. Each question was measured with a seven-point scale ranging from strongly disagree (1) to strongly agree (7).
Question: I will… Factor Loading Comp 1
Use the correct color of buckets and brushes. 0.888
Keep my workplace clean during my shift. 0.895
Make sure that cleaning compounds are properly labeled and stored
separately from raw materials. 0.945
Make sure that materials and ingredients are properly labeled,
stored, and sealed. 0.903
Table 2.15- Personal Responsibility and Communicable Diseases Experiential Attitude principle component analysis (PCA) factor loadings. Each question was measured with a seven-point scale ranging from very gratifying (1) to very ungratifying (7).
EXPERIENTIAL ATTITUDE
Question: Please rank how gratifying you find the following tasks. Factor Loading Comp 1
Properly washing my hands when necessary. 0.869
Correctly wearing gloves, hair nets, and beard nets. 0.937 Not eating, drinking, chewing gum/toothpicks, or using tobacco
products in GMP area. 0.881
Table 2.16- Personal Responsibility and Communicable Diseases Instrumental Attitude principle component analysis (PCA) factor loadings. Each question was measured with a seven-point scale ranging from extremely unlikely (1) to extremely likely (7).
INSTRUMENTAL ATTITUDE
Question: Please rank how likely you find the following statements. Factor Loading Comp 1 Properly washing my hands when necessary supports the safety of
the product.
0.863 Correctly wearing gloves, hair nets, and beard nets supports the
safety of the product
0.875 Not eating, drinking, chewing gum/toothpicks, or using tobacco
products in GMP areas supports the safety of the product. 0.914 Not coming into work when I am sick supports the safety of the
product. 0.658
Table 2.17- Personal Responsibility and Communicable Diseases Injunctive Norm principle component analysis (PCA) factor loadings. Each question was measured with a seven-point scale ranging from strongly disagree (1) to strongly agree (7). PCAs were run separately for each group: Supervisor, Company, Consumers, Auditors.
Supervisor Company Consumer Auditor
Question: My ___ wants me to
Factor Loading Comp 1 Factor Loading Comp 1 Factor Loading Comp 1 Factor Loading Comp 1 Properly wash
my hands when necessary.
0.902 0.873 0.926 0.981
Correctly wear gloves, hair nets, and beard nets.
0.938 0.933 0.967 0.975
Not eat, drink, chew
gum/toothpicks, or use tobacco products in GMP areas.
0.900 0.892 0.919 0.966
Not come into work when I am sick.
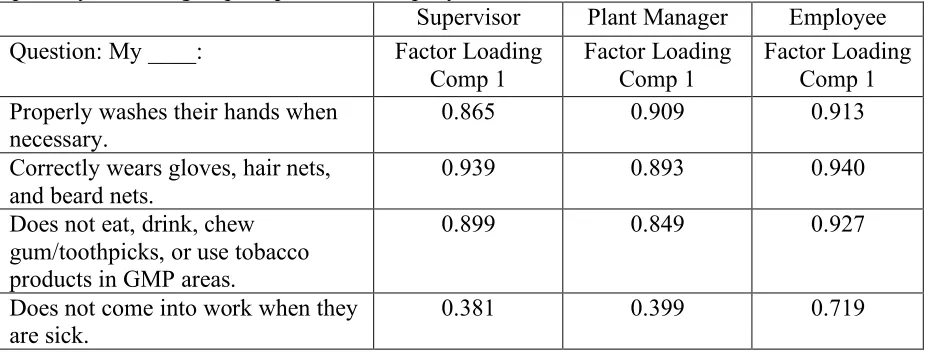
Table 2.18- Personal Responsibility and Communicable Diseases Descriptive Norm principle component analysis (PCA) factor loadings. Each question was measured with a seven-point scale ranging from strongly disagree (1) to strongly agree (7). PCAs were run separately for each group: Supervisor, Company, Consumers, Auditors.
Supervisor Plant Manager Employee Question: My ____: Factor Loading
Comp 1 Factor Loading Comp 1 Factor Loading Comp 1 Properly washes their hands when
necessary. 0.865 0.909 0.913
Correctly wears gloves, hair nets, and beard nets.
0.939 0.893 0.940
Does not eat, drink, chew gum/toothpicks, or use tobacco products in GMP areas.
0.899 0.849 0.927
Does not come into work when they are sick.
0.381 0.399 0.719
Table 2.19- Personal Responsibility and Communicable Diseases Perceived Control principle component analysis (PCA) factor loadings. Each question was measured with a seven-point scale ranging from Not under my control (1) to Under my control (7).
Safety Question: Rank how much control you have over the safety of our
product by: Factor Loading Comp 1
Properly washing my hands when necessary. 0.891
Correctly wearing gloves, hair nets, and beard nets. 0.916 Not eating, drinking, chewing gum/toothpicks, or using tobacco
products in GMP areas.
0.925
Not coming into work when I am sick. 0.593
Table 2.20- Personal Responsibility and Communicable Diseases Perceived Control principle component analysis (PCA) factor loadings. Each question was measured with a seven-point scale ranging from Not under my control (1) to Under my control (7).
Occasion
Question: At every possible occasion, I am able to: Factor Loading Comp 1
Properly wash my hands when necessary. 0.863
Correctly wear gloves, hair nets, and beard nets. 0.929 Not eat, drink, chew gum/toothpicks, or use tobacco products in
GMP areas. 0.933
Table 2.21- Personal Responsibility and Communicable Diseases Self-Efficacy principle component analysis (PCA) factor loadings. Each question was measured with a seven-point scale ranging from I could not (1) to certain I could agree (7).
Question: I have the ability to: Factor Loading Comp 1
Properly wash my hands when necessary. 0.815
Correctly wear gloves, hair nets, and beard nets. 0.917 Not eat, drink, chew gum/toothpicks, or use tobacco products in
GMP areas. 0.869
Not come into work when I am sick. 0.532
Table 2.22- Personal Responsibility and Communicable Diseases Intention principle component analysis (PCA) factor loadings. Each question was measured with a seven-point scale ranging from strongly disagree (1) to strongly agree (7).
Question: I will: Factor Loading Comp 1
Properly wash my hands when necessary. 0.930
Correctly wear gloves, hair nets, and beard nets. 0.932 Not eat, drink, chew gum/toothpicks, or use tobacco products in
GMP areas.
0.919
Not come into work when I am sick. 0.420
Table 2.23- Allergen Controls Experiential Attitude principle component analysis (PCA) factor loadings. Each question was measured with a seven-point scale ranging from very gratifying (1) to very ungratifying (7).
EXPERIENTIAL ATTITUDE
Question: Please rank how gratifying you find the following tasks. Factor Loading Comp 1 Properly stacking and storing raw materials to prevent allergen
cross-contact. 0.730
Making sure the correct label and packaging is on the product to
prevent allergen cross-contact. 0.919
Properly cleaning machines and equipment to prevent allergen
cross-contact. 0.885
Table 2.24- Allergen Controls Instrumental Attitude principle component analysis (PCA) factor loadings. Each question was measured with a seven-point scale ranging from extremely unlikely (1) to extremely likely (7).
ISNTRUMENTAL ATTITUDE
Question: Please rank how likely you find the following statements. Factor Loading Comp 1
Properly stacking and storing raw materials supports the safety of the product.
0.950 Making sure the correct label packaging is on the product supports
the safety of the product.
0.928 Properly cleaning machines and equipment supports the safety of the
product.
0.922 Following the production schedule supports the safety of the product. 0.816
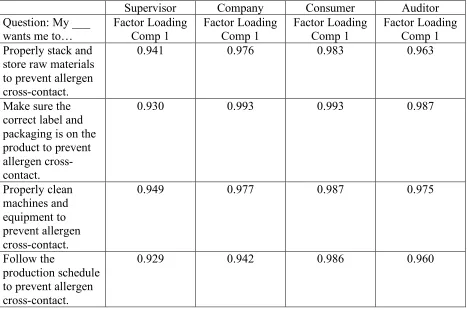
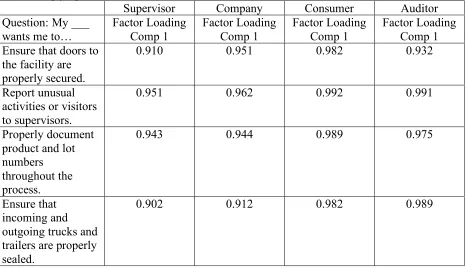
Table 2.25- Allergen Controls Injunctive Norm principle component analysis (PCA) factor loadings. Each question was measured with a seven-point scale ranging from strongly disagree (1) to strongly agree (7).
Supervisor Company Consumer Auditor Question: My ___
wants me to…
Factor Loading Comp 1 Factor Loading Comp 1 Factor Loading Comp 1 Factor Loading Comp 1 Properly stack and
store raw materials to prevent allergen cross-contact.
0.941 0.976 0.983 0.963
Make sure the correct label and packaging is on the product to prevent allergen cross-contact.
0.930 0.993 0.993 0.987
Properly clean machines and equipment to prevent allergen cross-contact.
0.949 0.977 0.987 0.975
Follow the
production schedule to prevent allergen cross-contact.
Table 2.26- Allergen Controls Descriptive Norm principle component analysis (PCA) factor loadings. Each question was measured with a seven-point scale ranging from strongly disagree (1) to strongly agree (7).
Question: My fellow employee: Factor Loading Comp 1
Properly stacks and stores raw materials to prevent allergen cross contact.
0.961 Makes sure the correct label and packaging it on the product to
prevent allergen cross-contact.
0.941 Properly cleans machines and equipment to prevent allergen
cross-contact.
0.933 Follows the production schedule to prevent allergen cross-contact. 0.919
Table 2.27- Allergen Controls Perceived Control principle component analysis (PCA) factor loadings. Each question was measured with a seven-point scale ranging from strongly disagree (1) to strongly agree (7).
Safety Question: Rank how much control you have over whether someone
has an allergic reaction to our product by:
Factor Loading Comp 1 Properly stacking and storing raw materials to prevent allergen
cross-contact.
0.759 Making sure the correct label and packaging is on the product to
prevent allergen cross-contact.
0.808 Properly cleaning machines and equipment to prevent allergen
cross-contact.
0.816 Following the production schedule to prevent allergen
cross-contact. 0.907
Table 2.28- Allergen Controls Perceived Control principle component analysis (PCA) factor loadings. Each question was measured with a seven-point scale ranging from strongly disagree (1) to strongly agree (7).
Occasion
Question: At every possible occasion, I am able to: Factor Loading Comp 1 Properly stacking and storing raw materials to prevent allergen
cross-contact. 0.888
Making sure the correct label and packaging is on the product to prevent allergen cross-contact.
0.866 Properly cleaning machines and equipment to prevent allergen
cross-contact.
Table 2.29- Allergen Controls Self Efficacy principle component analysis (PCA) factor