MONOLAYERS FOR MOLECULAR-SCALE SURFACE PATTERNING
Thesis by
Kimberly Marshall Papadantonakis
In Partial Fulfillment of the Requirements for the degree of
Doctor of Philosophy
CALIFORNIA INSTITUTE OF TECHNOLOGY
Pasadena, California 2008
© 2009
ACKNOWLEDGMENTS
Six years and six months ago I was thrilled to receive notice of my admission to Caltech. I was delighted and proud to have the opportunity to study at Caltech, but was also apprehensive about my ability to succeed in an environment possessing such an intimidating reputation for research excellence and academic difficulty. I am truly grateful to the many people that have since proven that the environment at Caltech is much less intimidating than it is supportive.
I first acknowledge the support and encouragement that I have received from my advisor, Professor Nathan Lewis. I have truly enjoyed working for Nate, and it is clear to me that the smartest academic move that I made while at Caltech occurred during my first few months on campus when I decided to join the Lewis group. Nate has not only allowed me to work independently and to set the course of my research project, but has also supplied extremely well-timed words of encouragement. Nate is a person that somehow manages to impart keen insights and thoughtful advice in a way that “just takes five minutes”.
Bruce Brunschwig arrived at Caltech at nearly the same time that I did, and from the same Suffolk County, Long Island paradise. For some reason, Bruce chooses to spend a lot of time hanging around the Lewis group, and that peculiar habit has proved immensely valuable to the group as a whole and to me in particular. Bruce is particularly good at identifying questions about my work that I had neglected to address. He has served as a second research advisor for me, and fittingly has been a member of my Ph.D. committee since candidacy.
I thank the members of the Lewis group with whom I have had enjoyed sharing offices and lab space during my time at Caltech. I have appreciated the advice, helpful discussions, and friendship that the Lewis group members have offered to me as well as their wry sense of humor. I have particularly benefited from conversations with Matt Traub, Kate Plass, Jim Maiolo, Lauren Webb, Stephen Maldonado, Anna Folinsky, David Michalak, Tony Fitch, Edgardo García-Berríos, Marc Woodka, and David “DK” Knapp who gave me my first five-minute introduction to the operation of the scanning tunneling microscope.
FOREWORD
ABSTRACT
Many simple organic molecules, such as straight-chain alkanes and simple aromatics, spontaneously assemble into highly ordered monolayers at solid–liquid interfaces. These monolayers are composed of molecules that lie flat at the interface without forming chemical bonds to the surface of the solid. These monolayer structures are highly ordered and produce patterns with features on the scale of just a single nanometer in length. The exploitation of this physisorption phenomenon may provide a promising route toward an inexpensive nanometer-scale surface patterning technique. However, two fundamental challenges must be overcome before physisorbed monolayers can be useful in surface-patterning applications: (1) absence of control over the particular pattern formed by the molecules; and (2) pattern impermanence.
This document opens with an introductory chapter that contains background on physisorbed monolayers and a brief description of scanning tunneling microscopy, the experimental technique which is commonly used to study monolayers. The second and third chapters present details on the results of experiments with a monolayer templating technique. This templating technique involves replacement of the molecules comprising a monolayer of either normal alkanes or symmetrical thioethers by symmetrical ethers. The ethers are forced to conform to the structure of the existing template monolayer, which differs from the structure of an ether monolayer formed in the absence of the template. The monolayer templating technique offers researchers a limited method for exercising control over the surface patterns formed by particular molecules.
TABLE OF CONTENTS
Acknowledgments ...iii
Foreword ...vi
Abstract ...vii
Table of Contents...ix
List of Figures and Tables ...xi
Nomenclature...xiii
Chapter 1: Introduction to Physisorbed Monolayers and Scanning Tunneling Microscopy ... 1
1.1 Physisorbed Monolayers ... 1
1.2 Scanning Tunneling Microscopy ... 3
1.3 STM Imaging of Physisorbed Monolayers... 5
1.4 Summary... 6
1.4 References ... 19
Chapter 2: Use of Alkane Monolayer Templates to Modify the Structure of Alkyl Ether Monolayers on Highly Ordered Pyrolytic Graphite. 22 2.1 Overview ... 22
2.2 Introduction ... 22
2.3 Experimental Details ... 24
2.4 Results………... ..25
2.5 Discussion………28
2.6 Conclusions……… ……….30
2.7 References ... 42
Chapter 3: Scanning Tunneling Microscopy Studies of Monolayer Templates: Alkylthioethers and Alkylethers ... 45
3.1 Overview... 45
3.2 Introduction... 46
3.3 Experimental Details ... 47
3.4 Results... 50
3.5 Discussion... 52
3.6 Conclusions ... 56
3.7 References... 69
Chapter 4: Towards Surface Patterning Using Physisorbed Monolayers as Masks ... 72
4.1 Overview... 72
4.2 Introduction... 72
4.3 Preparation of Gold Surfaces ... 77
4.3.1 Experimental Details... 77
4.3.2 Results ... 78
4.3.4 Conclusions ... 80
4.4 Physisorbed Monolayers on Gold... 80
4.4.1 Experimental Details... 80
4.4.2 Results ... 81
4.4.3 Discussion... 81
4.4.4 Conclusions ... 82
4.5 Physisorbed Monolayers for Masks... 83
4.5.1 Experimental Details... 83
4.5.2 Results ... 84
4.5.3 Discussion... 85
4.5.4 Conclusions ... 88
4.6 Summary... 88
LIST OF FIGURES AND TABLES
Figures Page
1.1 Heat of Adsorption Versus Alkane Chain Length ... 8
1.2 Diagram of a Scanning Tunneling Microscope... 9
1.3 Models and Images of HOPG... 11
1.4 STM Image of Hexatriacontane on HOPG ... 14
1.5 STM Image of Tritriacontane on HOPG... 15
1.6 STM Image of 1-Tetradecanol on HOPG ... 16
1.7 STM Images of Monolayer Domain Boundaries ... 17
2.1 Tritriacontane on HOPG ... 32
2.2 Di-n-octadecylether on HOPG... 34
2.3 STM Image of a Mixed Monolayer of Alkanes and Ethers... 38
2.4 STM Image of a Templated Hexadecylether Monolayer... 40
3.1 STM Image and Model of a Monolayer of Hexadecylether ... 59
3.2 STM Image and Model of a Monolayer of Hexadecylsulfide ... 61
3.3 STM Images of Mixed Monolayers of Alkylthioethers and Alkylethers... 63
3.4 Mixed Monolayer Analysis Software... 66
3.5 Solution Versus Surface Concentration... 68
4.1 STM Image of a Large Monolayer Domain ... 90
4.2 STM Images of Evaporated Gold Surfaces ... 91
4.3 Atomic Resolution Images of Gold Samples ... 98
4.4 STM Image of 1-Tetradecanol on Gold... 100
4.5 STM Images of 1,14-Tetradecanediol on Gold... 101
4.6 STM Images of 1,3,5-Benzenetricarboxylic Acid (TMA) on HOPG ... 103
4.7 Models of TMA Monolayer Structures ... 105
4.9 STM Image of Fullerene C60 on HOPG ... 110 4.10 STM Image of Fullerene C60 on Gold ... 111
Tables Page 2.1 Molecular Names, Formulas, and Abbreviations... 31
NOMENCLATURE
Domain: A region of a monolayer within which all of the unit cells are identically oriented Domain Boundary: A region of a monolayer where at least two domains meet
ECSTM: Electrochemical scanning tunneling microscope or electrochemical scanning tunneling microscopy
HOPG: Highly oriented pyrolytic graphite. This is a high-quality, essentially single crystalline sample of graphite.
Lamella: A stripe of molecules within a monolayer domain. The width of a lamella is that of the unit cell of the monolayer structure.
Monolayer: A layer of molecules on a surface. The thickness of the layer is that of a single constituent molecule.
Physisorption: Adsorption to a surface without formation of chemical bonds between the surface and the adsorbate
C h a p t e r 1
INTRODUCTION TO PHYSISORBED MONOLAYERS AND SCANNING TUNNELING MICROSCOPY
1.1 Physisorbed Monolayers
Many simple organic molecules, such as straight-chain alkanes, alcohols, and carboxylic acids, spontaneously assemble into highly ordered monolayers at solid–liquid interfaces. The first reports of this phenomenon were published in the scientific literature in the early 1960s when it was observed that organic molecules, in both neat liquids and in solution, form ordered monolayers on substrates such as graphite, cast iron, and molybdenum disulfide.1,2 At the time, this discovery was primarily of interest to the lubrication and separation industries. The early studies of this phenomenon were conducted using microcalorimetry and consisted of measurements of the heat of adsorption or elution of alkanes and alcohols in contact with solids held at constant temperature. These early studies were typically conducted by injecting solutions of alkanes into a solvent stream flowing through an insulated cell containing a known amount of a powdered sample and measuring heat effects. The resulting data demonstrated that the alkanes formed monolayers on the surfaces of the solids and that the adsorption was due principally to intermolecular interactions such as van der Waals forces and hydrogen bonding rather than to strong interactions between the substrate and the adsorbed molecules.3–7
driving force for the adsorption. Although interactions between the adsorbed alkanes and the surface are relatively weak compared to the intermolecular forces in the case of long-chain alkanes, interactions with the surface are important in the determination of whether physisorption will occur at all on a particular surface material. The heat of adsorption of n-dotriacontane was measured to be 36 kcal mol-1 for a graphite surface, but only 12 kcal mol-1 for a WS2 surface, and 10 kcal mol-1 for a MoS2 surface.2 These data, combined with the tail on the plot shown in Figure 1.1 clearly demonstrate that a portion of the measured heats of adsorption is due to surface–adsorbate interactions. Interactions of this type, however, are dependent upon the fixed surface area of the adsorbate and are essentially independent of the length of the alkane chain. The potential for an adsorbate to form a monolayer structure somewhat commensurate with that of the surface and the polarizability of both the surface structure and the adsorbate molecules are likely to contribute to the strength of the surface–adsorbate forces.8,9 These early studies also demonstrated that highly branched alkanes such as squalane would not form ordered monolayers.10 The presence of branches sterically interferes with the intermolecular van der Waals interactions that drive physisorbed monolayer formation and can prevent the formation of an ordered monolayer.
The effect of varying the solvent was also examined using calorimetry, and it was observed that the monolayers formed more readily when dissolved in branched solvents than when dissolved in straight-chain solvents.11,12
The Parallel Layer Model was developed to explain the observed adsorption behavior. In this model, it is assumed that adsorbed molecules lie flat on the surface without tails extending into the bulk solution. Adsorption from solution is then treated as a heterogeneous displacement reaction between the solvent and the solute. The equilibrium expression can then be written as follows:
Y
X
Y
X
a l n l an + = +
where n is the number of solvent molecules (X) replaced by a single solute molecule (Y). The superscripts a and l refer to the adsorbed and liquid phases, respectively.13
1.2 Scanning Tunneling Microscopy
In the early 1980s Gerd Binnig and Heinrich Rohrer of the IBM Research Division in Zurich introduced the scanning tunneling microscope (STM).14–16 The revolutionary development of this instrument allowed relatively flat electrically conductive samples to be imaged with atomic resolution without contacting or otherwise disturbing the sample surface.
the height of the tip over the sample is monitored and used to produce the surface image. Constant current mode imaging reduces the probability of accidental contact between the tip and surface, while constant height mode imaging permits the use of greater scan speeds. STM images always contain both topographic and electronic information about the sample surface.
The sensitivity of the STM is a product of the quantum mechanical tunneling effect which the method exploits. The magnitude of the tunneling current relates directly to the probability of an electron tunneling through a potential barrier present between the tip and surface, and essentially reduces to a particle-in-box problem. For a rectangular potential barrier, the solutions to this problem have the form Ψ=e±κz, with 2
T e(V E)/
m
2 − h
=
κ ,
where E is the energy of the state and z is the distance between the tip and sample surface. The tunneling current, JT, is related to the tunneling probability and is proportional to Ψ2.17 Thus, 2m (V E)
z 2 T T e e J − −
∝ h . The sensitivity of an STM thus arises from the exponential
dependence of the tunneling current on the distance between the tip and sample. In most cases, the terms of VT and E are such that the magnitude of JT decreases by an order of magnitude for a one angstrom increase in z.17
Scanning tunneling microscopy was widely adopted after it was used to solve the surface structure of the Si(111) 7x7 surface reconstruction.18 STM is a powerful tool for the examination of surfaces and is capable of routinely obtaining atomically resolved images without interfering with surface processes.
number, only a few tips will yield an image as shown in Figure 1.3a; most of the 25–30% of tips that yield images with atomic resolution produce HOPG images, as shown in Figure 1.3c.
1.3 STM Imaging of Physisorbed Monolayers
The first images of molecules lying flat on a graphite surface were published in 1988 and were images of liquid crystals.19 STM was soon used to image alkane monolayers on graphite.20 The stable molecular monolayers proved to be an ideal sample for study by STM. Physisorbed monolayers can be imaged with an STM under ambient laboratory conditions, which vastly reduces the constraints related to sample handling and vibration isolation that are inherent to STM operation under the ultra high vacuum conditions used for many other STM studies.
STM images of physisorbed monolayers on graphite can be obtained under ambient laboratory conditions. A drop of a saturated filtered solution of the molecules of interest is placed on an HOPG sample such that the tip of the probe is wetted by the liquid. The solvent used is most commonly 1-phenyloctane, which possesses a low vapor pressure and does not form a monolayer of its own on the HOPG surface. Other solvents may be used provided that they are not electrically conductive. An image of an alkane monolayer on HOPG is shown in Figure 1.4. The molecules are aligned with their carbon skeletons parallel to the graphite surface. The image of the alkanes is actually that of the hydrogen atoms along the carbon chain which are topographically located closest to the tip as it is scanned over the surface. Individual hydrogen atoms are resolved in the image of a monolayer of n-tritriacontane shown in Figure 1.5. The relative positions of the hydrogen atoms indicate that the molecules lie on the surface with their carbon skeletons parallel to the surface.
Physisorbed monolayers cover the entire surface of an adsorbent such as HOPG. The two-dimensional monolayer structure is analogous to that of three-two-dimensional polycrystalline solids in that it is composed of multiple regions within which the two-dimensional unit cells are identically oriented. Each of these regions is called a domain and domains with differing unit cell orientations meet at regions termed domain boundaries. A single monolayer domain frequently covers the entire area of an STM image as shown in Figure 1.6. The monolayer structure is fluid and movement along domain boundaries can be captured in successive STM images, as shown in Figure 1.7. Studies of the movement within physisorbed monolayers and of the rates of exchange of molecules adsorbed to surface with those in the overlying liquid have been published.28–30
1.4 Summary
Figure 1.1 Heat of Adsorption Versus Alkane Chain Length
Figure 1.2 Diagram of a Scanning Tunneling Microscope
Figure 1.3 Models and STM Images of HOPG
(a) A constant height mode STM image of HOPG. The image exhibits atomic resolution and each carbon atom on the surface is visible. The hexagonal structure of the carbon atoms on the surface is highlighted in white. The deviation from a perfect hexagonal grid is due to thermal drift of the tunneling tip. Imaging conditions were 20 mV bias, 2 nA current, and a scan rate of 30.5 Hz.
(b) Models of the HOPG surface. The model on top shows the view along the direction normal to the surface. The atoms are separated by a distance of 1.42 Å. The model on the bottom shows the edge-on view which illustrates the layered structure of the solid. The distance between the layers is 3.34 Å.
(c) A typical STM image of HOPG. The image shows every other carbon atom on the surface. Imaging conditions are identical to those in (a).
Figure 1.3 Models and STM Images of HOPG
(a)
(c)
Figure 1.4 STM Image of Hexatriacontane on HOPG
Figure 1.5 STM Image of Tritriacontane on HOPG
Figure 1.6 STM Image of 1-Tetradecanol on HOPG
Figure 1.7 STM Images of Monolayer Domain Boundaries
Two constant height STM images of di-n-octadecylsulfide, CH3(CH2)17O(CH2)17CH3, in phenyloctane on HOPG. The images are of the same area of the surface and the time elapsed between them is two minutes. Domain boundaries are shown with white dashed lines. The position and number of boundaries change with time, illustrating the fluid nature of physisorbed monolayers. The imaging conditions were 1200 mV bias, 200 pA current, and a scan rate of 30.5 Hz.
(a)
(b)
1.5 References
(1) Groszek, A. J. Nature 1962, 196, 531–533. (2) Groszek, A. J. Nature 1964, 204, 680.
(3) Everett, D. H. Transactions of the Faraday Society 1965, 61, 2478–2495.
(4) Ash, S. G.; Everett, D. H.; Findenegg, G.H. Transactions of the Faraday Society 1968, 64, 2639–2644.
(5) Hentschke, R.; Winkler, R. G. J. Chem. Phys. 1993, 99, 5528–5534.
(6) Castro, M. A.; Clarke, S. M.; Inaba, A.; Dong, C. C.; Thomas, R. K. J. Phys. Chem. B 1998, 102, 777–781.
(7) Findenegg, G. H.; Liphard, M. Carbon 1987, 25, 119–128.
(8) Groszek, A. J. Proceedings Of The Royal Society Of London Series A Mathematical And Physical Sciences 1970, 473–498.
(9) Florio, G. M.; Werblowsky, T. L.; Muller, T.; Berne, B. J.; Flynn, G. W. J. Phys. Chem. B 2005, 109, (10), 4520–4532.
(10) Kern, H. E.; Findenegg, G. H. J. Colloid Interface Sci. 1980, 75, 346–356.
(11) Fache, U.; Findenegg, G.H.; Kern, H.E.; Liphard, M. in Microscopic Aspects of Adhesion and Lubrication; Georges, J.M., Ed.; Elsevier: Amsterdam, 1982; pp 709–718. (12) Herwig, K. W.; Matthies, B.; Taub, H. Phys. Rev. Lett. 1995, 75, 3154–3157.
(14) Binnig, G.; Rohrer, H. Helvetica Physica Acta 1982, 55, 726–735.
(15) Binnig, G.; Rohrer, H. IBM Journal of Research and Development 1986, 30, 355–369. (16) Binnig, G.; Rohrer, H. Angewandte Chemie—International Edition in English 1987, 26, 606–614.
(17) Methods of Experimental Physics Volume 27: Scanning Tunneling Microscopy; Stroscio, J.A., Kaiser, W.J., Eds.; Academic Press: San Diego, 1993.
(18) Binnig, G.; Rohrer, H.; Salvan, F.; Gerber, C.; Baro, A. Surf. Sci. 1985, 157, L373– L378.
(19) Foster, J. S.; Frommer, J. E. Nature 1988, 333, 542–545.
(20) McGonigal, G. C.; Bernhardt, R. H.; Thomson, D. J. Appl. Phys. Lett. 1990, 57, 28– 30.
(21) A wealth of literature on this topic has been published by the following authors: George W. Flynn of Columbia University; Jürgen P. Rabe of Humboldt Universität in Berlin; Frans C. De Schryver and Steven De Feyter at Katholieke Universiteit Leuven, Belgium; and Adam J. Matzger of the University of Michigan.
(22) Venkataraman, B.; Flynn, G. W.; Wilbur, J. L.; Folkers, J. P.; Whitesides, G. M. J. Phys. Chem. 1995, 99, 8684–8689.
(23) Xie, Z. X.; Xu, X.; Mao, B. W.; Tanaka, K. Langmuir 2002, 18, 3113–3116. (24) Cousty, J.; Van, L.P. Phys. Chem. Chem. Phys. 2003, 5, 599–603.
(26) Claypool, C. L.; Faglioni, F.; Matzger, A. J.; Goddard, W. A.; Lewis, N. S. J. Phys. Chem. B 1999, 103, 9690–9699.
(27) Claypool, C. L.; Faglioni, F.; Goddard, W. A.; Gray, H. B.; Lewis, N. S.; Marcus, R. A. J. Phys. Chem. B 1997, 101, 5978–5995.
(28) Padowitz, D. F.; Messmore, B. W. J. Phys. Chem. B 2000, 104, 9943–9946.
(29) Padowitz, D. F.; Sada, D. M.; Kemer, E. L.; Dougan, M. L.; Xue, W. A. J. Phys. Chem. B 2002, 106, 593–598.
(30) Muller, T.; Flynn, G. W.; Mathauser, A. T.; Teplyakov, A. V. Langmuir 2003, 19, 2812–2821.
C h a p t e r 2
USE OF ALKANE MONOLAYER TEMPLATES TO MODIFY THE STRUCTURE OF ALKYL ETHER MONOLAYERS ON HIGHLY ORDERED PYROLYTIC
GRAPHITE
2.1 Overview
Scanning tunneling microscopy (STM) has been used to investigate the structure of pure and mixed monolayers formed by adsorption of long-chain alkanes and/or ethers on highly ordered pyrolytic graphite. Application of a pure phenyloctane solution of simple alkanes, such as tritriacontane, CH3(CH2)31CH3, produced a monolayer within which the individual molecular axes were oriented perpendicular to the lamellar axes. In contrast, a pure solution of symmetrical long-chain ethers, such as di-n-hexadecylether, CH3(CH2)15O(CH2)15CH3, produced a monolayer within which the molecular axes were oriented at an angle of ≈ 65° relative to the lamellar axes. The compositions of the overlying solutions were then gradually changed either from pure alkanes to nearly pure ethers, or from pure ethers to nearly pure alkanes. When ethers replaced alkanes in the monolayer, the ethers conformed to the orientation within the existing alkane layer, rather than adopting the characteristic orientation of pure ether monolayers. However, when alkanes were incorporated into monolayers that had been formed from pure ether solutions, the orientation of the molecules within the monolayer converted to that characteristic of pure alkanes. Alkane monolayers thus acted as templates for subsequent ether layers, but ether monolayers did not act as templates for alkane layers.
2.2 Introduction
alkane monolayers can be observed using a scanning tunneling microscope (STM) when an atomically flat surface, such as highly ordered pyrolytic graphite (HOPG), is used as a substrate.2–4 STM observations have routinely shown the formation of single, ordered, alkane monolayer domains > 10,000 nm2 in area. Because alkane monolayers can easily cover surfaces in a highly ordered manner, such monolayers are potentially useful for nanometer-scale surface patterning and for the production of novel materials. The formation of these monolayers is driven by favorable van der Waals and hydrogen bonding interactions between adsorbed molecules, rather than by surface–adsorbate interactions. As a result, the organization of molecules within these layers is typically determined by the structure of the molecules as well as by their functional groups.5–8 The inability to control the manner in which a given molecule will orient within a monolayer has led to the development of two auxiliary methods for generating more intricate monolayer patterns: the use of solutions containing a mixture of molecules, and of molecules with elaborate or chiral structures.9–15
The question of interest in this work was whether the structure of the overlayer formed by a given molecule could be influenced, and in fact templated, by the deliberate prior formation of a monolayer having a different structure. Such behavior would enable manipulation of the structure of the resulting overlayers by prior chemical templating of the surface with monolayers having a structure of interest, constituting a form of overlayer lithography. Since the structures of alkane and ether monolayers are determined by low-energy van der Waals interactions, a monolayer structural template that causes only a limited change to these interactions would produce a monolayer close in energy to that of the original structure. For a templating process to be observable, the structure of the overlayer formed using a template must be close in energy to the structure formed without a template, and one of the two structures must be metastable.
a distinctly different overlayer structure. Specifically, straight-chain alkanes and ethers have been investigated because they are known to form differently structured lamellate monolayers on HOPG which are stable and can be imaged by STM for at least several days after their formation. The direct application of a solution of a single alkane, such as tritriacontane, CH3(CH2)31CH3, in phenyloctane produces a monolayer in which the alkanes are in registry and thus have their individual molecular axes oriented perpendicular to the lamellar axes of the monolayer. In contrast, a phenyloctane solution of a symmetrical long-chain ether, such as di-n-hexadecylether, CH3(CH2)15O(CH2)15CH3, produces a monolayer in which each ether molecule is offset from its neighbors.16,17 This offset produces an angle of ≈ 65° between the molecular and lamellar axes.18 Alkane–ether pairs having the same molecular lengths were therefore selected for study. Due to functional group-related differences in tunneling contrast, alkanes and ethers are distinguishable in STM images that exhibit atomic resolution. Thus, the composition of the resulting overlayer could be determined as a function of the relative concentrations of alkanes and ethers in the overlying solution whenever imaging conditions were ideal. In our work, the compositions of the overlying solutions were changed either from pure alkane to nearly pure ether solutions, or from pure ether to nearly pure alkane solutions. The structures of the resulting overlayers were then investigated by in-situ STM experiments.
2.3 Experimental details
internal standard. The solubilities were determined to be: C29, 23 mM; C33, 4.5 mM; C37, 2.0 mM; E29, 75 mM; E33, 71 mM; and E37, 4.8 mM. Hence, the solubility of the ethers exceeded that of the alkanes, and the solubility decreased with increasing chain length. For each length-matched pair of alkanes and ethers, mixed composition solutions were prepared by mixing volumes of the two component solutions in 80:20, 60:40, 40:60, and 20:80 ratios.
STM images were obtained under ambient laboratory conditions using a Digital Instruments (Veeco) Nanoscope III ECSTM controlled by Nanoscope software version 5.12r2. Tips were mechanically cut from 80:20 Pt/Ir wire. A real-time plane-fitting function was applied to the images while scanning. No additional image corrections were used. Each image consisted of 512 sample scan lines. STM images of pure monolayers were obtained under a drop of the appropriate phenyloctane solution that had been placed on a piece of freshly cleaved HOPG. After ≈ 30–45 min, a drop of the length-matched mixed solution having the largest concentration of the species already present on the surface was then added to the cell. For example, after imaging a monolayer formed from a pure C29 solution, 5 μL of an 80:20 C29/E29 mixed solution was added to the cell. STM images of the resulting monolayer were then obtained after ≈ 30–45 min, to allow some time for equilibration of the mixture. The composition of the overlying solution was altered over several steps using the mixed solutions, to ultimately greatly favor the second component of the length-matched mixture. With C29 and E29 for example, after gradually reducing the concentration of C29 in the overlying solution, a few portions of pure E29 solution were added to the overlying solution, to further eliminate C29 from the system. STM images were collected throughout the course of the experiments. Tunneling tips were not changed during experiments, to avoid mechanically disturbing the monolayers.
2.4 Results
oriented with their molecular axes perpendicular to the lamellar axes, whereas the ethers were oriented with their molecular axes at an angle of ≈ 65° with respect to the lamellar axes (Figure 2.2). The characteristic monolayer structures of alkanes and ethers shown in Figure 1 were observed for each of the alkanes and ethers studied herein. Table 2.2 lists the unit cell dimensions measured in pure monolayers of each molecule. Although some thermal drift was evident during scanning, its effect was minimal and the drift did not affect the interpretation of the images. The molecules having longer chain lengths formed monolayers more readily than those having shorter chain lengths, and alkane monolayers generally formed more readily than monolayers of the identical chain-length ether, consistent with adsorption isotherm data.19,20 The expected functional group STM constant-current tunneling contrast was also observed, with ethers exhibiting a dark contrast region around the C-O-C functionality relative to the alkanes or relative to the alkyl groups of the long-chain ethers.16–18
solution well exceeded that at which the transition from 65° to 90° had been observed when alkanes were added to the ether solution. The ether monolayers that were formed from an alkane template exhibited domains of dimensions similar to those of the template and were stable over time. For example, a monolayer left undisturbed overnight that was predominantly E29, formed through replacement of a C29 monolayer, exhibited ether molecules in the perpendicular orientation despite the overlying solution having a 0.94 mole fraction of the ether. Thus two different stable surface structures were observed for monolayers with the same alkane/ether overlayer concentration. The orientation of an alkane template was preserved by predominately ether monolayers at ether concentrations (≥ 0.92 mole fraction) higher than the transition from ether to alkane orientation observed by replacement of ethers with alkanes (0.90 mole fraction ether). For all observed domains, the molecules within the templated monolayers were found to have a consistent orientation relative to the lamellar axes. The surface structures that were observed were determined by whether they had been reached from the pure ether or pure alkane monolayer starting points.
indicate that the composition of the mixed monolayers appeared to consistently reflect, and change with, the composition of the overlying solution. At a given mole fraction of ether to alkane in solution, the composition of the resulting monolayer was approximately independent of whether the alkane or ether was initially present on the surface, even though the structure of the overlayer was clearly a function of the species initially present on the surface.
2.5 Discussion
Molecules of a pure alkane or ether in these physisorbed monolayers are in pseudo-equilibrium with the molecules dissolved in the overlying solution, as a result of molecular exchange between the monolayer and the solution. The residence time for an individual alkane molecule in a monolayer at 22° C has been measured to be 2–5 s.21 Upon addition to the solution, a second molecular species can form a separate monolayer phase or can incorporate into the existing monolayer by filling the spaces created by molecules that have desorbed from the surface.21,22 The data presented herein indicate that a monolayer initially composed of alkanes can act as a template for the exchanged ether molecules.
In monolayers comprised of long-chain alkanes, adjacent molecules experience favorable van der Waals interactions, with the number of such interactions proportional to the length of the alkane chain. These interactions are maximized when the monolayers assemble with the molecules in registry having their molecular axes perpendicular to their lamellar axes as depicted in Figure 2.1b.23,24 In contrast, for ether monolayers, the 65° angle between the molecular and lamellar axes reflects the need to minimize the repulsions between adjacent oxygen atoms by offsetting the molecules by two carbon atoms relative to each other (Figure 2.2b). This orientation results in the loss of favorable van der Waals interactions and thus results in weaker adsorption of the ether than of the length-matched alkane.
Because it was difficult to distinguish between the ethers and alkanes with certainty when the concentrations of the two species were roughly equal in the resulting monolayer, future experiments are planned using molecules that are more easily distinguished in STM images. This should allow us to determine the mole fractions of the two species in the adsorbed monolayer. Further studies, which will include other functional groups, differing molecular lengths, and a comparison of the composition of the contacting solution with that of the monolayer will aid in investigating the effects of changing the overlying solution and in exploring the limitations of this technique.
2.6 Conclusions
Table 2.1 Molecular Names, Formulas, and Abbreviations
Name Formula Abbreviation
nonacosane CH3(CH2)27CH3 C29
di-n-tetradecylether CH3(CH2)13O(CH2)13CH3 E29
tritriacontane CH3(CH2)31CH3 C33
di-n-hexadecylether CH3(CH2)15O(CH2)15CH3 E33
heptatriacontane CH3(CH2)35CH3 C37
Figure 2.1 Tritriacontane on HOPG
(a) Constant-current STM image of a monolayer of tritriacontane, C33H68, adsorbed on a graphite surface. Several molecules are marked by white lines. Imaging conditions were current = 200 pA, Vbias = 1300 mV, and sample rate = 30.5 Hz.
(a)
(b)
β
Figure 2.2 Di-n-Octadecylether on HOPG
(a) STM image of a monolayer of octadecylether, CH3(CH2)17O(CH2)17CH3. Three molecules are marked with white lines. The dark regions appearing in the center of the imaged molecules result from the oxygen atoms. The imaging conditions were I = 200 pA, Vbias = 900 mV, and sample rate = 30.5 Hz.
(a)
(b)
β
Table 2.2 Measured Monolayer Cell Dimensions
Table 2.2 Measured Monolayer Cell Dimensions Measurements from STM monolayer images
Literature values for crystals
Molecule
a/2 (Å) c (Å) β(deg) a/2 (Å) c (Å) β(deg)
nonacosane 36.0 ± 0.4 4.1 ± 0.2 88 ± 2 38.760 ± 0.008
4.950 ± 0.001
90
tritriacontane 44 ± 4 5 ± 1 87 ± 3 43.833 ± 0.009
4.995 ± 0.001
90
heptatriacontane 43 ± 3 4.0 ± 0.3 85 ± 4 49.014 ± 0.001 4.957 ± 0.001 90 di-n-tetradecylether
34 ± 2 4.4 ± 0.4 65 ± 4 — — —
di-n-hexadecylether
43 ± 3 5.0 ± 0.7 66 ± 6 43.85 ± 0.18 5.57 ± 0.01 63.07 ± 0.32 di-n-octadecylether
Figure 2.3 STM Image of a Mixed Monolayer of Alkanes and Ethers
Figure 2.4 STM Image of a Templated Hexadecylether Monolayer
2.7 References
(1) Groszek, A. J. Nature. 1964, 204, 680.
(2) McGonigal, G. C.; Bernhardt, R. H.; Thomson, D. J. Appl. Phys. Lett. 1990, 57, 28– 30.
(3) Venkataraman, B.; Flynn, G. W.; Wilbur, J. L.; Folkers, J. P.; Whitesides, G.M. J. Phys. Chem. B. 1995, 99, 8684–8689.
(4) Rabe, J. P. and Buchholz, S. Science 1991, 253, 424–427.
(5) McGonigal, G. C.; R. H. Bernhardt; Yeo, Y. H.; Thomson, D. J. J. Vac. Sci. Technol., B: Microelectron. Nanometer Struct. —Process., Meas., Phenom. 1991, 9, 1107–1110. (6) Freund, J. E.; Edelwirth, M.; Krobel, P.; Heckl, W. M. Phys. Rev. B: Condens. Matter Mater. Phys. 1997, 55, 5394-5397.
(7) Gorman, C. B.; Touzov, I.; Miller, R. Langmuir 1998, 14, 3052–3061.
(8) Yin, S. X.; Wang, C.; Xu, Q. M.; Lei, S. B.; Wan, L. J.; Bai, C. L. Chem. Phys. Lett. 2001, 348, 321–328.
(9) Yablon, D. G.; Giancarlo, L. C.; Flynn, G. W. J. Phys. Chem. B 2000, 104, 7627– 7635.
(10) Xie, Z. X.; Xu, X.; Mao, B. W.; Tanaka, K. Langmuir 2002, 18, 3113–3116.
(11) De Feyter, S.; Larsson, M.; Schuurmans, N.; Verkuijl, B.; Zoriniants, G.; Gesquiere, A.; Abdel-Mottaleb, M. M.; van Esch, J.; Feringa, B.L.; van Stam, J.; De Schryber, F. Chem.— Eur. J. 2003, 9, 1198–1206.
(13) Wei, Y. H.; Kannappan, K.; Flynn, G.W.; Zimmt, M. B. J. Am. Chem. Soc. 2004, 126, 5318–5322.
(14) Plass, K. E.; Kim, K.; Matzger, A. J. J. Am. Chem. Soc. 2004, 126, 9042–9053. (15) Tao, F.; Goswami, J.; Bernasek, S. L. J. Phys. Chem. B 2006, 110, 19562–19569. (16) Nishino, T.; Buhlmann, P.; Ito, T.; Umezawa, Y. Phys. Chem. Chem. Phys. 2001, 3, 1867–1869.
(17) Padowitz, D. F.; Sada, D. M.; Kemer, E. L.; Dougan, M. L.; Xue, W. A. J. Phys. Chem. B 2002, 106, 593–598.
(18) Claypool, C. L.; Faglioni, F.; Goddard, W. A.; Gray, H. B.; Lewis, N. S.; Marcus, R. A. J. Phys. Chem. B 1997, 101, 5978–5995.
(19) Groszek, A. J. Nature 1962, 196, 531–533.
(20) Duim, W. C.; Clarke, S. M. J. Phys. Chem. B 2006, 110, 23853–23859. (21) Padowitz, D. F.; Messmore, B. W. J. Phys. Chem. B 2000, 104, 9943–9946. (22) Stevens, F.; Beebe, T.P. Langmuir 1999, 15, 6884–6889.
(23) Kern, H. E.; Piechocki, A.; Brauer, U.; Findenegg, G. H. Progress in Colloid and Polymer Science 1978, 65, 118–124.
(24) Claypool, C. L.; Faglioni, F.; Matzger, A. J.; Goddard; Lewis, N. S. J. Phys. Chem. B 1999, 103, 9690–9699.
(25) Craig, S. R.; Hastie, G. P.; Roberts, K. J.; Sherwood, J. N. J. Mater. Chem. 1994, 4, 977–981.
C h a p t e r 3
SCANNING TUNNELING MICROSCOPY STUDIES OF MONOLAYER TEMPLATES: ALKYLTHIOETHERS AND ALKYLETHERS
3.1 Overview
monolayer was more likely to be replaced by a molecule in the overlying solution if it was located next to a molecule that had already been replaced.
3.2 Introduction
Long-chain normal and substituted alkanes in solution spontaneously adsorb onto a number of surfaces, including graphite, molybdenum disulfide, and tungsten disulfide.1 This physisorption process results in the formation of stable, highly ordered monolayers at the solid–liquid interface, and has found relevance in the fields of lubrication, separation, adhesion, catalysis, crystallization, and corrosion-resistance. When an atomically flat surface such as highly oriented pyrolytic graphite (HOPG) is used as a substrate, a scanning tunneling microscope (STM) can be used to obtain images of the adsorbed monolayers.2–4 Images obtained using this method often exhibit atomic-scale resolution, and commonly reveal a single ordered monolayer domain covering a relatively large area of the surface. Physisorbed monolayers represent a route to the spontaneous assembly of highly ordered surface structures with nanometer-scale features, and are thus of particular interest for surface patterning.
The orientation of molecules within a physisorbed monolayer is determined by the shape of the molecules and by the interactions between functional groups.5–8 The surface structures of such physisorbed monolayers generally result in simple two-dimensional patterns. Production of more complex patterns requires the use of overlying solutions that contain a mixture of molecules, or the use of solutions of molecules that have elaborate or chiral structures.9–15
axes at an angle of ~ 65° to the lamellar axes, while the thioethers lie with their molecular axes perpendicular to the lamellar axes.16–19 Interestingly, an ether monolayer composed of molecules oriented in the manner typical of alkanes can be produced through the use of an alkane monolayer template.16 When the HOPG surface is first covered by a monolayer of the normal alkane and the composition of the overlying solution is subsequently changed to favor the symmetrical ether of the same chain length, the ether molecules replace the alkanes while retaining the structure of the alkane monolayer template. Although these earlier studies readily allowed observation of the monolayer templating effect, alkanes and ethers could not confidently be distinguished in the mixed monolayers, due to insufficient functional group contrast in typical STM images of such systems.
In this work, we report the results of a series of experiments involving monolayers of symmetrical alkylthioethers and symmetrical alkylethers. The lamellate monolayers formed on HOPG by pure solutions of symmetrical alkylthioethers are similar to those formed by normal alkanes, in that the thioether molecules lie with their molecular axes perpendicular to the lamellar axes. However, ether and thioether functional groups are easily distinguished in STM images, with the oxygen atom of the ether functionality appearing as a dark, low-contrast region, whereas the sulfur atom in an alkylthioether appears as a bright, high-contrast region. The contrast between the oxygen and sulfur atoms is substantially greater than the contrast observed between alkanes and alkylethers, enabling direct and confident determination of the composition of the mixed monolayers in STM images.19,21 By extending the study of monolayer templates to include dialkylthioethers, we have been able to monitor the progress of template replacement, to analyze the distribution of molecules within mixed monolayers, and to compare the monolayer composition with that of the overlying solution.
3.3 Experimental Details
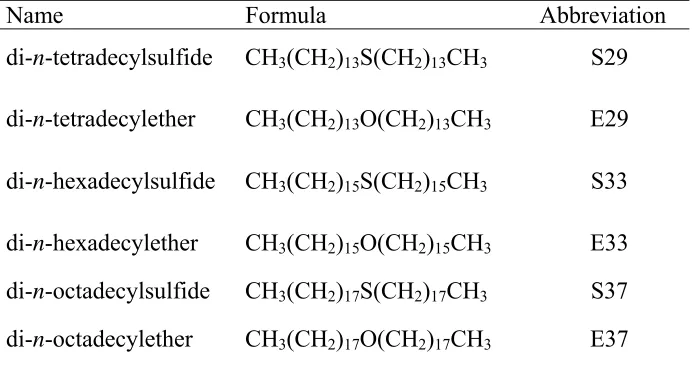
tetradecylether; hexadecylsulfide and hexadecylether; di-n-octadecylsulfide and di-n-octadecylether (all from TCI America, > 95% purity). Table 3.1 lists the chemical formulas and abbreviations used herein for these six compounds. Solutions containing each of these compounds were prepared in phenyloctane (Acros, 99% pure). Phenyloctane is commonly used as a solvent in studies of physisorbed monolayers because it does not form a monolayer on HOPG, and thus does not compete with the formation of monolayers by the dissolved species. The thioethers and ethers used in this study are sparingly soluble in phenyloctane. The solutions were filtered before use and were approximately saturated at room temperature. The concentrations of the solutions were determined using an HP 6890 gas chromatograph equipped with a flame ionization detector, with 1-bromohexadecane (Aldrich) used as an internal standard. The concentrations of the pure solutions were as follows: E29, 75 mM; E33, 71 mM; E37, 4.8 mM; S29, 61 mM; S33, 11 mM; S37, 3.5 mM. The ethers were more soluble than the thioethers, and shorter molecules were more soluble than longer ones. Four or more mixed solutions were prepared for each of the three length-matched pairs of thioethers and ethers. The mixed solutions were prepared by mixing volumes of the matched ether and sulfide solutions in ratios of 80:20, 60:40, 40:60, and 20:80.
monolayer formed from a pure S29 solution, 5 μL of the 80:20 S29/E29 mixture was added to the cell. After allowing ~ 30–45 min for equilibration of the mixture, the resulting monolayer was then observed with the STM. Once images were collected, 5 μL of liquid were removed from the cell, and the liquid was replaced with the same volume of a mixed solution. The relative concentration of the mixture component that was initially present on the surface and in the initial overlying solution was gradually reduced by removing liquid from the cell, and replacing the volume removed with equal volumes of mixed solutions that contained successively lower amounts of the first component of the length-matched pair. The process was continued until the solution composition greatly favored the component that was not initially present on the surface. Solutions containing only the second mixture component were used in the final repetitions of an experiment, to further increase the concentration of the second mixture component in the solution above the HOPG surface. In the example of S29 and E29 given above, after gradually reducing the concentration of S29 in the overlying solution, a few portions of pure E29 solution were added to the cell, to further eliminate the thioether from the system. Tunneling tips were not changed during an experiment, to avoid mechanically disturbing the monolayers. An internal standard was added to the portions of liquid removed from the cell during each experiment, and gas chromatography was used to monitor the composition of the overlying solution by analysis of such samples. These experimental procedures were conducted multiple times, starting with overlying solutions of each of the three thioethers and each of the three ethers.
image, such that each cell of the grid corresponded to a single molecule in the STM image. The user then selected a threshold contrast level, which the software then compared to the average image contrast level over a region in the center of each grid cell. These compared regions thus corresponded to the centers of the molecules, where either a dark oxygen atom or a bright sulfur atom was present. Molecules with centers that had average contrast values higher than the threshold were identified as thioethers, and those that had lower contrasts than the threshold were identified as ethers. The results of the analysis were then overlaid on the image, allowing the user to confirm that the program had correctly performed the molecular identification function. The number and location of molecules of each species within the image were recorded by the software, and the observed distribution of molecules was then compared to statistics produced by 10,000 computer-generated random distributions calculated for the same monolayer structure and composition. These random distributions were then used to calculate the likelihood of finding each length of a cluster within the monolayer in which adjacent molecules were of the same species. The primary role of the software was to assist in counting the large number of molecules in each of a large number of images, and to record both the numbers of molecules and their positions within each monolayer. The output of the program was easily monitored and verified by the user.
3.4 Results
with respect to the lamellar axes, similar to the orientation of alkylethers.20 Padowitz et al. observed for a monolayer of di-n-docosylether, CH3(CH2)21O(CH2)21CH3, both the typical 65° structure and a perpendicular structure.19 Di-n-docosylether has a significantly longer chain length than the ethers used in this study. These authors believed that the perpendicular structure was promoted by the scanning motion of the STM tip and reported that the structure was unstable.19 We did not observe either of these polymorphisms during our study. Dialkylthioether monolayers appeared to form more readily than monolayers of the identical chain-length ether. This observation suggests that the adsorption of dialkylthioethers onto graphite is more favorable than adsorption of the comparable dialkylether. Monolayers formed most readily for the longest chain-length molecules, which is consistent with expectations and with the reported thermodynamic data for adsorption of hydrocarbons on graphite.22
The contrast between the alkylether and alkylthioether molecules in the STM images allowed the two molecule types to be distinguished. Figure 3.4a depicts an example of the over 100 high-quality images that were obtained throughout the set of experiments and analyzed using the image analysis software. An example image analysis is shown in Figure 3.4b. For the example shown in Figure 3.4b, single ether molecules, and clusters of as many as six ethers, are clearly visible in the predominately thioether monolayer. The distribution of ethers and thioethers within each mixed monolayer image was compared to the average of 10,000 computer-generated random distributions for the identical monolayer size, orientation, and composition (Figure 3.4c). The observed molecular distributions were consistently well outside of the standard deviations of the random distributions, and were consistently shifted toward larger cluster sizes. This indicates that, within a mixed monolayer lamella, the probability of a species having an identical species as a neighbor, i.e., a thioether next to a thioether or an ether next to an ether, was much greater than could be attributed to random chance.
The image analysis software also recorded the molecular composition found in each mixed monolayer image. These values were then compared to the measured composition of the overlying solution that was in contact with the HOPG when the image was obtained (Figure 3.5). When the mole fraction of thioether in solution was 0.3–0.9, the mole fraction of thioethers in a mixed monolayer exceeded that of the overlying solution. This behavior was independent of the direction in which this range of solution mixture compositions was approached. The measured surface excess of thioethers was greatest at the low end of this range of solution composition. These results are consistent with the preferential adsorption onto HOPG of thioethers relative to ethers.
3.5 Discussion
perpendicular to the lamellar axes. In stark contrast with the reported di-n-docosylether polymorphism, the templated alkylether monolayers were highly stable and the structure did not preferentially align with the scanning motion of the STM tip. The alkylether monolayers, however, did not act as templates during the replacement of the ethers by the thioethers.
Two cases of structural polymorphism relevant to our work have been reported. For the S37 thioether, a second monolayer structure has been observed, in which the molecules were positioned with their axes at an angle of ~ 60° with respect to the lamellar axes, similar to the orientation of alkylethers.20 For a monolayer of di-n-docosylether, CH3(CH2)21O(CH2)21CH3,the typical 65° structure and a perpendicular structure have been observed.19 Di-n-docosylether has a significantly longer chain length than the ethers used in this study. The authors of that work believed that the perpendicular structure was promoted by the scanning motion of the STM tip and reported that the structure was unstable.19 We did not observe either of these polymorphisms in the monolayers investigated in our study. In contrast with the reported di-n-docosylether polymorphism, the templated alkylether monolayers were highly stable and the structure did not preferentially align with the scanning motion of the STM tip.
atoms, resulting in the 65° angle between the axes (Figure 3.1b). Assuming that the structure observed for the pure untemplated ethers is the most stable structure for the molecules investigated implies that both favorable van der Waals interactions and unfavorable electrostatic repulsions are important in determining the structure of the untemplated pure ether overlayers. The concomitant decrease in the number of van der Waals interactions in the ether monolayers having the 65° angle between the axes, along with effects of polarizability on the strength of adsorption of ethers versus thioethers, correlates with the weaker adsorption observed for an ether relative to that of the identical chain-length alkane or thioether.
When dialkylether molecules are forced by a template to conform to the orientation of an alkane or dialkylthioether monolayer, the energy increase due to adoption of the higher-energy (perpendicular) structure for these ethers is expected to be partially offset by the addition of favorable van der Waals interactions between adjacent molecules in a lamella. However, when dialkylthioether molecules replace molecules of a dialkylether monolayer, the 65° angle between the molecular and lamellar axes causes the loss of the potential van der Waals interactions without providing sufficient offsetting favorable interactions. These expectations are therefore consistent with the observation that the alkylether monolayers did not act as templates for alkylthioether monolayers. Calorimetric studies of the adsorption of alkylthioethers and alkylethers onto HOPG could provide further information on the relative contributions of the surface adsorption energies and intermolecular electrostatic repulsion energies that result in the 65° orientation observed for monolayers of pure alkylethers, and computational methods may provide further insight into the factors that control the packing in templated and untemplated alkylether and alkylthioether monolayers.
thioethers are more strongly adsorbed onto HOPG than the ethers. This behavior is consistent with our observations that thioether monolayers form more readily than monolayers of the identical chain-length ether, and with the expectation that the oxygen– oxygen interaction is repulsive. The preference for adsorption of thioethers was observed to be independent of the species that was initially present on the surface and in the overlying solution. Alkylether monolayers did not act as templates for the alkylthioethers, and data collection for experiments that began with alkylether monolayers was ended once the monolayer structure was observed to have completed the change to the structure characteristic of thioethers. Therefore, the data presented in Figure 3.5 were collected during the templating process and analogous data for mixed, but not templated, monolayers were not collected.
In our previous work, we estimated that the non-optimal interactions in ether monolayers resulted in a stability loss of ~ 8 kcal mol-1 in ether monolayers on HOPG relative to monolayers formed from the identical chain-length alkane on HOPG. The adsorption of a long-chain alkane onto graphite is believed to be primarily driven by van der Waals interactions between neighboring molecules, in accord with the observation that the heat of adsorption for long-chain alkanes increases linearly with increasing chain length.22 Thus, if the energy of adsorption arises from stabilization of a molecule by two neighbors, the stability loss that a molecule in a monolayer would experience as the result of the removal of one of its neighbors can be estimated to be about one-half of that value. The heats of adsorption onto graphite for the molecules used in this study have not been reported; however, we expect the average value for these molecules to be comparable to the heat of adsorption for n-dotriacontane, which has been measured to be ~ 35 kcal mol-1.1,22 The loss of such interactions can thus be expected to dominate the monolayer substitution process. Others have suggested that the replacement of molecules in a monolayer does not proceed randomly.19 The distribution analyses described herein for mixed monolayers, and illustrated in Figure 3.4c, support this hypothesis. Our results are therefore consistent with a process in which the replacement of a molecule on the surface greatly increases the probability that its neighbors will also be replaced.
3.6 Conclusions
Table 3.1 Molecular Names, Formulas, and Abbreviations
Name Formula Abbreviation
Figure 3.1 STM Image and Model of a Monolayer of Hexadecylether
(a) A constant-current mode STM image of di-n-hexadecylether, CH3(CH2)15O(CH2)15CH3, on HOPG. The imaging conditions were I = 250 pA, Vbias = 1200 mV, and a scan rate of 30.5 Hz.
Figure 3.1 STM Image and Model of a Monolayer of Hexadecylether
(a)
(b)
Figure 3.2 STM Image and Model of a Monolayer of Hexadecylsulfide
(a) A constant height mode STM image of di-n-hexadecylsulfide, CH3(CH2)15S(CH2)15CH3, on HOPG. The imaging conditions were I = 200 pA, Vbias = 1200 mV, and scan rate = 30.5 Hz.
Figure 3.2 STM Image and Model of a Monolayer of Hexadecylsulfide
(a)
(b)
Figure 3.3 STM Images of Mixed Monolayers of Alkylthioethers and Alkylethers
(a) A constant-current STM image of the mixed monolayer obtained after addition of di-n-hexadecylsulfide to a di-n-hexadecylether solution. The white lines mark four molecules, and two thioether molecules are indicated by arrows. Imaging conditions: I = 200 pA, Vbias = 1100 mV, scan rate = 30.5 Hz
(b) The monolayer after further addition of di-n-hexadecylsulfide. Two lamellae are indicated by arrows. The molecules lie with their axes perpendicular to the lamellar axes, thus the orientation of the ether template monolayer has been lost. Imaging conditions: I = 200 pA, Vbias = 1100 mV, scan rate = 20.3 Hz
(c) An STM image obtained after di-n-octadecylether was added to a di-n-octadecylsulfide solution. Four molecules are marked with white lines, and arrows indicate ethers that have incorporated into the thioether layer. Imaging conditions: I = 200 pA, Vbias = 1200 mV, scan rate = 30.5 Hz
(a)
(b)
(c)
(d)
Figure 3.4 Mixed Monolayer Analysis Software
(a) An STM image of a mixed monolayer of di-n-octadecylsulfide and di-n-octadecylether. The imaging conditions were I = 200 pA, Vbias = 1200 mV, and scan rate = 30.5 Hz.
(b) A grid has been superimposed upon the image by the analysis software, and the center of each ether molecule has been marked with a black dot. The largest cluster of ethers in the image contains six molecules.
0 0.2 0.4 0.6 0.8
1 2 3 4 5 6 7 8
Molecules in Cluster
F ra ct ion of C ou nt ed M ol ec ul es (c) (a) (b)
Figure 3.5 Solution Versus Surface Concentration
Comparison of the compositions of solutions overlying mixed alkylthioether/alkylether monolayers and the compositions of the monolayers as determined from STM images. The dashed line that indicates equal composition clearly does not fit the data. When the mole fraction of ether in the overlying solution, χether,soln, was less than 0.7, the ethers were underrepresented in the physisorbed monolayer as indicated by a smaller mole fraction of ether on the surface, χether,surf. The error bars represent one standard deviation.
0.0 0.2 0.4 0.6 0.8 1.0
0.0 0.2 0.4 0.6 0.8 1.0
χ
ether,solnχ
et
he
r,
su
3.7 References
(1) Groszek, A. J. Nature 1964, 204, 680.
(2) McGonigal, G. C.; Bernhardt, R. H.; Thomson, D. J. Appl. Phys. Lett. 1990, 57, 28– 30.
(3) Venkataraman, B.; Flynn, G. W.; Wilbur, J. L.; Folkers, J. P.; Whitesides, G. M. J. Phys. Chem. 1995, 99, 8684–8689.
(4) Rabe, J. P.; Buchholz, S. Science 1991, 253, 424–427.
(5) McGonigal, G. C.; Bernhardt, R. H.; Yeo, Y. H.; Thomson, D. J. J. Vac. Sci. Technol., B 1991, 9, 1107–1110.
(6) Freund, J. E.; Edelwirth, M.; Krobel, P.; Heckl, W. M. Phys.l Rev. B 1997, 55, 5394– 5397.
(7) Gorman, C. B.; Touzov, I.; Miller, R. Langmuir 1998, 14, 3052–3061.
(8) Yin, S. X.; Wang, C.; Xu, Q. M.; Lei, S. B.; Wan, L. J.; Bai, C. L. Chem. Phys. Lett. 2001, 348, 321–328.
(9) Yablon, D. G.; Giancarlo, L. C.; Flynn, G. W. J. Phys. Chem. B 2000, 104, 7627– 7635.
(11) De Feyter, S.; Larsson, M.; Schuurmans, N.; Verkuijl, B.; Zoriniants, G.; Gesquiere, A.; Abdel-Mottaleb, M. M.; van Esch, J.; Feringa, B. L.; van Stam, J.; De Schryver, F. Chem.—Eur. J. 2003, 9, 1198–1206.
(12) Nanjo, H.; Qian, P.; Yokoyama, T.; Suzuki, T. M. Jpn. J. Appl. Phys., Part 1 2003, 42, 6560–6563.
(13) Wei, Y. H.; Kannappan, K.; Flynn, G. W.; Zimmt, M. B. J. Am. Chem. Soc. 2004, 126, 5318–5322.
(14) Plass, K. E.; Kim, K.; Matzger, A. J. J. Am. Chem. Soc. 2004, 126, 9042–9053.
(15) Tao, F.; Goswami, J.; Bernasek, S. L. J. Phys. Chem. B 2006, 110, 19562–19569.
(16) Papadantonakis, K. M.; Brunschwig, B. S.; Lewis, N. S. Langmuir 2008, 24, 857– 861.
(17) Claypool, C. L.; Faglioni, F.; Goddard III, W. A.; Gray, H. B.; Lewis, N. S.; Marcus, R. A. J. Phys. Chem. B 1997, 101, 5978–5995.
(18) Nishino, T.; Buhlmann, P.; Ito, T.; Umezawa, Y. Phys. Chem. Chem. Phys. 2001, 3, 1867–1869.
(19) Padowitz, D. F.; Sada, D. M.; Kemer, E. L.; Dougan, M. L.; Xue, W. A. J. Phys. Chem. B 2002, 106, 593–598.
(21) Padowitz, D. F.; Messmore, B. W. J. Phys. Chem. B 2000, 104, 9943–9946.
(22) Groszek, A. J. Nature 1962, 196, 531–533.
(23) Kern, H. E.; Piechocki, A.; Brauer, U.; Findenegg, G.H. Prog. Colloid Poly. Sci. 1978, 65, 118–124.
(24) Claypool, C. L.; Faglioni, F.; Matzger, A. J.; Goddard III, W. A.; Lewis, N. S. J. Phys. Chem. B 1999, 103, 9690–9699.
C h a p t e r 4
TOWARDS SURFACE PATTERNING USING PHYSISORBED MONOLAYERS AS MASKS
4.1 Overview
4.2 Introduction
Stable, highly ordered monolayers are spontaneously formed on a number of surfaces by long-chain normal and substituted alkanes and aromatics in solution.1 These surfaces include graphite, molybdenum disulfide, and tungsten disulfide.2 The primary source of the force driving monolayer formation is favorable intermolecular interactions such as van der Waals forces and hydrogen bond formation.3–7 The molecules do not bond to the surface and are free to exchange with other molecules in the overlying solution. When an atomically flat surface such as highly oriented pyrolytic graphite (HOPG) is used as a substrate, a scanning tunneling microscope (STM) can be employed to observe the monolayers under standard laboratory conditions.8 The physisorbed monolayers cover the entire adsorbent surface and the molecules form monolayers composed of ordered domains with lamellar structures. Many domains can cover the surface to give a two-dimensional structure analogous to that of polycrystalline solids. The surface area covered by a single domain reflects the overall stability of the monolayer, as larger domains reduce the number of unstable domain boundaries in the monolayer. A single ordered domain can easily cover an area greater than 10,000 square nanometers, as seen in Figure 4.1, and it may be possible to increase the average domain size through a thermal annealing process. The ability to produce reasonably large ordered domains with features on the nanometer scale under ambient conditions suggests potential for the use of physisorbed molecular monolayers as templates for surface patterning.
only at the newly uncovered regions of the surface. This sequence would produce a chemically patterned surface with features on the single nanometer scale. Such a surface could be useful for catalysis applications and as a way to tether nanoparticles to a surface in an ordered array, which would allow studies of the electrochemical properties of single nanoparticles.
HOPG is by far the most widely used substrate in studies of self-assembled physisorbed monolayers. This is because HOPG is conductive, is inert under standard laboratory conditions and has a layered structure that allows the easy preparation of an atomically flat surface. The inert nature of HOPG, however, is extremely problematic if one wishes to pattern the surface regions left exposed by a physisorbed monolayer. Thus, in order to pursue this approach to surface patterning, it is necessary to employ a surface that is more amenable to chemical modification. Gold has also been used successfully as a substrate in STM studies and is a promising candidate for a substrate surface for this approach to surface patterning. The gold surface does not significantly corrode or degrade under laboratory conditions and physisorbed monolayer structures similar to those formed on HOPG have been observed on the reconstructed Au(111) surface.9 Although the gold surface is relatively inert under standard laboratory conditions, it is known to react with alkyl sulfides, disulfides, and other soft nucleophiles.10 Gold may therefore prove to be a useful substrate for a demonstration of surface patterning using physisorbed monolayers as masks.
supplier and recommends annealing the surface in a hydrogen flame prior to use. Other commonly used methods of gold surface preparation for STM are adaptations of the method for the preparation of monocrystalline platinum electrodes that was detailed by Clavilier et al.16 These methods involve the use of a single-crystalline gold bead that is purchased or obtained by melting a pure gold wire using a hydrogen-oxygen flame. The resulting bead is etched using either aqua regia or piranha solution, cut along the desired direction, and annealed with a hydrogen flame. 17–19
This work was also performed using an overlying HClO4 solution and the structure of the monolayer was observed to change throughout the course of the experiment.
Images of physisorbed monolayers on HOPG surfaces which incorporate openings into their structure have already been published.26,27 Some of the molecules which have been shown to incorporate spaces into their monolayer structures include liquid crystals and some derivatives of 1,3-disubstituted benzene, dehydrobenzo[12]annulene, and 1,3,5-trisubstituted benzene. Porous monolayers have also been observed to form on Au(111) and Ag(111) surfaces.15,28,29
It has been well established that the simple exposure of a gold surface to a solution of alkyl thiols in ethanol results in the attachment of a single molecular layer of the thiols to the gold surface.10 The thiols act as soft nucleophiles and attach to the gold surface as metal thiolates (RS-M+).30 The properties of the resulting surface can be tuned by altering the functional group on the tail of the thiol molecule.31 The gold–thiol chemistry has also been demonstrated using solutions of thiols and disulfides in acetonitrile, isooctane, and hexadecane.30
after a limited period of exposure to the gold surface. It should be possible to accomplish this through the addition of an additional reagent to the overlying solution. Alkane thiols are weak acids with pKa values near 10.6, and are easily oxidized.34 The alkane thiolate species which attaches to the gold surface is a nucleophile and thus can form bonds with electron-deficient carbon atoms.35 These properties suggest ways to remove excess thiols from the overlying solution in order to arrest the reaction at the surface and caution that the monolayer template must be carefully chosen so that the molecules which comprise it do not contain groups that are likely to react with the thiols.
4.3 Preparation of Gold Surfaces
4.3.1 Experimental Details